


Introduction
The late Quaternary climate is characterized by quasi-periodical asymmetric oscillations with a predominant cycle of ~100,000 years (Stenni Reference Stenni, Oliva and Ruiz-Fernández2020). These global climate changes are driven by varying amounts of summer solar insolation at 65° north due to small changes in Earth's orbit parameters (Milankovitch cycles). This relatively weak initial forcing is then amplified and modulated by the feedbacks from ice-sheet dynamics, ocean circulation and greenhouse gas concentration in the atmosphere (Shakun et al. Reference Shakun, Clark, He, Marcott, Mix and Liu2012). However, earlier in the Pleistocene, the main climate cycles were weaker in amplitude and shorter in duration, with the main period being ~40,000 years, although the variability of solar forcing was similar to that in the subsequent epoch (Berends et al. Reference Berends, de Boer and van de Wal2021). The shift from a 40 ka world to a 100 ka world, known as the Mid-Pleistocene transition (MPT), happened c. 1 million years ago.
The causes of the MPT are still poorly understood. However, the hybrid ice sheet-climate models demonstrate that a decrease in the CO2 concentration in the atmosphere could be one of the major reasons behind it (Berends et al. Reference Berends, de Boer and van de Wal2021). The decline in CO2 through the MPT was probably caused by the initiation of substantive dust-borne iron fertilization of the Southern Ocean during peak glacial times (Chalk et al. Reference Chalk, Hain, Foster, Rohling, Sexton and Badger2017). In the latter study it is also argued that CO2 changes alone cannot explain the MPT, and that another important factor was a change in the dynamics that govern ice-sheet stability, such as that expected due to the removal of subglacial regolith or interhemispheric ice-sheet phase-locking.
Understanding climate behaviour in the pre-MPT CO2-rich world would also help to predict the shape of our planet's climate in the coming centuries, unless humanity is able to drastically reduce carbon emissions in the coming decades (https://www.ipcc.ch/srocc). This highlights the need to obtain experimental data on climate forcings, including the concentration of greenhouse gases, in the distant past.
Marine sediments provide indirect and insufficiently reliable information on past CO2 concentrations (Cui et al. Reference Cui, Schubert and Jahren2020), while polar ice cores provide the only source of direct data on the ancient atmospheric composition. The current longest continuous ice-core record of air composition obtained from the European Project of Ice Coring in Antarctica, Dome C (EPICA DC) project (Luthi et al. Reference Luthi, le Floch, Bereiter, Blunier, Barnola and Siegenthaler2008) extends back for 800,000 years and thus does not cover the MPT period. The oldest ice found so far in Antarctica, dating back 2.7 Ma, was sampled from the Allan Hills blue ice area (Yan et al. Reference Yan, Bender, Brook, Clifford, Kemeny and Kurbatov2019). The study of this stratigraphically disturbed ice provided snapshots of the pre-MPT CO2 concentrations in the atmosphere rather than its continuous record, but it did, in general, confirm that glacial-interglacial greenhouse gas variations were smaller in the 40 ka world than in the present epoch.
The conditions for very old (~1.5 Ma) undisturbed meteoric ice to be preserved in the bottom section of the Antarctic ice sheet have been formulated as follows (Fischer et al. Reference Fischer, Severinghaus, Brook, Wolff, Albert and Alemany2013):
• Low surface mass balance (SMB);
• Intermediate ice-sheet thickness (~2500 m) and/or low geothermal heat flux (GHF), both reducing the risk of encountering basal ice melting (the lower the GHF, the higher the allowed ice thickness);
• Low horizontal ice-flow velocity, typical for ice domes and ice divides, which reduces the risk of basal layer disturbances (ice folding and mixing);
• Flat bedrock topography, which favours (but does not guarantee) the undisturbed layering of the near-bottom ice.
With these constraints, there are only a very few places where very old ice with undisturbed stratigraphy can be found; all are located close to the main ice divide of the East Antarctic Ice Sheet (EAIS) (Fischer et al. Reference Fischer, Severinghaus, Brook, Wolff, Albert and Alemany2013). The vicinities of the Antarctic domes A, C and F and of Ridge B are thought to be the most promising sites for searching for such ice (Fig. 1).
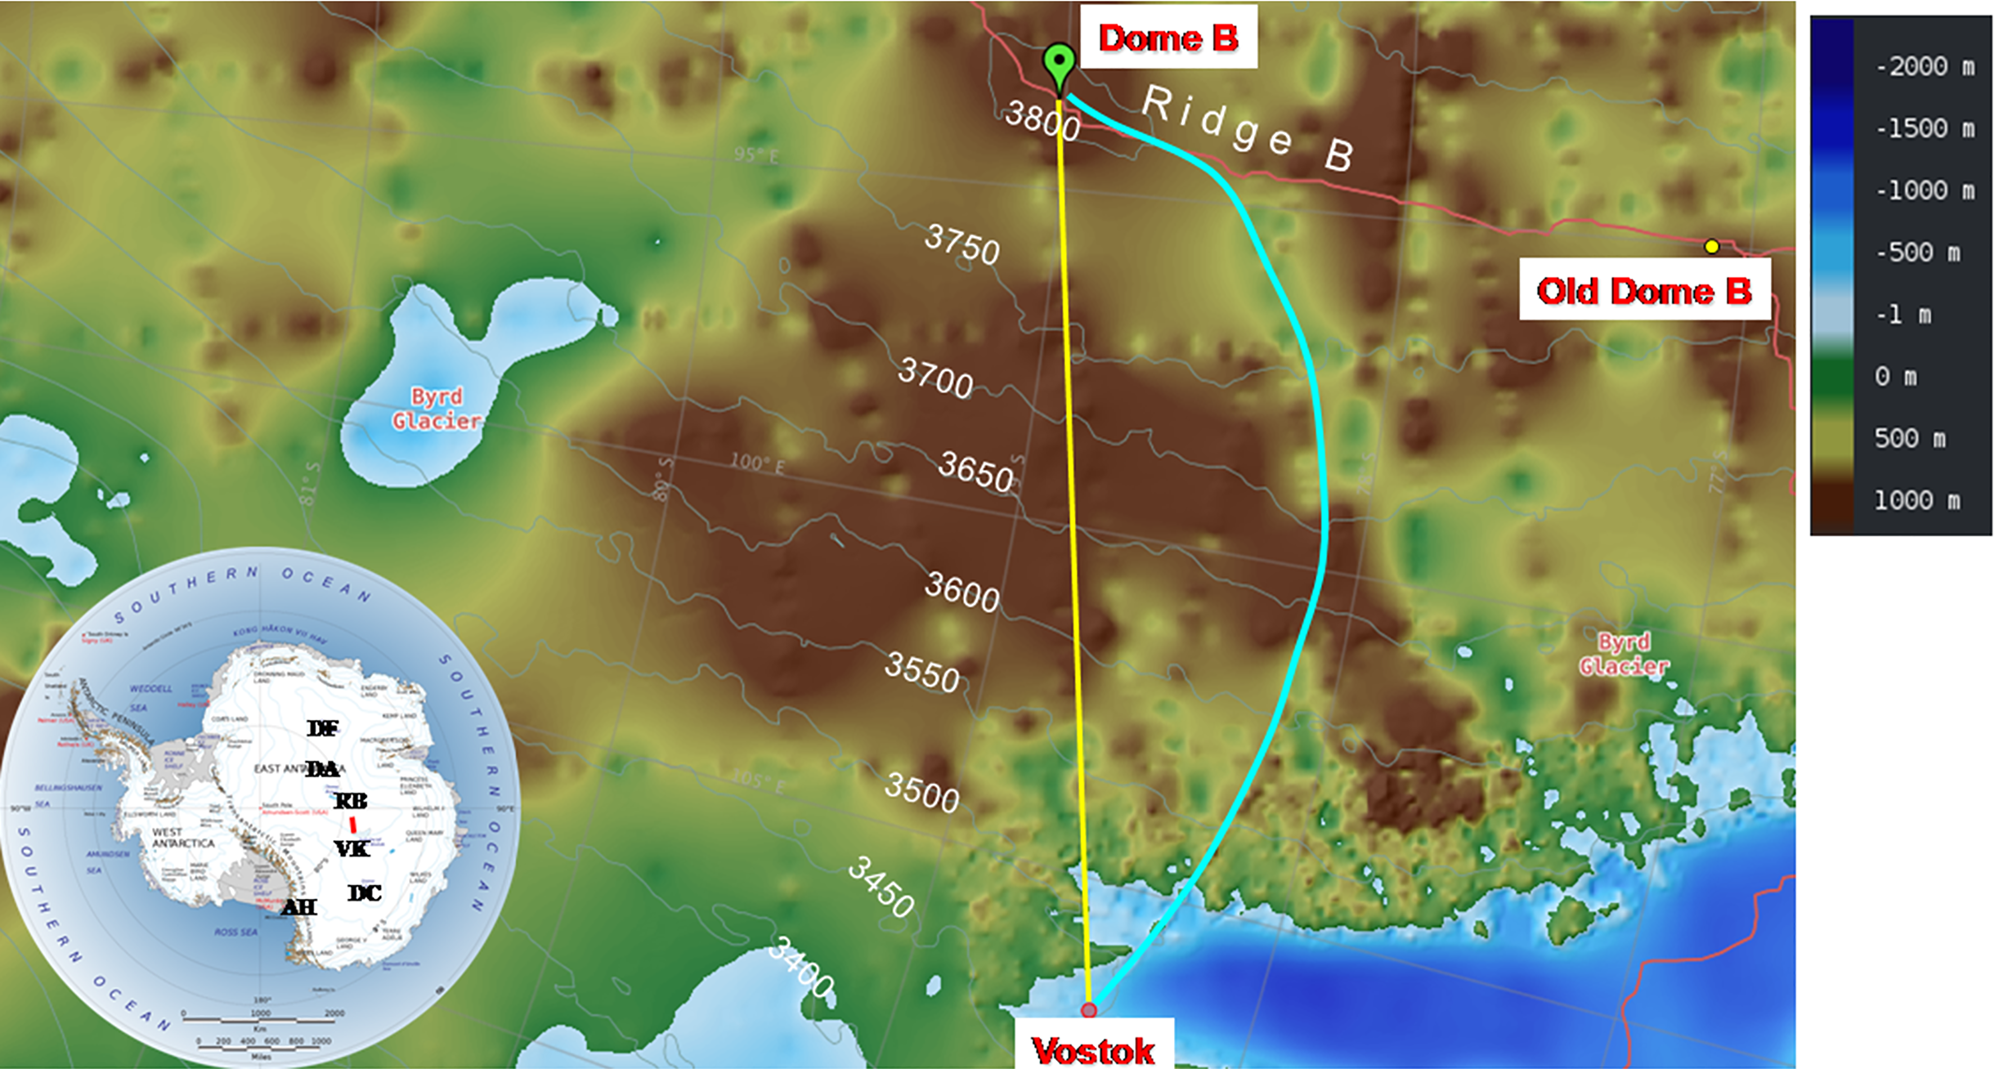
Fig. 1. Map of the scientific traverse from Vostok to Dome B. Colours show the bedrock elevation in metres above sea level. The coloured lines are the traverse route (yellow), the present-day Vostok ice-flow line (blue; Salamatin et al. Reference Salamatin, Tsyganova, Popov, Lipenkov and Hondoh2009) and the ice divide (pink). The map is drawn with the use of Antarctic Digital Database (https://www.add.scar.org). The inset shows the locations of the sites mentioned in the text, as well as of the traverse route (red line). AH = Allan Hills; DA = Dome A; DC = Dome C; DF = Dome F; RB = Ridge B; VK = Vostok.
Drilling and studying old Antarctic ice is one of the priority tasks for the international ice-core community, represented by the International Partnership for Ice Core Science (IPICS; http://pastglobalchanges.org/science/end-aff/ipics/intro). Apart from the continuing investigation of the Allan Hills area, there are several oldest ice projects currently being developed in Antarctica. Geophysical surveys to search for the best sites for future deep drilling have been conducted in the vicinity of Dome Fuji (Karlsson et al. Reference Karlsson, Binder, Eagles, Helm, Pattyn, Van Liefferinge and Eisen2018) and Dome A (Zhao et al. Reference Zhao, Moore, Sun, Tang and Guo2018). Near Dome C a drilling site has already been selected 37 km south-west of Concordia station (Passalacqua et al. Reference Passalacqua, Cavitte, Gagliardini, Gillet-Chaulet, Parrenin, Ritz and Young2018), and preparation for the drilling operation began during the 2019–2020 austral season as part of the ‘Beyond EPICA Oldest Ice’ project (https://www.beyondepica.eu). All of these efforts complement each other as several cores are thought to be needed in order to prove the integrity of the climatic record from old basal ice. Indeed, in all of the cores that reached bedrock so far, the palaeoclimatic signal in the bottom part of the core was altered to various extents, and it will come as no surprise if this problem is also be encountered in future cores.
In the available Vostok ice core, the continuous climate record spanning the last 420,000 years ends at a depth of 3310 m (Petit et al. Reference Petit, Jouzel, Raynaud, Barkov, Barnola and Basile1999). Below this depth and down to the upper boundary of the Lake Vostok accreted ice (3539–3769 m), the meteoric ice has experienced severe deformation, which has resulted in ice folding and mixing (Souchez et al. Reference Souchez, Jean-Baptist, Petit, Lipenkov and Jouzel2002). Recent developments in the radiokrypton dating technique (Ritterbusch et al. Reference Ritterbusch, Chu, Crotti, Dong, Hu and Gu2019) and in a new dating method based on the phenomenon of air-hydrate crystal growth in polar ice (Lipenkov & Ekaykin Reference Lipenkov and Ekaykin2018) have allowed us to construct a provisional age-depth relationship for the disturbed section of the Vostok core, indicating that in the depth interval 3500–3538 m the age of meteoric ice reaches 1.2 Ma (Lipenkov et al. Reference Lipenkov, Salamatin, Jiang, Ritterbusch, Bender and Orsi2019). This is the first experimental confirmation that such old ice survived in the central part of the EAIS, which supports the international effort aimed at obtaining pre-MPT ice cores in this region of Antarctica. In addition, the finding of ice older than 1 Ma in the vicinity of Vostok implies that upstream of the station, in the Ridge B area, where the ice-flow line that passes through the Vostok borehole has its source, very old ice with undisturbed stratigraphy may exist.
Ridge B is part of the main Antarctic ice divide stretching from north-north-east to south-south-west, ~300 km west of Vostok Station. It is one of the largest poorly explored regions in Antarctica, with little information available. Scarce geophysical data (Fretwell et al. Reference Fretwell, Pritchard, Vaughan, Bamber, Barrand and Bell2013) seem to indicate that the bed relief at Ridge B represents mountains or hills reaching 500–1000 m above sea level (a.s.l.), which are covered by a 2000–3000 m-thick ice sheet (Fig. 1). There are no direct data on GHF for Ridge B, but indirect approaches provide estimates ranging between 50 and 70 mW m−2 (Burton-Johnson et al. Reference Burton-Johnson, Dziadek and Martin2020). With such ice thickness and heat flux, the temperature near the bottom of the glacier is expected to be as low as -15°C (Salamatin et al. Reference Salamatin, Tsyganova, Popov, Lipenkov and Hondoh2009).
A preliminary theoretical investigation of Ridge B with regard to its potential as one of the oldest-ice areas in Antarctica has been carried out by Skakun et al. (Reference Skakun, Lipenkov, Parrenin, Ritz and Popov2019). Using the 3D Grenoble Ice Sheet and Land Ice (GRISLI) model (Quiquet et al. Reference Quiquet, Duma, Ritz, Peyaud and Roche2018), they were able to reconstruct the old-ice trajectory between Ridge B and Vostok and to locate the formation site (Dome B) of the old meteoric ice discovered in the Vostok core. It was shown that the old-ice trajectory deviates only slightly from the present-day Vostok ice-flow line (VFL; Fig. 1) constrained by modern ice-sheet topography (Salamatin et al. Reference Salamatin, Tsyganova, Popov, Lipenkov and Hondoh2009), and that the displacement of Dome B (the source of the VFL) over the last 1 million years did not exceed 50 km (Skakun et al. Reference Skakun, Lipenkov, Parrenin, Ritz and Popov2019). The research also showed that the probability that the basal ice in the vicinity of Dome B reached a pressure melting point over the last 1.5 Ma is < 15% (Skakun et al. Reference Skakun, Lipenkov, Parrenin, Ritz and Popov2019). Thus, all available information suggests that Ridge B can be recommended for a detailed reconnaissance survey aimed at identifying specific candidate sites for new deep drilling for the oldest ice.
Dome B (79.02°S, 93.69°E, 3807 m a.s.l.) - the topographic dome at Ridge B discussed in this paper - should be distinguished from the old Dome B base (77.08°S, 94.92°E, 3770 m a.s.l.; see Table I), where a drilling project was carried out in the late 1980s (Jouzel et al. Reference Jouzel, Vaikmae, Petit, Martin, Duclos and Stievenard1995). As the site conditions at the source of the VFL (the true Dome B) have not been available for a long time, in publications related to Vostok ice-core studies (e.g. Jouzel et al. Reference Jouzel, Barkov, Barnola, Bender, Chappellaz and Genthon1993, Petit et al. Reference Petit, Jouzel, Raynaud, Barkov, Barnola and Basile1999) it was commonly assumed that they are similar to those at the old Dome B drilling base, which is situated ~220 km north of the true dome (Fig. 1).
Table I. Characteristics of the Vostok, old Dome B and true Dome B sites.

Notes: SMB is the mean surface mass balance between 1816 and the present day; temperature is the firn temperature in the layer below seasonal variability (depth of 10 m or more); δ18O is the mean oxygen-18 concentration in the firn layer between the Tambora layer (1816) and the snow surface.
In order to obtain basic information on the glaciological conditions at Dome B and along the VFL, and as a first step towards a comprehensive reconnaissance study of this area, in January 2020 the Russian Antarctic Expedition carried out the first scientific traverse to Dome B from Vostok Station. The objectives of this traverse were formulated as follows:
• To collect data on SMB, snow properties (density, stable water isotopic composition and chemical content) and firn stratigraphy, as imaged with ground-penetrating radar (GPR), along the traverse route from Vostok to Dome B;
• To drill a 20 m firn core and to study a 2 m snow pit at Dome B in order to assess the present-day multi-year average SMB and to reconstruct the climate variability in this region over the past 400 years;
• To carry out geodetic measurements along the route and at Dome B in order to precisely define the position of the dome and to study the ice-flow velocity field in its surroundings.
The following sections of the paper describe the first results obtained during this traverse.
Data and methods
The traverse started from Vostok towards Dome B at 2 p.m. local time on 24 January 2020. The caravan consisted of two PistenBully 300 Polar tractors, one balok (a crew box mounted on a sledge) and one fuel tank (Fig. 2). Throughout the entire journey we performed kinematic Global Navigation Satellite System (GNSS) measurements as well as GPR profiling. Every 5 km the traverse made a short stop for glaciological observations (installation of a snow stake, measurements of upper snow density and collecting snow samples for water stable isotope and chemical analyses).
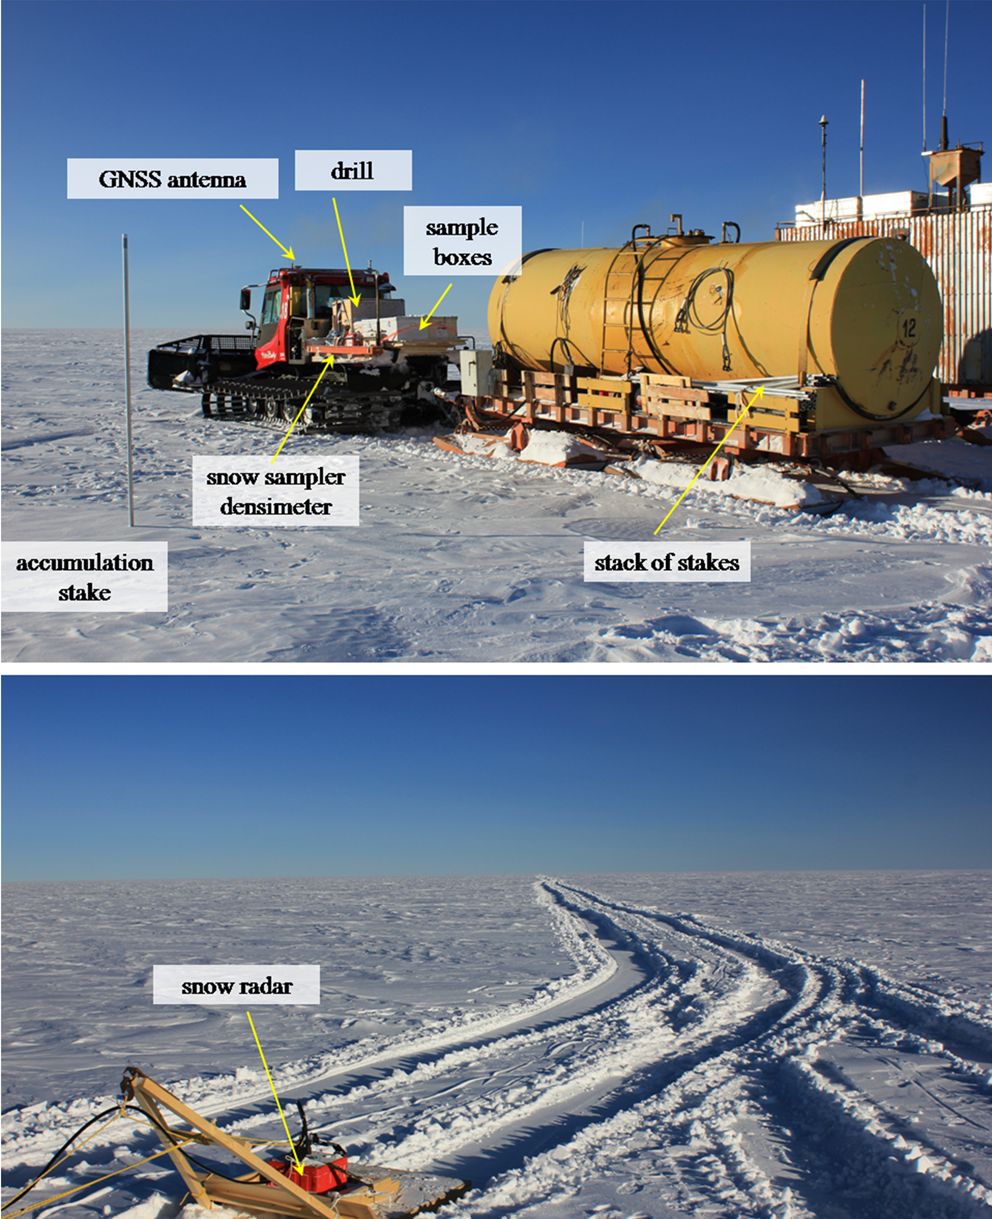
Fig. 2. The scientific traverse to Dome B en route. Upper panel: arrangement of the scientific equipment during the traverse; lower panel: sledge with the snow radar towed behind the traverse. GNSS = Global Navigation Satellite System.
The average speed of the traverse on the move was 9.7 km h−1, meaning that 5 km intervals were passed approximately every 31 minutes. Aside from the short stops, we also made four longer stops a day for refuelling, meals and rest. At such a speed, the traverse arrived at Dome B at 6 p.m. on 26 January.
On arrival, firstly we installed the drilling equipment and organized static GNSS measurements. The next day we completed the drilling of a 20.5 m firn core and installed geodetic markers for the precise determination of local flow directions and velocities. The firn temperature was measured after 12 h equilibration of the platinum thermometer at the hole's bottom at 20.5 m depth. A snow stratigraphy investigation and snow sampling were carried out in a 2 m pit. Finally, a seven-snow-stake farm was set up in the vicinity of the camp. The traverse left Dome B at ~5 p.m. on 28 January and arrived at Vostok Station in the early morning of 30 January.
Kinematic GNSS survey
During the entire traverse (including the short stops and the stay at Dome B) kinematic GNSS measurements were carried out. For this, a Leica 1200_GRX GNSS system was used whereby the Leica AX1203 GNSS antenna was mounted on the roof of the lead vehicle (see Fig. 2). Although GNSS denotes the entirety of global navigation satellite systems, only Global Positioning System (GPS) and Global Navigation Satellite System (GLONASS) data were recorded. The sampling interval was set to 1 s.
As the GNSS analysis is based on the recorded raw data, it is usually done in post-processing. For this, the Leica raw data were converted to the receiver-independent exchange format (RINEX). In this process, the data were also resampled to an interval of 15 s, which corresponds to a distance of ~42 m between two measurement points (for a maximum vehicle speed of 10 km h−1). For the processing, the precise point positioning (PPP) method was utilized. The PPP method uses the precise ephemerides of the satellite orbits as fiducial points. Besides these precise and consistent orbit coordinates, further data and models have to be introduced such as precise clock parameters, which are generally based on consistent processing (Villiger & Dach Reference Villiger and Dach2020).
A feasible and easy-to-use framework for the PPP processing is provided by Natural Resources Canada (NRC; https://webapp.geod.nrcan.gc.ca/geod/tools-outils/ppp.php). The NRC PPP processing makes use of the final products of the International GNSS Service (IGS). In the data preparation for the processing it has to be clarified which point the height is referenced to. For this, the height of the GNSS antenna above the snow surface was measured at each stop of the traverse. Thus, we obtained 57 measurements for the traverse from Vostok Station to Dome B and 5 measurements for the return traverse. From these measurements, a mean antenna height of 2.76 ± 0.04 m was determined and used in further processing.
The kinematic PPP processing delivers 3D coordinates (given as longitude, latitude and elevation) together with accuracy measures for each measurement point along the traverse. Over all points, the inferred height has an accuracy of better than 10 cm. This measure results, on the one hand, from the abovementioned uncertainty of the GNSS antenna height of ± 4 cm, taking the effect of the moving vehicle into account, which subsides differently into the upper snow/firn layer and executes jerky, harsh movements from time to time. On the other hand, the PPP processing yields an accuracy of ± ~6 cm, which is on the expected order of magnitude for such measurements as obtained in previous campaigns (Schröder et al. Reference Schröder, Richter, Fedorov, Eberlein, Brovkov and Popov2017). To check the accuracy, the height differences between the outward and the return trip were calculated. The mean of these differences is 2.5 ± 11 cm. The larger uncertainty measure reflects interpolation errors and the fact that the return trip did not exactly follow the same way as the route from Vostok Station to Dome B. Therefore, an additional simple crossover analysis was performed. Taking > 100 crossing points between the outward and return routes into account, a mean height difference of 3.5 ± 8.1 cm was inferred. In this way, the crossover analysis confirms the results and their accuracy. The resulting elevation profile along the traverse route is shown in Fig. 3a. In order to verify our results, we compared the GNSS-inferred elevation data with the high-resolution (8 m) Antarctic Digital Elevation Model - Reference Elevation Model of Antarctica (DEM REMA) (Fig. 3a) (Howat et al. Reference Howat, Porter, Smith, Noh and Morin2019). The mean difference between the two datasets is 0.11 m, which indicates that the REMA model underestimates the ice surface height in this region of Antarctica. The standard deviation value of 0.26 m reflects the uncertainties both in the GNSS data and in the REMA model. Therefore, this comparison confirms the level of accuracy reached for the GNSS-measured elevations.
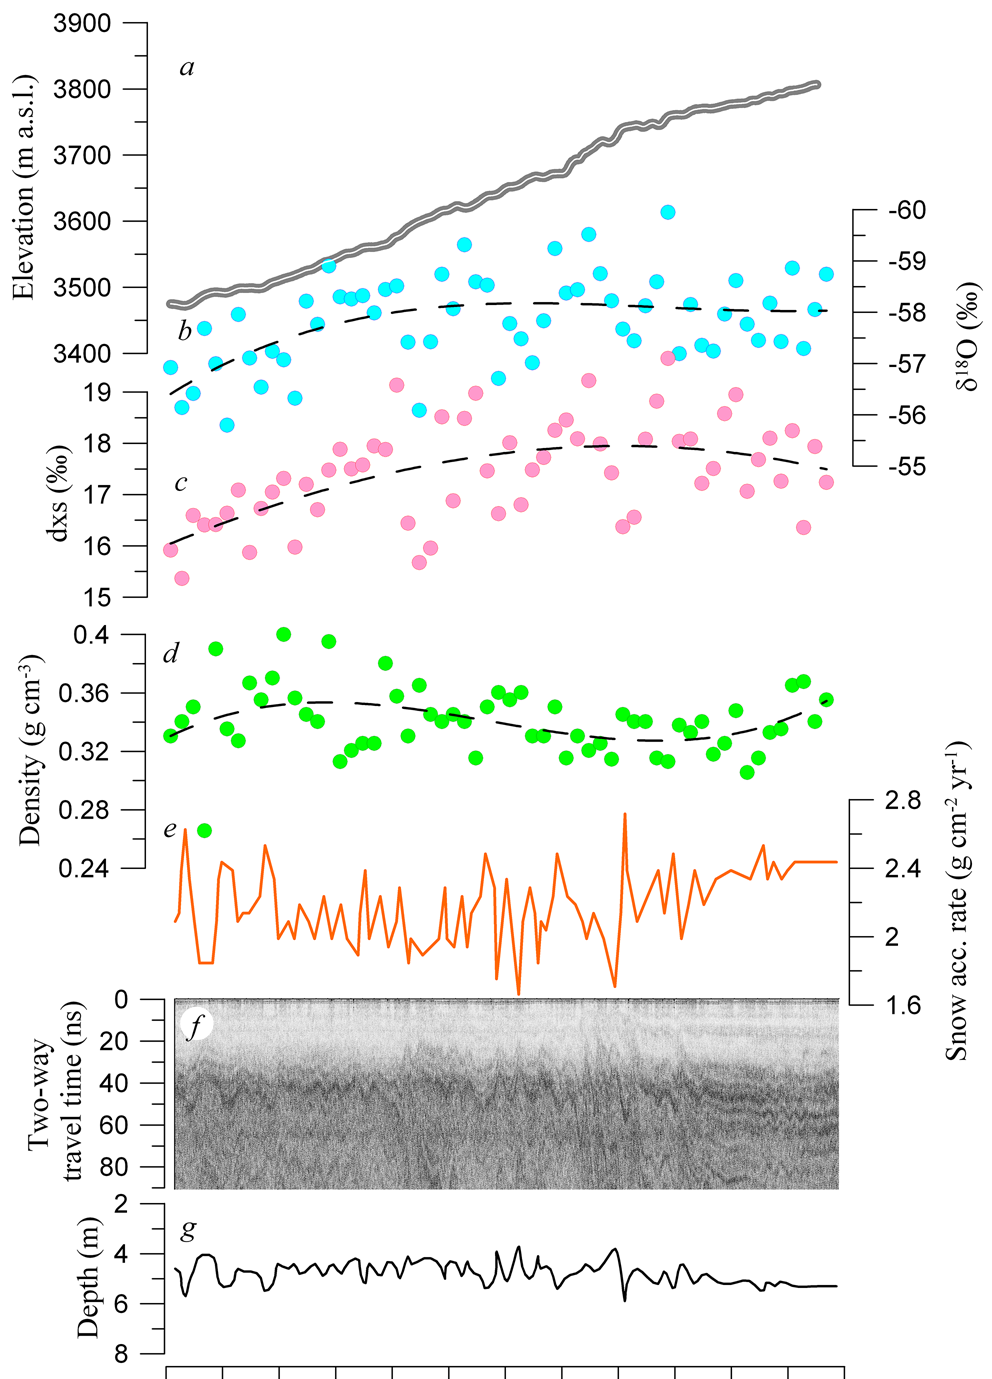
Fig. 3. Glaciological data collected along the Vostok-Dome B traverse route. a. Ice surface elevation: thick grey line = REMA 8 elevation model (Howat et al. Reference Howat, Porter, Smith, Noh and Morin2019); thin white line = Global Navigation Satellite System-inferred elevation. m a.s.l. = metres above sea level. b. Concentration of oxygen-18 in the upper 1.5 m of snow. c. Values of deuterium excess (dxs) in the upper 1.5 m of snow. d. Mean density of the upper 20 cm of snow. e. Mean net snow accumulation rate over the last 83 years as derived from the ground-penetrating radar (GPR) data. f. GPR profile (time section). g. Depth interpretation of the brightest internal reflection horizon.
Ground-penetrating radar profiling
For radar imaging of the shallow snow and firn stratigraphy along the traverse route, we used a GSSI SIR-3000 GPR with a 400 MHz antenna. Preliminary tests at Vostok prior to the traverse allowed us to define the optimal parameters of the survey:
• Scan frequency: 50 kHz;
• Vertical resolution: 4096 samples;
• Scan depth: 100 ns;
• Time resolution: 3 scans s−1;
• Signal filtering: high- and low-pass filters set at 50 and 300 MHz, respectively, and the others set to zero.
The system block was installed inside the second tractor's cabin. In order to reduce the noise from the vehicle, the cable was stretched without strong bends and loops through the hatch in the cabin's roof, over the roof of the balok to a sled-mounted radar antenna flexibly fixed ~5 m behind the balok (Fig. 2). The chosen parameters listed above guaranteed that every 5 km interval was recorded in a single file with a sufficient resolution before the controller's memory overflowed. Initial data were recorded in ‘.dzt’ files and processed using the Radan 7 (GSSI) software to dampen the instrumental noise and to produce а radio-echo cross-section along the whole route.
In the GPR time section presented in Fig. 3f one can identify several internal reflection horizons (IRHs) that can be traced from Vostok to Dome B. For the brightest IRH (at ~43 ns in the time section; Fig. 3f), which can be unambiguously traced along the entire route of the traverse, we defined the depth using the model by Popov & Eberlein (Reference Popov and Eberlein2014) to transform the time section into a depth section (Fig. 3g). To calculate the vertical velocity of the electromagnetic wave propagation, we used the firn density data obtained at Vostok (Veres et al. Reference Veres, Ekaykin, Lipenkov, Turkeev and Khodzher2020), assuming that the density-depth profile remains invariant when moving along the route, the latter assumption being supported by the firn density data obtained at Dome B (see below).
Using IRHs as isochrones, we derived the spatial distribution of the present-day SMB along the traverse route. The mean SMB between Vostok and Dome B (Fig. 3e) was calculated from the depth data for the brightest IRH shown in Fig. 3g. The depth of this IRH at Vostok is 4.6 m, and the age of firn at this depth is ~83 years (Veres et al. Reference Veres, Ekaykin, Lipenkov, Turkeev and Khodzher2020).
Glaciology and snow sampling
Every 5 km of the route we installed a snow-accumulation stake (Fig. 2) and measured the density of the upper 20 cm of snow. At each of the 59 glaciological points we also sampled snow for stable water isotope and chemical content. The isotope samples were collected from the upper 1.5 m layer of snow. They were transported frozen to the Climate and Environmental Research Laboratory (CERL) at the Arctic and Antarctic Research Institute (AARI) and measured with the help of a Picarro L2140 laser analyser for oxygen-18 and deuterium concentration. The reproducibility of the results as defined by re-measurement of several randomly chosen samples is 0.13 for δ18O, 0.9 for δD and 0.5 for deuterium excess (dxs = δD - 8δ18O). As the experimental uncertainties are one order of magnitude lower than the natural spatial variability of snow isotopic content, the obtained results shown in Fig. 3b & c are sufficiently accurate for the purposes of this study.
The samples for chemical analysis, representing the upper 10 cm of snow, were collected in sterile Corning containers. They will be analysed at the Limnological Institute of the Siberian Branch of the Russian Academy of Sciences (LIN SB RAS, Irkutsk) in order to investigate the spatial distribution of major ions in the snow along the traverse route. At the time when this manuscript was submitted the samples had not yet been analysed, so the chemical content of the snow will be presented elsewhere.
Work at Dome B: shallow core and snow pit studies
The 20.5 m firn core, hereafter referred to as the RB20 core, was drilled with the aid of a light mechanical corer that had previously been tested repeatedly in the vicinity of Vostok. The power for the drill (220 AC) was provided by the diesel generator in the balok. The drilling proceeded in a routine fashion. The core recovery was 94%, whereas the core losses mainly occurred in the loose snow near the ice-sheet surface. The temperature of the air in the hole was -58.1 ± 0.2°C, measured after the temperature probe had been kept for 11.5 h at the hole bottom at 20.5 m depth.
The whole RB20 core was packed in plastic bags and transported to the glaciological lab at Vostok, where electrical conductivity measurements (ECMs) and density measurements were conducted continuously over the entire length of the core. The RB20 density profile, obtained by core size and weight measurements (Fig. 4b), is very similar to that at Vostok Station (Veres et al. Reference Veres, Ekaykin, Lipenkov, Turkeev and Khodzher2020), which points to similar conditions of the densification process at the two sites.
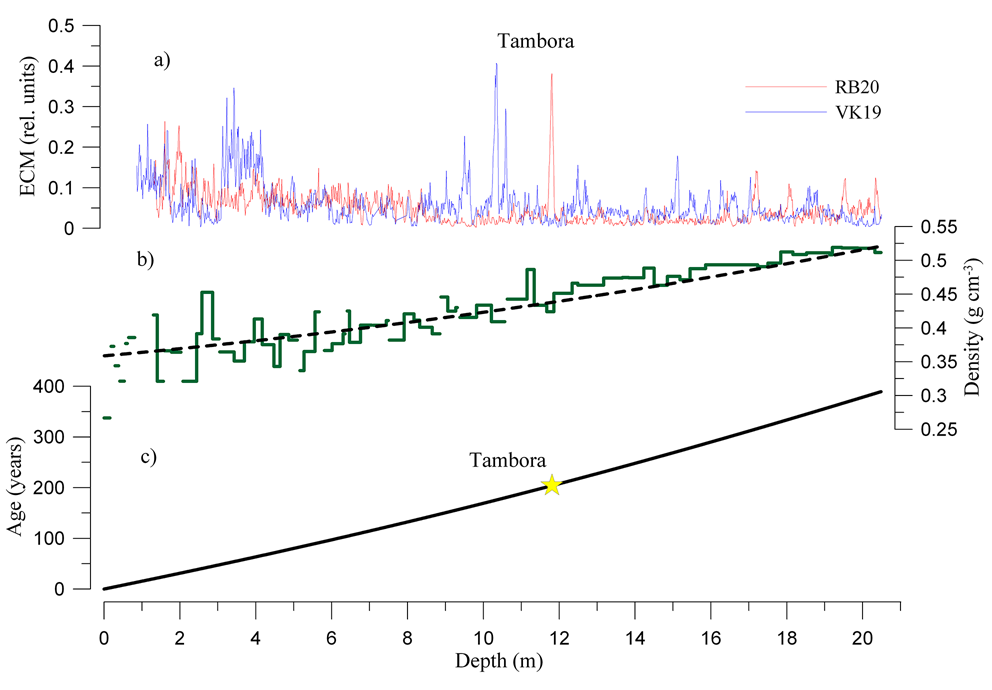
Fig. 4. Glaciological data from the RB20 firn core. a. Electrical conductivity profiles of the RB20 (red) and Vostok (blue) cores. The Tambora volcanic peak is labelled. b. Firn density profile (green stepped line). The dashed curve is the approximation of the firn density profile at Vostok (Veres et al. Reference Veres, Ekaykin, Lipenkov, Turkeev and Khodzher2020). c. Preliminary timescale of the RB20 firn core based on the Tambora peak and density profile.
ECMs on firn and ice cores are commonly used to detect sulphate-rich layers containing the products of volcanic eruptions, which reveal themselves as sharp spikes in the ECM records. In Fig. 4a, we compare the ECM profile of the RB20 core with a similar profile from Vostok containing a well-dated and robustly identified ECM peak associated with the Tambora eruption at a depth of 10.5 m (Veres et al. Reference Veres, Ekaykin, Lipenkov, Turkeev and Khodzher2020). The eruption itself happened in 1815, while the Antarctic snow layer containing its products is dated at ad 1816 (Osipov et al. Reference Osipov, Khodzher, Golobokova, Onischuk, Lipenkov and Ekaykin2014). In the RB20 ECM record, a similar peak is found at a depth of 11.81 m. The depth of the Tambora eruption's signal and the experimental density profile were used for preliminary dating of the RB20 core. According to our tentative chronology (Fig. 4c), the age of the firn at the core's bottom is ~390 years.
A thin slab was cut from the core, along the core's axis, with the aid of a band saw. It went to CERL AARI for isotope measurements with a 10 cm resolution. The remaining part of the core went to LIN SB RAS for chemical analysis (this will be discussed elsewhere).
In the 2.1 m-deep snow pit rb65, which was excavated ~100 m upwind from the camp, we collected snow samples for water isotope and chemical analyses with a 10 cm resolution. Observations made in the pit showed that the major visual stratigraphic features of the snowpack at Dome B are similar to those at Vostok: the snow grains become coarser with depth and medium-size-grained layers alternate with fine-grained hard wind slabs and with coarse-grained layers of depth hoar. The layers are often separated by thin radiation crusts. The mean thickness of the layers is 6.7 cm, which is also typical for the snowpack at Vostok.
The isotope analysis of the RB20 core and snow pit samples was carried out at CERL AARI. The obtained isotopic profile will be used to characterize climate variability at Dome B in the recent past, which is beyond the scope of this paper.
Work at Dome B: geodetic works
Static GNSS measurements were performed during the whole stay at Dome B (42.5 h). For this, we installed a geodetic marker (a metal pole) on which an antenna was mounted with the aid of an adapter. After the measurements had been stopped, the antenna was removed, but the adapter was left on the pole. This will allow for more precise installation of the antenna during repeat measurements.
In addition, a geodetic polygon consisting of four markers was set up. The markers were installed north, east, south and west of the camp at a distance of 5 km. At each marker, the GNSS measurements lasted for 1 h. During the polygon installation, three receivers were operating simultaneously: 1) static measurements at the Dome B camp, 2) static measurements at the polygon and 3) kinematic measurements with the antenna on the roof of the tractor's cabin. Repeated geodetic observations in the future will allow us to reconstruct a 2D field of the glacier surface movement and to precisely locate the position of the topographic dome.
Results
Considering the spatial variability of snow properties and the local accumulation pattern revealed by the GRP-detected IRHs, the whole transect between Vostok and Dome B can be divided into three zones (Fig. 3).
Zone 1
The 0–100 km leg from Vostok is characterized by increasing snow density and decreasing heavy isotope content while moving away from Vostok. The density gradually increases from 0.33 g cm−3 to ~0.35 g cm−3 70 km uphill (Fig. 3d). The internal firn structure reveals slightly undulating IRHs (Fig. 3f & g), which are reflected in similar waves in the SMB (Fig. 3e).
Zone 2
This zone is 100–230 km from Vostok. A prominent feature of this zone is a very low concentration of heavy water isotopes in snow with the δ18O values reaching -58.2‰ on average at a distance of 170 km, and with an absolute minimum of -60.0‰ observed at a single point 220 km from Vostok (Fig. 3b). The dxs values reveal the opposite behaviour, increasing from 16‰ near Vostok to > 18‰ 170 km away. The snow density starts to decrease again in this zone towards Dome B, probably in response to the decreasing katabatic wind speed as we approach the ice divide. The internal firn structure is characterized by dune-like features (Fig. 3f & g), indicating strong spatial variability of the SMB (Fig. 3e), attributed to large dunes at the glacier surface (Fig. 3a).
Zone 3
In the leg located 230–290 km from Vostok, the stable water isotope values remain low, although slightly higher than in the previous zone. The snow density gradually increases as one moves towards Dome B (Fig. 3d), as does the SMB (Fig. 3e). The IRHs in this zone are flat, suggesting a uniform spatial distribution of snow accumulation.
The Dome B site conditions are characterized by our traverse data as follows (Table I):
• The firn temperature measured at a depth of 20.5 is -58.1 ± 0.2°C.
• The mean SMB is 2.40 g cm−2 year−1 over the past 83 years and 2.28 g cm−2 year−1 over the past 213 years (1816–2019), as estimated from the depths of the brightest IRH (Fig. 3e) and of the Tambora peak in the RB20 core (Fig. 4a), respectively.
• The density of the surface snow is ~0.355 g cm−3 (i.e. significantly higher than at Vostok: 0.330 g cm−3).
• The content of heavy isotopes in the near-surface snow is -58.0‰ for oxygen-18. A very similar value is found in the upper section of firn, bounded from below by the Tambora layer (-57.55‰ in the RB20 core).
Discussion
The distribution of the snow properties between Vostok and Dome B reveals significant spatial variability. A relatively low surface snow density (0.33 g cm−3) typical for the area of Vostok (Ekaykin et al. Reference Ekaykin, Teben'kova, Lipenkov, Tchikhatchev, Veres and Richter2020) is associated with a low ice-sheet surface slope and thus low katabatic wind speed over the flat area of subglacial Lake Vostok (Vladimirova et al. Reference Vladimirova, Ekaykin, Lipenkov, Popov and Shibaev2015). A tendency of increased snow density values in Zone 1 (Fig. 3d) is then simply related to the steeper surface slope offshore of the lake. Further uphill the density starts to decrease again (Zone 2; Fig. 3d) as we approach the ice divide. In close vicinity to the dome (Zone 3), the snow properties can be related to ‘wind shadow’ effects (Frezzotti et al. Reference Frezzotti, Pourchet, Flora, Gandolfi, Gay and Urbini2004), but the underlying processes need further investigation.
The stable water isotope concentration in central Antarctica reveals strong latitudinal, altitudinal and continental effects (Masson-Delmotte et al. Reference Masson-Delmotte, Hou, Ekaykin, Jouzel, Aristarain and Bernardo2008). In our case we can exclude the latitudinal effect, as Vostok and Dome B are located at a roughly similar distance from the South Pole. The apparent altitudinal gradient is -0.13‰/100 m, which is significantly less than for the whole Antarctic continent (−0.7‰/100 m; Masson-Delmotte et al. Reference Masson-Delmotte, Hou, Ekaykin, Jouzel, Aristarain and Bernardo2008). We argue that in the high East Antarctic plateau the altitudinal effect is relatively weak. Indeed, the sites of old Dome B and Komsomolskaya have higher altitudes but heavier snow isotopic contents compared to Vostok (Vladimirova et al. Reference Vladimirova, Ekaykin, Lipenkov, Popov and Shibaev2015; see also Table I). In our traverse data, Zone 3 has less depleted isotopic values in snow compared to Zone 2, despite its higher elevation. Zone 2 is characterized by one of the lowest isotopic values of snow in Antarctica, with nearly the same isotopic content as that observed at Dome A at 4093 m a.s.l. (-58.48‰ for δ18O; Ma et al. Reference Ma, Li, Shi and Li2020). We suggest that the pattern of the snow isotopic content shown in Fig. 3b & c is mainly explained by the continental effect, and we conclude that the region crossed by the traverse is likely to be one of the most distant from a moisture source in Antarctica, which makes the isotope data obtained here especially useful for testing regional climatic models equipped with the isotopic module, such as MARiso (Agosta et al. Reference Agosta, Amory, Kittel, Orsi, Favier and Gallée2019).
The regional meteoric water line along the Vostok-Dome B traverse is δD = 7.1δ18O - 32.8. The δD/δ18O slope is lower than for the whole Antarctic continent (7.75; Masson-Delmotte et al. Reference Masson-Delmotte, Hou, Ekaykin, Jouzel, Aristarain and Bernardo2008), which is explained by the fact that the δD/δ18O function is not perfectly linear, and the slope decreases as soon as the isotopic values become more negative.
The apparent isotope/surface temperature slope between Vostok and Dome B is 0.3‰ °C−1, which is significantly less than the typical value of 0.8‰ °C−1 for the Antarctic continent (Masson-Delmotte et al. Reference Masson-Delmotte, Hou, Ekaykin, Jouzel, Aristarain and Bernardo2008). In order to explain this difference, one should consider the effective condensation temperature at Vostok and Dome B, which is beyond the scope of this study.
Finally, the surface temperature/elevation slope between Vostok and Dome B is -0.49°C/100 m, which is less than the -0.9°C/100 m typical for the entire Antarctic continent, but very close to the -0.5°C/100 m observed at the high East Antarctic plateau (Masson-Delmotte et al. Reference Masson-Delmotte, Hou, Ekaykin, Jouzel, Aristarain and Bernardo2008).
Our results demonstrate that the present-day SMB in the vicinity of Dome B (2.28 g cm−2 year−1) is only slightly (~10%) higher than at Vostok (2.06 ± 0.03 g cm−2 year−1; Ekaykin et al. Reference Ekaykin, Lipenkov, Kuzmina, Petit, Masson-Delmotte and Johnsen2004), which means that this area may be regarded as one of the driest in Antarctica. In general, the SMB data obtained along the traverse route and at Dome B corroborate earlier inferences made on the basis of very scarce observations that the regional accumulation pattern across the territory between subglacial Lake Vostok and Ridge B is characterized by a strong latitudinal gradient (accumulation increases when moving from the south to the north in that region), while in the west-east direction (e.g. along the VFL) the accumulation remains nearly constant (see fig. 1 in Ekaykin et al. Reference Ekaykin, Lipenkov and Shibaev2012).
The firn temperature at the depth below the layer of seasonal variability is -58.1 ± 0.2°C, which is ~1.5°C lower than at Vostok Station (Shibaev et al. Reference Shibaev, Tchikhatchev, Lipenkov, Ekaykin, Lefebvre, Arnaud and Petit2019).
Both the low SMB and the low surface temperature (which both rank among the lowest in Antarctica) are generally favourable for the preservation of very old ice in the bottom part of the ice sheet, and thus they do not contradict the hypothesis that Dome B is a promising place to search for the oldest ice.
The new data from the traverse are also important for refining the interpretation of the ice-core record obtained at Vostok (Petit et al. Reference Petit, Jouzel, Raynaud, Barkov, Barnola and Basile1999). Indeed, starting from the first publications devoted to the deep Vostok ice core (e.g. Jouzel et al. Reference Jouzel, Barkov, Barnola, Bender, Chappellaz and Genthon1993), the glaciological parameters at the old Dome B drilling base were used to describe the site conditions at the origin of the VFL. As the SMB at the old Dome B is ~65% higher than at Vostok (see review in Salamatin et al. Reference Salamatin, Tsyganova, Popov, Lipenkov and Hondoh2009), a significant increase of accumulation upstream of Vostok was assumed when modelling the ice flow between Ridge B and Vostok, which could have affected the glaciological chronology of the Vostok core (Parrenin et al. Reference Parrenin, Rémy, Ritz, Siegert and Jouzel2004). In addition, the present-day snow isotopic composition at the old Dome B (~-56‰ for oxygen-18) is significantly heavier than at Vostok (Jouzel et al. Reference Jouzel, Vaikmae, Petit, Martin, Duclos and Stievenard1995), while at the true Dome B it is, on the contrary, significantly lighter (Table I). Although the route of our traverse did not exactly follow the VFL (Fig. 1), the traverse data allow us to reliably assess the conditions along the VFL and thus may help us to improve the timescale and the climatic interpretation of the Vostok isotope temperature record.
Conclusion and outlook
We obtained the first glaciological, geophysical and geochemical data characterizing the environmental conditions in the vast, previously unexplored area of Ridge B lying west of Vostok Station. One of the most interesting findings of our study is the discovery of a region ~170 km from Vostok featuring a minimum concentration of heavy water isotopes in the snow. The very low δ18O values (accompanied by high dxs values) indicate that the air masses bringing precipitation to this region have travelled a very long way from the moisture source, so that the heavier isotopes have essentially been distilled out of the atmospheric water vapour.
This work is a first step towards a planned comprehensive study of the Ridge B area aimed at identifying potential drilling sites, which appear promising in terms of the recovery of undisturbed old Antarctic ice. The next step will be to use ice-penetrating radar to study the ice thickness, the internal structure of the ice sheet, the bedrock topography and the basal conditions along the VFL as well as (and in more detail) around Dome B. Combined with the radar studies, a 300 m-deep pilot borehole will be drilled in the vicinity of Dome B. The ice core will be used to characterize the Holocene climate variability in this region and to provide age control for the upper isochrone layers traced between Vostok and Dome B. If the geophysical and glaciological observations combined with ice-flow modelling confirm a high probability of finding undisturbed old ice in the vicinity of Dome B, we intend to start new deep-ice drilling to the bedrock there.
Acknowledgements
We thank the Russian Antarctic Expedition headed by Dr Alexander Klepikov for the logistic support of our traverse to Dome B. We are grateful to the leader of the Vostok logistic convoy, Sergey Zykov, for his enormous efforts that made our traverse possible. We have been happy to work with the drivers Artem Elagin, Gennady Deshevyh, Mikhail Uzdemirov and Alexey Purtov, who helped us with enthusiasm. We thank two anonymous reviewers for valuable comments and Alice Lagnado for improving the English.
Author contributions
AE: fieldwork, isotopic measurements and interpretation, manuscript preparation; AB: fieldwork; VL: manuscript preparation; MS: GNSS data treatment, manuscript preparation; LE: GNSS data treatment, manuscript preparation; EB: GNSS data treatment; SP: GPR data treatment, manuscript preparation; AT: fieldwork.
Financial support
This research was conducted with the financial support of the Russian Science Foundation, grant 18-17-00110. The GPR measurements were carried out with the support of RFBR grant 17-55-12003 NNIO. The GNSS measurements were carried out with support from the DFG (German Research Foundation) project SCHE 1426/20-1, which was granted as part of the DFG priority programme 1158 ‘Antarctic Research’.
Details of data deposit
The data presented in the manuscript can be downloaded here: http://cerl-aari.ru/index.php/ridge-b/.


