Introduction
Subglacial Antarctic lakes were first suggested, rather by accident, during an experiment to determine ice surface landmarks to aid flight orientation through the similarity between “oval depressions with gentle shores” and ice-covered lakes (Robinson Reference Robinson1960). Direct identification of subglacial lakes came as a result of Antarctic airborne radio-echo sounding (RES) mapping that took place between 1968 and 1979 (Robin et al. 1970, Oswald & Robin 1973, McIntyre Reference McIntyre1983). Other expeditions followed, and the first comprehensive inventory of Antarctic subglacial lakes catalogued 77 lakes according to the date they were discovered, geographical position and ice thickness (Siegert et al. Reference Siegert, Dowdeswell, Gorman and McIntyre1996). Ten years later an updated inventory was released in which 145 subglacial lakes were classified formally (Siegert et al. Reference Siegert, Carter, Tabacco, Popov and Blankenship2005). Planning for the exploration of subglacial lakes began soon after it was hypothesized that microbial living organisms may survive in such extreme environments and that analysis of the geological sediments located at the bottom of Antarctic subglacial lakes may help explain the patterns of previous climate change processes (Ellis-Evans & Wynn-Williams Reference Ellis-Evans and Wynn-Williams1996).
This paper proposes a structured approach to estimating, and then managing, the risk of blowout when accessing subglacial Antarctic lakes that may contain gas or clathrates under pressure. Clathrate is a solid air-hydrate crystal created due to the compression of bubbles trapped in the meteoric ice during the compaction of snow into the ice. Clathrates are formed at depths > 1 km, in which the pressure is high enough for ice and air to combine in this crystal structure. Where melting occurs at the lake roof, clathrates dissolve into the lake water but if dissolved gas concentrations reach saturation, clathrates will accumulate in the lake.
Antarctic subglacial lakes exist in different glaciological conditions. For instance, they may exist in what is termed a hydrological closed or open system. Their glaciological conditions are directly linked to the possibility of blowout during access (McKay et al. Reference McKay, Hand, Doran, Andersen and Priscu2003). However, this link is not established deterministically because there is a huge amount of uncertainty concerning key characteristics of these lakes. In a closed hydrological situation, where the lake water is formed by melting ice and is lost by accretion, dissolved gas concentrations can increase. If conditions persist for many millennia the dissolved gas concentration may reach saturation, at which time gas clathrates will begin to accumulate. In open conditions the risk of blowout may arise from the hydrological conditions in the lake, for instance if the hydrological head is above the access point. In these conditions, a blowout can pose a severe hazard to the drilling and sampling operations. Regardless of the likelihood, the potential for a blowout needs assessment and, if required, management and mitigation, as the safety consequences are potentially serious. This issue has been recognized by the Scientific Committee on Antarctic Research, whose code of conduct for the exploration and research of subglacial aquatic environments states that, “Water pressures and partial pressures of gases in lakes should be estimated prior to drilling in order to avoid down-flow contamination or destabilization of gas hydrates respectively. Preparatory steps should also be taken for potential blowout situations” (SCAR 2010, p. 5).
Estimating risk in a complex, never before accessed, environment has to be based on expert judgments. However, when using expert judgments for risk assessment, it is crucial to use quantitative rather than qualitative methods. Research has shown that different people have different interpretations of the probability associated with verbal descriptions. Renooij & Witteman (Reference Renooij and Witteman1999) considered that an ‘improbable’ event has an associated probability of occurrence of 0.15, whereas Ang & Buttery (Reference Ang and Buttery1997) associated the verbal descriptor ‘probable’ to a probability of 0.1. In both cases verbal descriptors are considered estimates of frequency. However, since such terms are relative rather than absolute, they have different interpretations according to the context. This inconsistency adds uncertainty to the risk assessment process. In contrast, using a numerical risk assessment presents a robust way to estimate event likelihood.
If we were to ask an expert to estimate the risk of blowout given the setting, the expert would probably use heuristics to come up with a qualitative description of the probability. Whilst an expert may be very good in estimating likelihoods, one cannot expect an expert to maintain coherence when there is a large number of variables to consider and particularly if some of them are dependent. It is therefore important to decompose the elicitation of judgments into tasks that are as small and distinct as possible and then combine the assessments using logical probability functions.
In this paper we first model the problem of estimating the probability of blowout in a fault tree that encapsulates all variables (hypotheses) that may affect the likelihood of a blowout. Second, we show how elicited expert judgments for each hypothesis from a group of experts captures likelihood and uncertainty. We present details about this method and discuss the results, the implications for safety of the ice-camp team, and the consequential mitigation measures that should be taken to control the risk to an acceptable level.
The aim of the Ellsworth expedition is to deploy a science probe to study Ellsworth Subglacial Lake (Mowlem et al. 2011). The Ellsworth consortium has planned an extensive logistics and equipment development programme that will deliver the necessary resources to the location of the lake (Siegert et al. Reference Siegert, Behar, Bentley, Blake, Bowden, Christoffersen, Cockell, Corr, Cullen, Edwards, Ellery, Ellis-Evans, Griffiths, Hindmarsh, Hodgson, King, Lamb, Lane, Makinson, Mowlem, Parnell, Pearce, Priscu, Rivera, Sephton, Sims, Smith, Tranter, Wadham, Wilson and Woodward2007). A novel hot water drill technology will be used to give lake access through c. 3.2 km of ice (Makinson Reference Makinson1993). While the motivating example for this paper is Ellsworth Subglacial Lake the framework presented can be applied to manage the risk of accessing any other subglacial lake.
Blowout risk model
In this section, we structure the problem of blowout likelihood calculation in a fault tree (Fig. 1). Fault tree analysis is a well-established methodology for estimating the reliability of complex systems (e.g. Volkanovski et al. Reference Volkanovski, Cepin and Mavko2009). Blowout is caused when the pressure inside the borehole is lower than the pressure in the lake. Our expert panel agreed that blowout can be manifested in four ways: 1) hot-water drilling, 2) hydrostatic pressure, 3) accumulation of dissolved gases, or 4) accumulation of clathrate (Ikeda et al. Reference Ikeda, Fukazawa, Mae, Pepin, Duval, Champagnon, Lipenkov and Hondoh1999). Other factors that might increase or reduce the likelihood of blowout are whether the lake is part of an open hydrological system, or whether it is closed, and if closed, for how long has it been closed. The fault tree uses logical gates to represent probability functions. Triangles in the fault tree are used for representing variables of the problem domain - these are also denoted as base events. Depending on the probabilistic model, base events are combined using logical ‘and’ or ‘or’ gates. These mathematical operations may result in intermediate variables, graphically represented by squared boxes. These may in turn be combined to estimate the probability of the end event: the blowout.

Fig. 1 Fault tree for measuring the risk of a blowout. The base events are captured in the triangles, ‘and’ and ‘or’ gates are explicitly defined, the square with the capture of ‘blowout’ is the end event.
Three periods were considered for closed hydrological systems: 400 kyr, 100 kyr, and 8 kyr, capturing three potential times for the creation of the lake. Eight thousand years is approximately the ‘end’ of the last glacial cycle, and 100 kyr is approximately the ‘start’ of the last glacial cycle. Finally 400 kyr was chosen to represent Marine Isotope Stage 11, the warmest interglacial in the last 500 kyr. It is seen as the best analogue for the current interglacial (the Holocene), and is thought to be the best candidate for the last time the West Antarctic ice sheet collapsed, and hence Ellsworth Subglacial Lake was last de-glaciated.
The quantity of clathrate gases depends on freeze/melt rates in the lake. Woodward et al. (Reference Woodward, Smith, Ross, Thoma, Corr, King, King, Grosfeld, Tranter and Siegert2010) showed that under closed conditions the average freeze/melt rates are 4 cm yr-1, with a maximum value of 15 cm yr-1. The risk assessment considers these two freeze/melt rates. The detailed calculations for the amount of clathrates and gases for these two freeze/melt rates are presented in the comprehensive environmental evaluation report (CEE 2011).
‘And’ gates were used to combine logically the closure times and the freezing rates with a final ‘or’ gate representing the additive function in probability theory.
Expert judgment elicitation process
When using expert judgments for risk assessment it is crucial to follow a formal elicitation process that is transparent, capable of replication and coherent (Otway & Winterfeldt Reference Otway and Winterfeldt1992). Nevertheless the process is not flawless, experts may still introduce bias in their judgments. Different types of biases have been identified by many psychologists and statisticians, reviewed by Kynn (Reference Kynn2008), who listed recommendations to follow during the elicitation. Biases can be reduced if experts are trained and if the wording in the question does not present ambiguity.
In this work, expert judgments were elicited using the Sheffield Elicitation Framework (SHELF) O'Hagan et al. (Reference O'Hagan, Buck, Daneshkhah, Eiser, Garthwaite, Jenkinson, Oakley and Rakow2006). However, we followed a mathematical aggregation method rather than behavioural. Experts were kept apart during the elicitation process, and their judgments were aggregated using a linear opinion pool. The data analysis was performed in the statistical software package, R version 2.12.0 (http://www.r-project.org/). Below we summarize the structured elicitation process.
Selecting the experts
An expert is clearly someone with great technical and subject matter knowledge. O'Hagan et al. (Reference O'Hagan, Buck, Daneshkhah, Eiser, Garthwaite, Jenkinson, Oakley and Rakow2006, p. 27) provided more detailed characteristics: able to approach a problem via formal principles, e.g. through causal reasoning; uses established strategies such as questioning/reviewing first assessments; and relies more on procedural knowledge, on relationships and an appreciation of what is important, and less on declarative knowledge, facts and simple rules. Our five experts (considered a sufficient number by O'Hagan et al. (Reference O'Hagan, Buck, Daneshkhah, Eiser, Garthwaite, Jenkinson, Oakley and Rakow2006)) were chosen with these characteristics in mind:
• Martyn Tranter (MT - hydrochemistry, including gas and clathrate solubility in water and biogeochemical processes in the cryosphere and subice sheet hydrology, 15 years experience),
• Neil Ross (NR - glacial geophysics, 10 years experience),
• David Blake (DB - engineering for glaciology applications, 20 years experience),
• Keith Makinson (KM - engineering/drilling for glaciology applications, 23 years experience),
• Martin Siegert (MS - glacial geophysics, 20 years experience).
Background information
Experts received a document with background information concerning the purpose of the elicitation and a summary of the scientific evidence gathered to support the risk assessment. This included a numerical calculation of the amount of clathrate in the water for different scenarios: 1) system closed for 8 kyr, 100 kyr and 400 kyr, 2) a 3D representation of the hydrological potential of the Lake Ellsworth catchment, 3) 2D hydrological and ice profiles, 4) a map of bed-reflection power, over, and downstream of, Lake Ellsworth basal water, depicting the expected water flow in the lake, and 5) a list of scientific arguments supporting each blowout scenario (Woodward et al. Reference Woodward, Smith, Ross, Thoma, Corr, King, King, Grosfeld, Tranter and Siegert2010, CEE 2011). Experts received details concerning the logistics and fieldwork, including details of the hot-water drilling system (Makinson Reference Makinson1993, Siegert et al. Reference Siegert, Behar, Bentley, Blake, Bowden, Christoffersen, Cockell, Corr, Cullen, Edwards, Ellery, Ellis-Evans, Griffiths, Hindmarsh, Hodgson, King, Lamb, Lane, Makinson, Mowlem, Parnell, Pearce, Priscu, Rivera, Sephton, Sims, Smith, Tranter, Wadham, Wilson and Woodward2007, p. 172), and of the probable head of water removed from the hole prior to breakthrough (to reduce the possibility of contamination). Although this was not formally discussed, the experts were also aware of the properties of the meteoric ice overlying Lake Vostok and of its sedimentary profile (Lipenkov & Istomin Reference Lipenkov and Istomin2001, Filina et al. Reference Filina, Blankenship, Thoma, Lukin, Masolov and Sen2008).
Training experts on probability assessment
This is, arguably, the most important phase of the elicitation process to overcome doubt over assigning probabilities to events. Training consisted in giving examples of probability assessments, explaining the difference between different schools of thought in probability theory: frequentist, classical, and subjectivist. Expert judgment is based on the subjective school of probability, where the expert prior belief about the veracity of a given hypothesis is updated in light of new evidence (discussed in the previous section). The knowledge about classical and frequentist schools is useful as it provides means for experts if their assessments are consistent and realistic. Properties of a probability distribution, lower bound, lower quartile, median, upper bound, and upper quartile were also described in detail.
Eliciting expert judgments
The experts provided their judgments using a pro forma spreadsheet. As the aim was to elicit a probability distribution they provided estimates of the lower quartile, median and upper quartile for each of the base events in Fig. 1. Adding free text supporting each judgment was encouraged. The mathematical model encapsulated by the fault tree used the estimates given for each variable to calculate the probability of blowout during lake access. To ease data interpretation a beta distribution was fitted to the probability parameters assigned by the experts.
Analysis and aggregation of expert judgments
Of the five experts, four assigned judgments to all base events, and one (KM) assigned probability judgments for the risk mitigation strategies only, which are discussed in the ‘Blowout risk mitigation mechanisms’ section. In this section, we summarize the elicited judgments, highlighting major disagreements and how they affect the aggregated judgment.
Probability of blowout caused by water pressure
In their comprehensive review Bentley & Koci (Reference Bentley and Koci2007) described a few instances where water surged up the borehole due to water pressure only. This can happen if the hydrological head of the lake or hydrological system is above the ice surface. For Ellsworth Subglacial Lake, the digital elevation model has shown that this is not the case for the planned drilling site (Vaughan et al. Reference Vaughan, Rivera, Woodward, Corr, Wendt and Zamora2007). Consequently all experts assigned very low probability for blowout due to water pressure. Two experts considered this scenario to be physically impossible, assigning 0 to all elements of the probability distribution. The aggregated distribution is presented as a continuous line in Fig. 2a. The median for this distribution is 0.0000658. NR commented, “The ice thickness and basal topography is well constrained by the geophysical survey data. Hydrological head is therefore clearly defined and is well below the ice sheet surface (c. 270 m), allowing for a zero to low probability of blowout”.
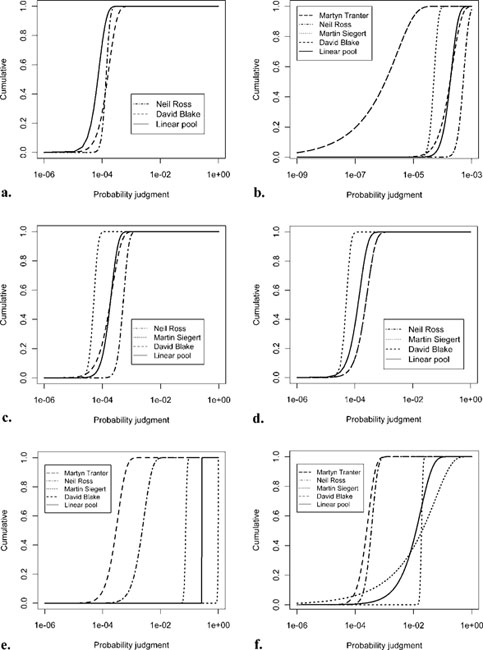
Fig. 2 Expert judgments for the 14 base events, blowout caused by a. water pressure, b. hot water drilling, c. clathrate gases - open system, d. gasses in lake water - open system, e. clathrate 400 kyr & 15 cm yr-1- closed system, f. clathrate 100 kyr & 15 cm yr-1 - closed system, g. clathrate 8 kyr & 15 cm yr-1 - closed system, h. clathrate 400 kyr & 4 cm yr-1 - closed system, i. clathrate 100 kyr & 4 cm yr-1 - closed system, and j. clathrate 8 kyr & 4 cm yr-1 - closed system. Probability system has been closed for k. 400 kyr, l. 100 kyr, and m. 8 kyr. n. Probability that the system is open. One or more experts assigned 0 to all probabilities, and hence a curve is not shown in all cases.

Fig 2 continued
Probability of blowout caused by hot water drilling
The probability of blowout due to hot water drilling was deemed very low. However, all experts assigned non-zero probability distributions for this scenario. MT, the most optimistic, assigned a median of 10-7. According to NR, “Degassing of released gas will occur during drilling in the borehole and in surface water storage tanks. Therefore gas saturation should not be reached. No problems have been reported from previous ice drilling experiments”. This view was shared by the other experts. The linear aggregate in Fig. 2b is a good representation of the panel view, with a median of 0.0001736.
Probability of open system blowout from clathrate
The most pessimistic expert (NR) considered the upper bound to be 0.001. All experts assigned narrow distributions, shown by the steep shape of the cumulative distributions (Fig. 2c), indicating confidence about their assessment. NR's judgment was that degassing of released gas would occur during drilling and in surface water storage tanks, therefore gas saturation would never be reached. MS considered that open system would not allow for clathrate build-up and hence a low probability should be assigned. MT took this argument further and assigned 0 to all elements. The aggregated median probability was 0.0001875.
Open system blowout from gases in lake water
The aggregated probability of blowout for this scenario was very similar to the one obtained for the blowout due to clathrate in an open hydrological system, with the same upper limit. MT judged that this scenario was physically impossible. NR argued that, “If the system is open then gas content of the lake will equal the gas content of the overlying ice. Any lake water that mixed with drilling fluid will be under-saturated and vent at the surface”. The aggregated distribution (Fig. 2d) is a good representation of the panel view, with a median of 0.000113.
Assuming system closed for 400 kyr, 15 cm yr-1 melt rate, blowout from clathrate
This was considered the most critical scenario, and showed most disagreement between experts. MT considered that there would be sufficient clathrate present for the probability of blowout to be 1. NR commented, “If system has been closed for this period with this rate of ice melt, clathrate build-up in the lake highly likely”. In contrast, DB considered that the amount of clathrate would be very low. MS and NR provided intermediate probabilities. The linear aggregated distribution is pessimistic (Fig. 2e) with a median of 0.27 and an upper limit of 0.28, but, because of the certainty of MT, it does not capture the full range of opinions.
Assuming system closed for 100 kyr, 15 cm yr-1 melt rate, blowout from clathrate
As expected, all experts reduced considerably their probability judgments from the 400 kyr case. MT considered that there would be some clathrate in the lake, assigning a median of 0.01, but with significant uncertainty, with a lower limit of 0.001 and an upper limit of 0.2. This uncertainty is also reflected in the linearly aggregated pool (Fig. 2f) where the median is 0.00732.
Assuming system closed for 8 kyr, 15 cm yr-1 melt rate, blowout from clathrate
All experts consistently assigned lower probability distributions than for closure periods of 100 kyr and 400 kyr. All experts considered that 8 kyr is not sufficient time for clathrate build-up.
MT and DB assigned the same upper limit, while MT again displayed a large uncertainty with a lower quartile two orders of magnitude smaller than the median. The linear aggregated distribution (Fig. 2g) is not unduly biased, with a median of 0.0000933.
Assuming system closed for 400 kyr, 4 cm yr-1 melt rate, blowout from clathrate
The linearly aggregated assessment for this scenario (Fig. 2h) presents a lower probability of blowout than the aggregated assessment provided for 400 kyr with a melt rate of 15 cm yr-1. MT is the most pessimistic, with an upper limit of 0.2, DB is also pessimistic. We have two schools of thought, where the median between these two schools differs by two orders of magnitude. Whilst a two orders of magnitude difference in expert judgments is not ideal, it is not unusual with expert judgments (Otway & Winterfeldt Reference Otway and Winterfeldt1992). The linear aggregate pool for this assessment provides a fair representation, with a median of 0.00742.
Assuming system closed for 100 kyr, 4 cm yr-1 melt rate, blowout from clathrate
MT presents the largest uncertainty, with a lower limit of 0.00025 and upper limit of 0.05. Other experts were more confident about their distributions (steeper slopes in Fig. 2i). The linear opinion pool presents a good representation of the panel view, reflecting MT's uncertainty, with a median of 0.000716.
Assuming system closed for 8 kyr, 4 cm yr-1 melt rate, blowout from clathrate
According to this group of experts, this scenario presents the lowest probability of blowout from clathrate. The general argument is that there is not enough time for clathrate build-up, but if present, it would dissolve in the drill fluids. MS was sufficiently confident to assign 0 to all elements of his probability distribution. The median for the linearly aggregated pool (Fig. 2j) is 0.0000567.
Probability system has been closed for 400 kyr
Experts based their assessments partly on the changes in ice sheet thickness that have occurred during the last 400 kyr. The probability of the lake being closed for 400 kyr was considered very low, but all experts assigned non-zero distributions. The lowest probability distribution was by MT, with a lower limit of 0 and upper limit of 0.00001. The linearly aggregated pool (Fig. 2k) has a median of 0.0000711.
Probability system had been closed for 100 kyr
This scenario was considered more probable than the 400 kyr scenario, with a median of 0.00014 (Fig. 2l).
Probability system had been closed for 8 kyr
All experts agree that being closed for 8 kyr is more probable than being closed for 100 kyr or 400 kyr. NR was of the opinion, “If the lake is closed at present then it is quite possible that this has also been the case for the last 8 kyr”, and he assigned the highest probability to this scenario, almost two orders of magnitude higher than the other three experts. The aggregated judgment (Fig. 2m) has a median of 0.00348, one order of magnitude lower than the judgment provided by NR.
Probability the system is hydrologically open
According to this panel of experts the probability that the lake may be in a hydrologically open system is very high. Two experts had an upper limit of 1 and one expert assigned an upper limit of 0.67. However, DB considered this scenario unlikely, his probability distribution has an upper limit of 0.002. The distributions for all experts, apart from MS, have a high variability (Fig. 2n). The linear aggregated distribution has a median of 0.654.
Ellsworth blowout risk
As depicted in the fault tree (Fig. 1) the risk of blowout can be a result of six intermediate scenarios (labelled a to f) based on the base events whose probability distributions were elicited from experts as described above. The probability distribution for each of these intermediate scenarios and the resulting probability of blowout are given in Fig. 3.

Fig. 3 Cumulative probability of blowout during access to Ellsworth Subglacial Lake (black full line). Individual scenarios contributing to the overall probability are shown as dashed/dotted lines. a. Probability of blowout caused by water pressure. b. Probability of gas blowout caused by hot water drilling. c. Probability of open system blowout from clathrate gases. d. Probability of open system blowout from gases in lake water, considering an open system. e. Probability of blowout from clathrate gases assuming 15 cm yr-1 ice melting/refreezing rate. f. Probability of blowout from clathrate gases assuming 4 cm yr-1 ice melting/refreezing rate.
The probability of blowout has a median of 0.000457, a lower bound of 0.0000653 and an upper bound of 0.00184. These values may, at first, seem very small. Based on the median, there is a one in 2188 chance that a blowout will take place, based on the upper bound, there is a one in 545 chance. The 95% quantile of the probability of blowout due to these six scenarios is presented in Table I.
Table I Ranked blowout scenarios according to the 95% quantile.

From the project management and engineering viewpoint the probability of blowout is an acceptable risk. As a possible setback to the project it is much lower than the risk of the instrumented probe and its support systems not working, where the 95% quantile is 0.13 (Brito et al. Reference Brito, Griffiths, Mowlem, Waugh, Saw, Wyatt, Tsaloglou, Fowler, Campbell and Rundle2011). However, blowout should not be dismissed as meaning an insignificant risk. This is because of other possible consequences of a blowout, specifically, the death of one or more of the scientific team, or the complete failure of the expedition.
Blowout risk mitigation mechanisms
Here we consider the following mitigation measures: filling the hole with water on first signs of a blowout, use of a blowout preventer, and procedures that remove persons from the vicinity of the hole prior to breakthrough, as set out in the Appendix. While it is standard practice to use blowout preventers in the offshore industry (e.g. Signoret & Leroy Reference Signoret and Leroy1985, Holand & Rausand Reference Holand and Rausand1987) the logistics of transporting a blowout preventer to Antarctica can put serious constraints on a fixed budget science expedition. Furthermore, its effectiveness may be compromised when placed on a porous ice surface (Siegert et al. Reference Siegert, Clarke, Mowlem, Ross, Hill, Tait, Hodgson, Parnell, Tranter, Pearce, Bentley, Cockell, Tsaloglou, Smith, Woodward, Brito and Waugh2011). Nevertheless it is important to be able to quantify whether using a blowout preventer would reduce the blowout likelihood.
We asked experts to assess the effectiveness of four risk mitigation strategies:
1) What is the probability that the blowout would be prevented if the headspace were filled with water once the start of blowout has been detected?
2) What is the probability that the blowout would be prevented if the borehole was sealed and pressurized to 0.5 MPa compressing the predicted 1080 m into c. 220 m (i.e. within the headspace) (Siegert et al. Reference Siegert, Clarke, Mowlem, Ross, Hill, Tait, Hodgson, Parnell, Tranter, Pearce, Bentley, Cockell, Tsaloglou, Smith, Woodward, Brito and Waugh2011)?
3) What is the probability that the blowout would be prevented if the borehole was sealed and pressurized to 31 MPa, the maximum pressure in the lake?
4) What is the probability of a death given a blowout occurs given that a declared set of procedures are followed to move personnel from the borehole area prior to entry into the lake?
There are a number of patented designs for blowout preventers at well heads that could be used or adapted for Ellsworth Subglacial Lake. The calculation presented in the CEE report show that the worst blowout scenario would result in c. 400 T thrust force at the surface for each hole. This could be counteracted by loading compacted snow onto an inverted top hat or plate. Based on their calculation the Ellsworth team concluded that a plate of 5.2 m in radius would be required, this would have to be buried 7 m deep (per hole).
Two features would be useful: 1) the ability to shut off the wellhead and seal against the blowout pressure, and 2) the ability to inject water beneath the seal to affect a top kill. Both can be found in the patents. The pressure sensor placed at the return pump would give warning of impending blowout. The use of the seal and injecting water would halt the runaway and should result in only modest pressures being present at the preventer.
The particular problems for Ellsworth Subglacial Lake are: 1) dealing with the drill hose which is not rated to the max blowout pressure. It would either have to be cut below the seal, or crushed/capped by the blowout preventer, and 2) dealing with the porosity in the fern ice. The porosity of the hole can deteriorate the effectiveness of the preventer. However, if left porous blowout prevention via top kill is still possible, but would require the injection of more water. In their assessments experts considered that these limitations would have been addressed by the design team prior to the deployment.
For each question above, the experts assigned a probability of mitigating the risk of blowout (pm). The probability of mitigation is 1 if the strategy completely mitigates the blowout risk, and pm is 0 if the strategy does not mitigate the blowout risk at all. The updated probability of blowout is calculated using the following expression:
 $${{p}_{bm}}\,{\rm{ = }}\,{{p}_b}{\rm{(1 - }}{{p}_m}{\rm{)}}{\rm{.}}\eqno\rm$$
Experts were asked to estimate the effectiveness of each of the first three mitigation strategies to mitigate a fast and slow blowout. The aggregated linear un-weighted pool are presented in Table II. The distribution for the probability of blowout for each mitigation strategy is presented in Fig. 4.
Table II Parameters of the distribution of the blowout risk mitigation for two blowout scenarios: slow and fast.


Fig. 4 Probability of blowout during access to Ellsworth Subglacial Lake considering four mitigation strategies: adding water to the borehole (dotted line), blowout preventer to 0.5 MPa (dashed line), blowout preventer to 31 MPa (solid line), procedures to move people from harm. a. Slow blowout. b. Fast blowout.
The results show that a 31 MPa blowout preventer would be very effective in reducing the risk of blowout. The effect of the other two technical options, adding water to the borehole or adding a 0.5 MPa blowout preventer would be nearly negligible.
Experts were asked to assess the effectiveness of the evacuation procedure in mitigating the possibility of death to all ten possible blowout scenarios, assigning 1 if it completely mitigates the possibility of death and 0 if it does not mitigate at all. Assessments and the aggregated linear un-weighted pool are presented in Table III. The cumulative distributions for the risk of death for each scenario is presented in Fig. 5.
Table III Expert assessments of the probability of the evacuation procedure completely mitigating the possibility of death.


Fig. 5 Cumulative probability of death following evacuation during blowout (black full line). Individual scenarios contributing to the overall probability are shown as dashed/dotted lines. Probability of death following evacuation when blowout is caused by a. water pressure, b. hot water drilling, c. clathrate gases, d. gases in lake water, considering an open system, e. clathrate gases assuming 15 cm yr-1 ice melting/refreezing rate, f. clathrate gases assuming 4 cm yr-1 ice melting/refreezing rate.
Estimating risk of death due to blowout
Taking the case of risk to life, and considering the extreme case of a blowout leading to the certain death of one or more people, this would imply that there is a 1 in 2188 chance that one or more team members may die in this expedition. Is this an acceptable risk? This is a controversial area dealt with at length in Health and Safety Executive (HSE), UK, documents (HSE 1992, HSE 2001). The tolerable risk (TR) for employee death is per annum 10-4. The 95 percentile of the actual risk (AR) from the analysis above is 1.23 × 10⁻³, which is higher than the tolerable risk (that has to cover all aspects that may lead to death). The risk owner must therefore ensure that the operational risk is reduced to acceptable values. In the case we are considering, the required risk mitigation (RM) must be RM = TR/AR = 10-4/1.23 x 10-3 = 0.081. That is, the probability of a death given a blowout must be no greater than 0.081. In the next section we consider different risk mitigation strategies and quantify their effectiveness.
The total probability of death due to blowout given that the mitigation plan is put in place is:
 $$no{{{p}_{death|blowout}}\, = \,\mathop{\sum}\limits_{i\, = \,1}^N {{{p}_{{{b}_i}}}\left( {1{\rm{ - }}{{p}_i}(death|evacuation)} \right)} \cr\quad{\rm{ - }}(N{\rm{ - }}1)\prod\limits_{i\, = \,1}^N {{{p}_{{{b}_i}}}\left( {1{\rm{ - }}{{p}_i}(death|evacuation)} \right)} $$
where N is the number of blowout scenarios. We used Eq. (1) to calculate the lower bound, lower quartile, median, upper quartile and upper bound. Then we used a routine in the statistical package R to fit a beta distribution (Table IV).
Table IV Fitted quantiles for the probability of death given blowout given that the evacuation plan outlined in the Appendix is implemented.

The 95% quantile for the probability of death, due to blowout, following the described structured evacuation is 8.96 × 10⁻⁵. This is below the tolerable risk level.
Discussion
Drilling through to a subglacial lake entails some degree of risk of blowout. Estimating that risk is an important part of planning for accessing the lake. Knowledge of the hydrological and glaciological conditions is key to reaching an objective assessment of the risk. The combination of conditions may well be unique to every subglacial lake, and consequently there cannot be a single estimate for the risk of blowout. However, the structured approach proposed here, combining fault tree analysis and the formal elicitation of expert judgment, can be applied to any subglacial lake access project.
The final estimate of the risk of blowout is not the only valuable output from such an assessment. Intermediate stages capture probabilities of interest, such as the likelihood that the hydrological system is open or closed, and the likelihood of clathrate being present. The assessment also highlights the degree of uncertainty, and the degree of consensus, over these probabilities among a group of experts given the same set of evidence. In this exercise for Ellsworth Subglacial Lake we have examples of some experts showing a narrow distribution, suggesting a high degree of certainty over the likelihood, with another expert taking a different view, with a broad probability distribution indicative of uncertainty, and with a very different median, indicating lack of consensus. Elicitations can provide a mechanism for raising these differences of opinion, for discussing the facts underpinning the judgments and the different interpretations, and for reaching consensus.
This form of structured risk assessment can also be used to capture and record tensions between conflicting requirements. For example, reducing the head of water in the hole prior to breakthrough is planned, to reduce the likelihood of the borehole water entering the lake. However, doing so increases slightly the risk of blowout. Adding water to the hole on first signs of a blowout, a possible mitigation measure, may then increase the likelihood of borehole water entering the lake, for example if there is a false alarm from the blowout detector. The need to avoid contamination of the lake means that a standard offshore industry technique of adding heavy mud with the mineral barite would not be an acceptable mitigation plan. The mitigation plans presented in this paper are the solutions considered by the design team. These should not be viewed as the only solutions to blowout mitigation. For example, one reviewer suggested a diversion system, similar to those used by offshore drillers, as a potential solution. In this case the blowout water would be diverted laterally away from people and from the drilling site.
Methodologically, there are clear benefits from decomposing a problem into smaller modules. Instead of asking experts to provide a single probability judgment for the risk of blowout, experts estimated the probability of blowout for specific scenarios. These scenarios are more generic, rather than being specific to Ellsworth Subglacial Lake.
Acknowledgements
The authors are grateful to the five experts that took part in this exercise and to the Ellsworth consortium for their encouragement. This work was supported by the UK Natural Environment Research Council's Oceans 2025 programme and by grant NERC/001/0345012. K. Makinson was added as an author after peer review, to augment the paper in the areas of drilling, clathrate, and blowout prevention in response to questions raised by reviewers. This has not compromised his independence as an expert providing judgments. The constructive comments of the reviewers are also gratefully acknowledged.
Evacuation procedure
The evacuation procedure will take the form of:
1) We will drill down to within 30 m of the lake surface.
2) At this point, all personnel (with the exception of the two drilling engineers) will move to a safe distance - c. 100 m away from the wellhead and not directly downwind.
3) The drilling engineers will then continue the drilling operation from within the weather haven preparation annex. The drilling water temperature will be lowered at this point and this last section of drilling should take c. 1 hour.
4) Once the lake has been reached, the drilling engineers will monitor the instrumentation to ascertain if any reaction has occurred. Once they are satisfied that no reaction has occurred, normal personnel movements can resume.