Introduction
In the McMurdo Dry Valleys (MDV) of Antarctica (~77–78°S, ~160–164°E), the presence of liquid water is considered to be a primary limiting resource in biological and geochemical processes (Campbell & Claridge Reference Campbell and Claridge1987, Kennedy Reference Kennedy1993, McKnight et al. Reference McKnight, Niyogi, Alger, Bomblies, Conovitz and Tate1999, Dickinson & Rosen Reference Dickinson and Rosen2003). Most MDV soils are exceptionally dry in the upper 3 cm, typically < 0.5 wt.% (Campbell et al. Reference Campbell, Claridge, Balks, Campbell, Lyons, Howard-Williams and Hawes1997), outside of hydrologically mediated groundwater-enriched regions such as stream and lake hyporheic zones (McKnight et al. Reference McKnight, Niyogi, Alger, Bomblies, Conovitz and Tate1999, Gooseff et al. Reference Gooseff, Wlostowski, McKnight and Jaros2016), water tracks and seeps (Lyons et al. Reference Lyons, Welch, Carey, Doran, Wall and Virginia2005, Levy et al. Reference Levy, Fountain, Gooseff, Welch and Lyons2011, Dickson et al. Reference Dickson, Head, Levy and Marchant2013, Gooseff et al. Reference Gooseff, Barrett and Levy2013), isolated efflorescent salt ‘wet patches’ (Levy et al. Reference Levy, Fountain, Welch and Lyons2012, Gough et al. Reference Gough, Wong, Dickson, Levy, Head, Marchant and Tolbert2017, Bisson et al. Reference Bisson, Welch, Welch, Sheets, Lyons, Levy and Fountain2018) and persistent snow bank margins where infiltration can occur (Gooseff et al. Reference Gooseff, McKnight, Runkel and Vaughn2003, Fountain et al. Reference Fountain, Nylen, Monaghan, Basagic and Bromwich2009).
As a consequence of this extreme soil aridity, coupled with low organic matter content (Burkins et al. Reference Burkins, Virginia, Chamberlain and Wall2000) and abundant felsic fines (Bockheim Reference Bockheim2010), MDV soils are commonly quite bright. Visible-wavelength-range soil reflectance is typically ~0.15–0.25 (Levy et al. Reference Levy, Nolin, Fountain and Head2014), but varies as a function of soil type and dominant lithology (Campbell & Claridge Reference Campbell and Claridge1987). Wetted MDV soils darken abruptly as a function of soil moisture, with reflectance decreasing by 50–60% as soil moisture rises from 0 to 5 wt.% (Levy et al. Reference Levy, Nolin, Fountain and Head2014). This produces characteristic spatial albedo patterns in MDV soils that are governed largely by landscape position and hydrological conditions (Lyons et al. Reference Lyons, Fountain, Doran, Priscu, Neumann and Welch2000): locations of channelized or ponded soil moisture are dark, and dry hillslopes and other interfluves are predominantly bright. Even after snowfall events, widespread soil moisture enhancement is both rare and short-lived, as most snow that falls in the MDV sublimates (Fountain et al. Reference Fountain, Nylen, Monaghan, Basagic and Bromwich2009).
The strong spatial zonation of soil moisture into persistently wet and persistently dry areas has pronounced effects on ecosystem functioning and biogeochemical processes in the MDV. Soil moisture patterning drives soil primary production (Burkins et al. Reference Burkins, Virginia and Wall2001), invertebrate (Nkem et al. Reference Nkem, Virginia, Barrett, Wall and Li2005, Poage et al. Reference Poage, Barrett, Virginia and Wall2008) and microbial (Ball & Levy Reference Ball and Levy2015, George et al. Reference George, Fierer, Levy and Adams2021) habitat distribution and biologically relevant soil thermal regime (Levy & Schmidt Reference Levy and Schmidt2016, Wlostowski et al. Reference Wlostowski, Gooseff and Adams2018). Soil moisture also controls geological and physical processes such as chemical weathering and solute transport, which in turn have feedbacks on MDV biological functioning and permafrost processes (Campbell & Claridge Reference Campbell and Claridge1987, Dickinson & Rosen Reference Dickinson and Rosen2003, Gooseff et al. Reference Gooseff, McKnight, Runkel and Vaughn2003, McKay Reference McKay2009, Hagedorn et al. Reference Hagedorn, Sletten, Hallet, McTigue and Steig2010, Levy et al. Reference Levy, Fountain, Gooseff, Barrett, vanTreese and Welch2013, Toner & Sletten Reference Toner and Sletten2013).
Could other, unknown mechanisms also deliver moisture to MDV soils beyond the current understanding of MDV groundwater budgets and spatial zonation patterns (Gooseff et al. Reference Gooseff, Barrett and Levy2013)? Field observations of enhanced soil moisture across wide spatial extents in the MDV outside of known soil moisture hotspots (Fig. 1) suggest that this may be the case. Anecdotal field observations consist of photographs and observations of dark, dampened soil across basin-scale spatial extents (e.g. broadly across the eastern Lake Bonney basin; Fig. 1). These dampened soil events are not associated with widespread snowfall or melt, although cloud cover, snow virga and high humidity conditions are associated with the field observations.
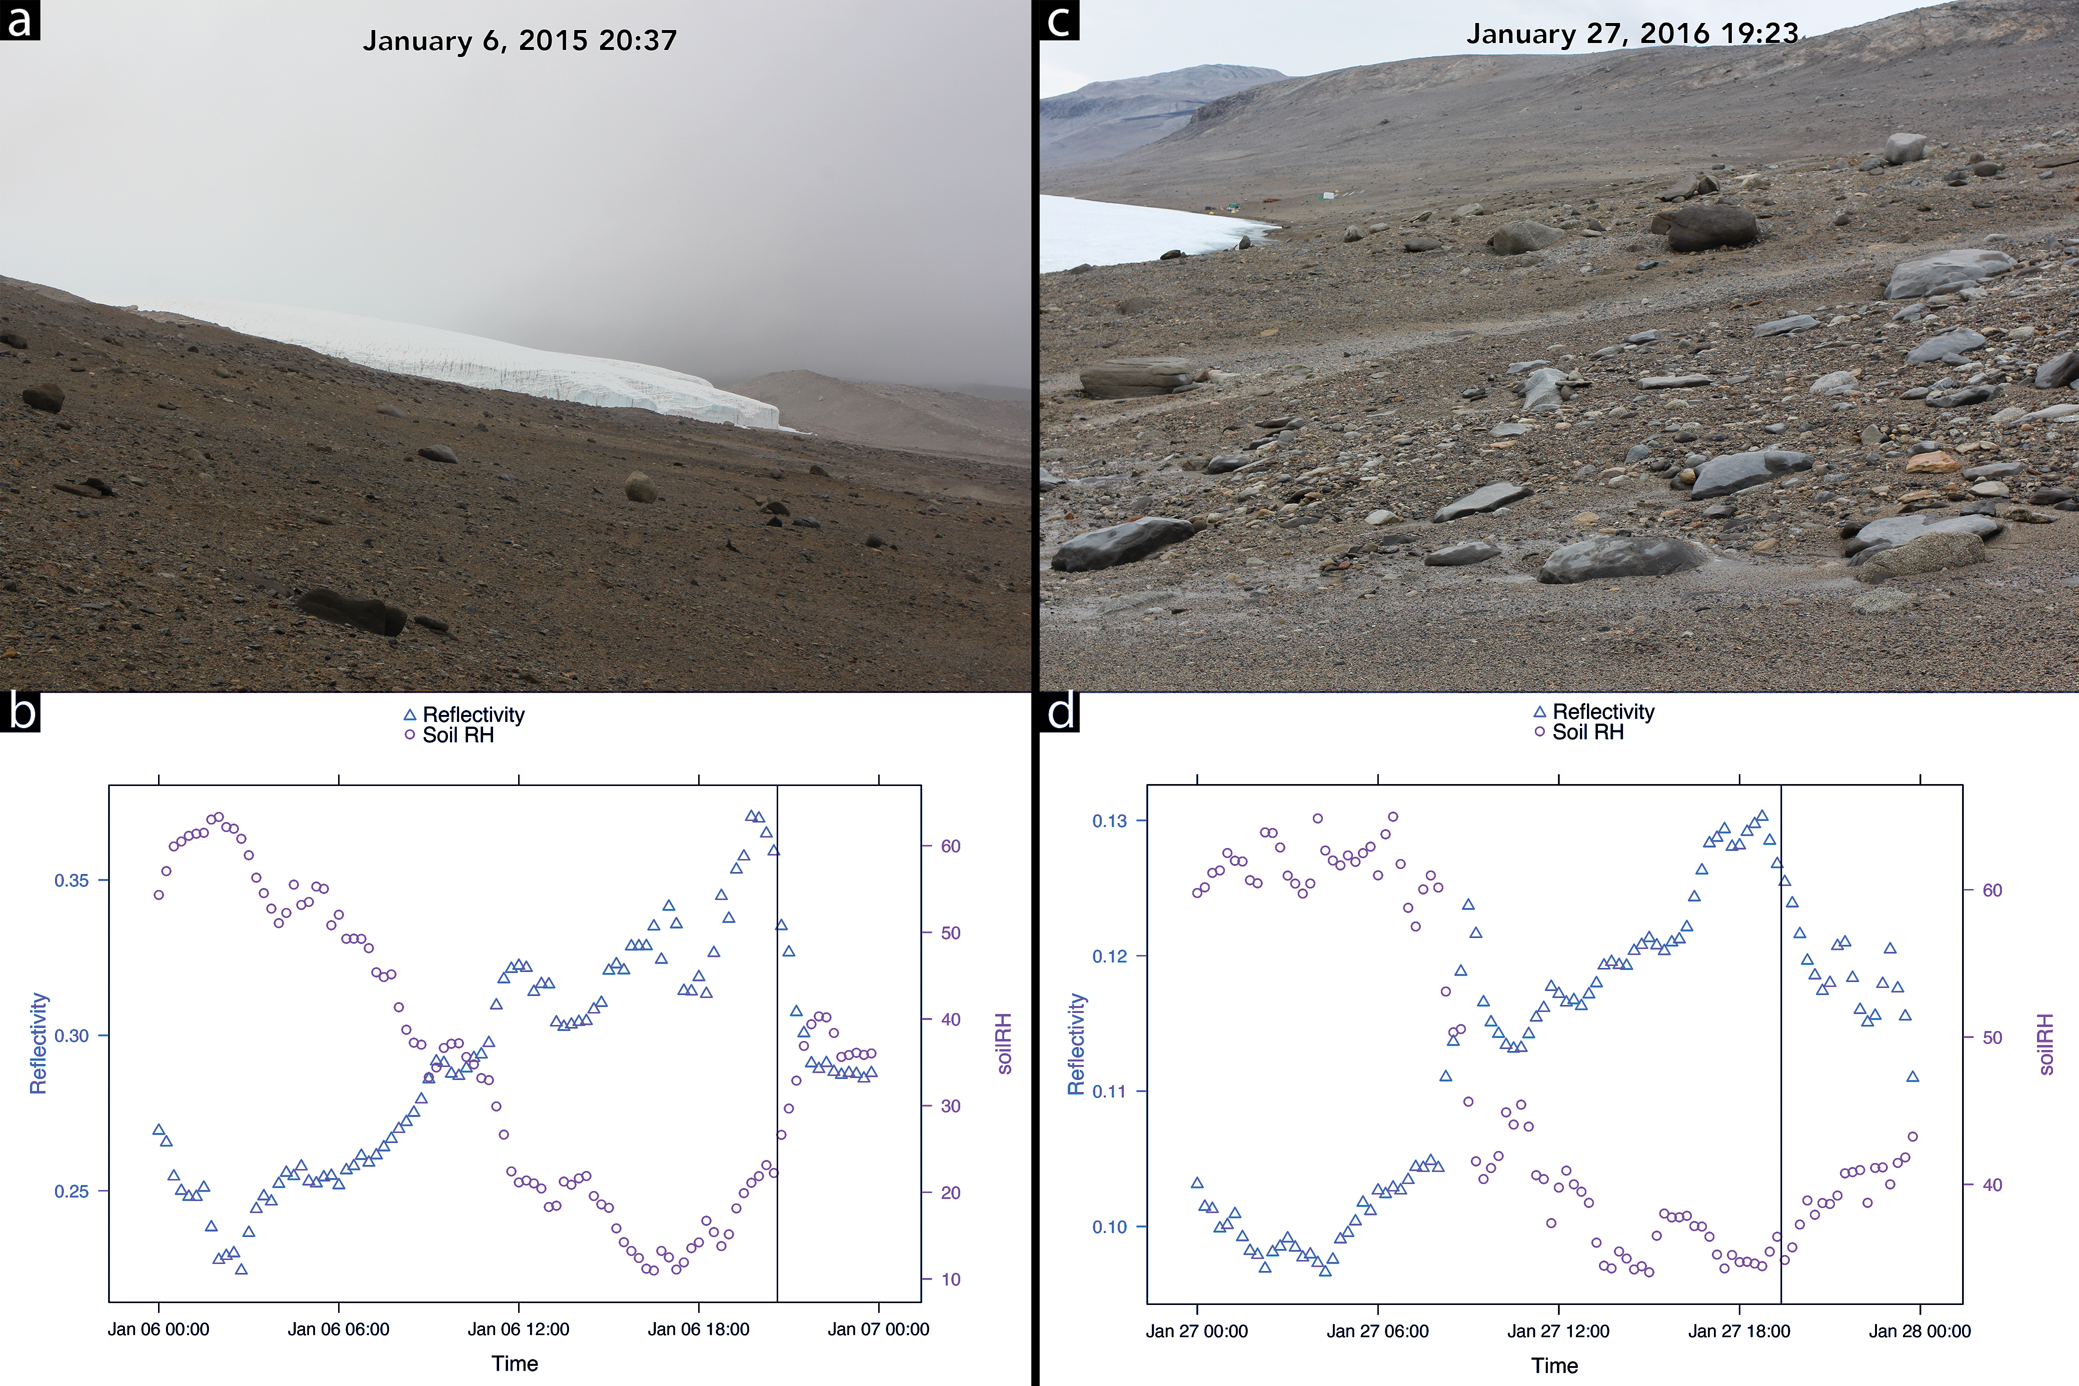
Fig. 1. Field observations of widespread soil wetting in the Lake Bonney basin that occurred in the absence of snowmelt. a. Field image looking west at 20h37 on 6 January 2015. b. Soil reflectivity (triangles) and soil relative humidity (RH; circles) measurements for 6 January 2015. Time of photograph is marked by the vertical line. Note the abrupt drop in soil reflectivity and the abrupt increase in soil RH. c. Field image looking east at 19h23 on 27 January 2016. Note that the soil is not uniformly darkened. d. Soil reflectivity and soil RH measurements for 27 January 2016. Time of photograph is marked by the vertical line. Note the abrupt drop in soil reflectivity and the abrupt increase in soil RH. Photograph credit: Joseph Levy.
In this paper, long-term meteorological records are analysed to determine whether soil darkening reported anecdotally is recorded in the instrument record, whether it is associated with potential atmospheric forcing (relative humidity and/or temperature) and whether changes to soil reflectivity are consistent with the potential formation of widespread surficial soil solutions. Because long-term soil moisture measurements are not available across the MDV, this study relies on reflectance as a stand-in for soil moisture, owing to the strong reflectance sensitivity to soil moisture for MDV sediments. Results from this investigation can provide a potential framework for determining drivers of soil moisture outside of hydrological focus regions should a network of regional soil moisture sensors be established.
Methods and data processing
Currently released McMurdo Dry Valleys Long Term Ecological Research (MCM-LTER) 15 min meteorological station data for the Lake Bonney station were accessed from https://mcm.lternet.edu/. Relevant datasets for this investigation are relative humidity, shortwave radiation, soil temperature, air temperature, snow height and precipitation (Doran & Fountain Reference Doran and Fountain2019), collected as part of the LAWN (Long-Term Automatic Weather Station) network (Doran et al. Reference Doran, McKay, Clow, Dana, Fountain, Nylen and Lyons2002). The Lake Bonney LAWN station sits on sand- and pebble-dominated, gelisol-order soils with a pronounced desert pavement of coarse sands, pebbles and cobbles. Cryoturbation is limited at the site, leading most upper Taylor Valley soils to be classified as typic anhyorthels (Bockheim et al. Reference Bockheim, Prentice and McLeod2008). Soils at the site are dominantly Taylor-II/Bonney Drift glacial deposits, emplaced ~113–120 ky ago, which consist of poorly sorted sands and gravels, along with glaciofluvial and glaciolacustrine sands, silts, carbonates and organic matter in places (Bockheim et al. Reference Bockheim, Prentice and McLeod2008). Salts are common at the site, with visible salt efflorescences in the soil starting at 3 cm depth, and the soils support a column-integrated salt abundance of 1029 mg/cm2 down to 70 cm depth (Bockheim et al. Reference Bockheim, Prentice and McLeod2008). Ice-cemented soil is common at the site at depths > 45 cm, beneath dry-frozen permafrost, as active layer depths range from 20to 45 cm (Bockheim et al. Reference Bockheim, Campbell and McLeod2007).
Upwelling and downwelling shortwave radiation (W/m2) are measured with Licor LI-200R pyranometers. For this project, surface reflectivity is defined as the unitless ratio of upwelling to downwelling radiation:
 $$\eqalign{{\rm Reflectivity} &= {\rm upwelling} ( {{\rm reflected}} ) {\rm shortwave} / \cr&\quad\ {\rm downwelling} ( {{\rm incident}} ) {\rm shortwave}$$
A typical response curve for these hemispheric shortwave sensors is linearly increasing sensitivity from 400 to 950 nm, followed by a linear decrease in sensitivity to a cut-off at ~1100 nm. This produces maximum errors of ± 5% maximum and typical measurement uncertainties of ± 3% (Doran & Fountain Reference Doran and Fountain2019). The Licor pyranometers are factory-calibrated against Eppley pyranometers and are typically replaced and refurbished every 2 years (Doran & Fountain Reference Doran and Fountain2019).
Air and soil temperature are measured using Fenwal Electronics-type UUT51J1 thermistors. Application of the Steinhart-Hart equation (Steinhart & Hart Reference Steinhart and Hart1968) results in a fit that is ± 0.02°C over the -40°C to +60°C range (Doran & Fountain Reference Doran and Fountain2019).
Relative humidity is measured using Vaisala HM70 relative humidity sensors, which replaced Phys-Chem 207 sensors in use in the earliest field seasons. Combined temperature and electrical uncertainty with these sensors results in a relative humidity accuracy of ~5% (at 25°C) over the humidity range of 12–100% (Doran & Fountain Reference Doran and Fountain2019).
A series of R scripts were used to process raw .csv-formatted data. All scripts are available for download at https://github.com/jslevy/mdv_albedo. Data processing and extraction are shown schematically in Fig. 2.
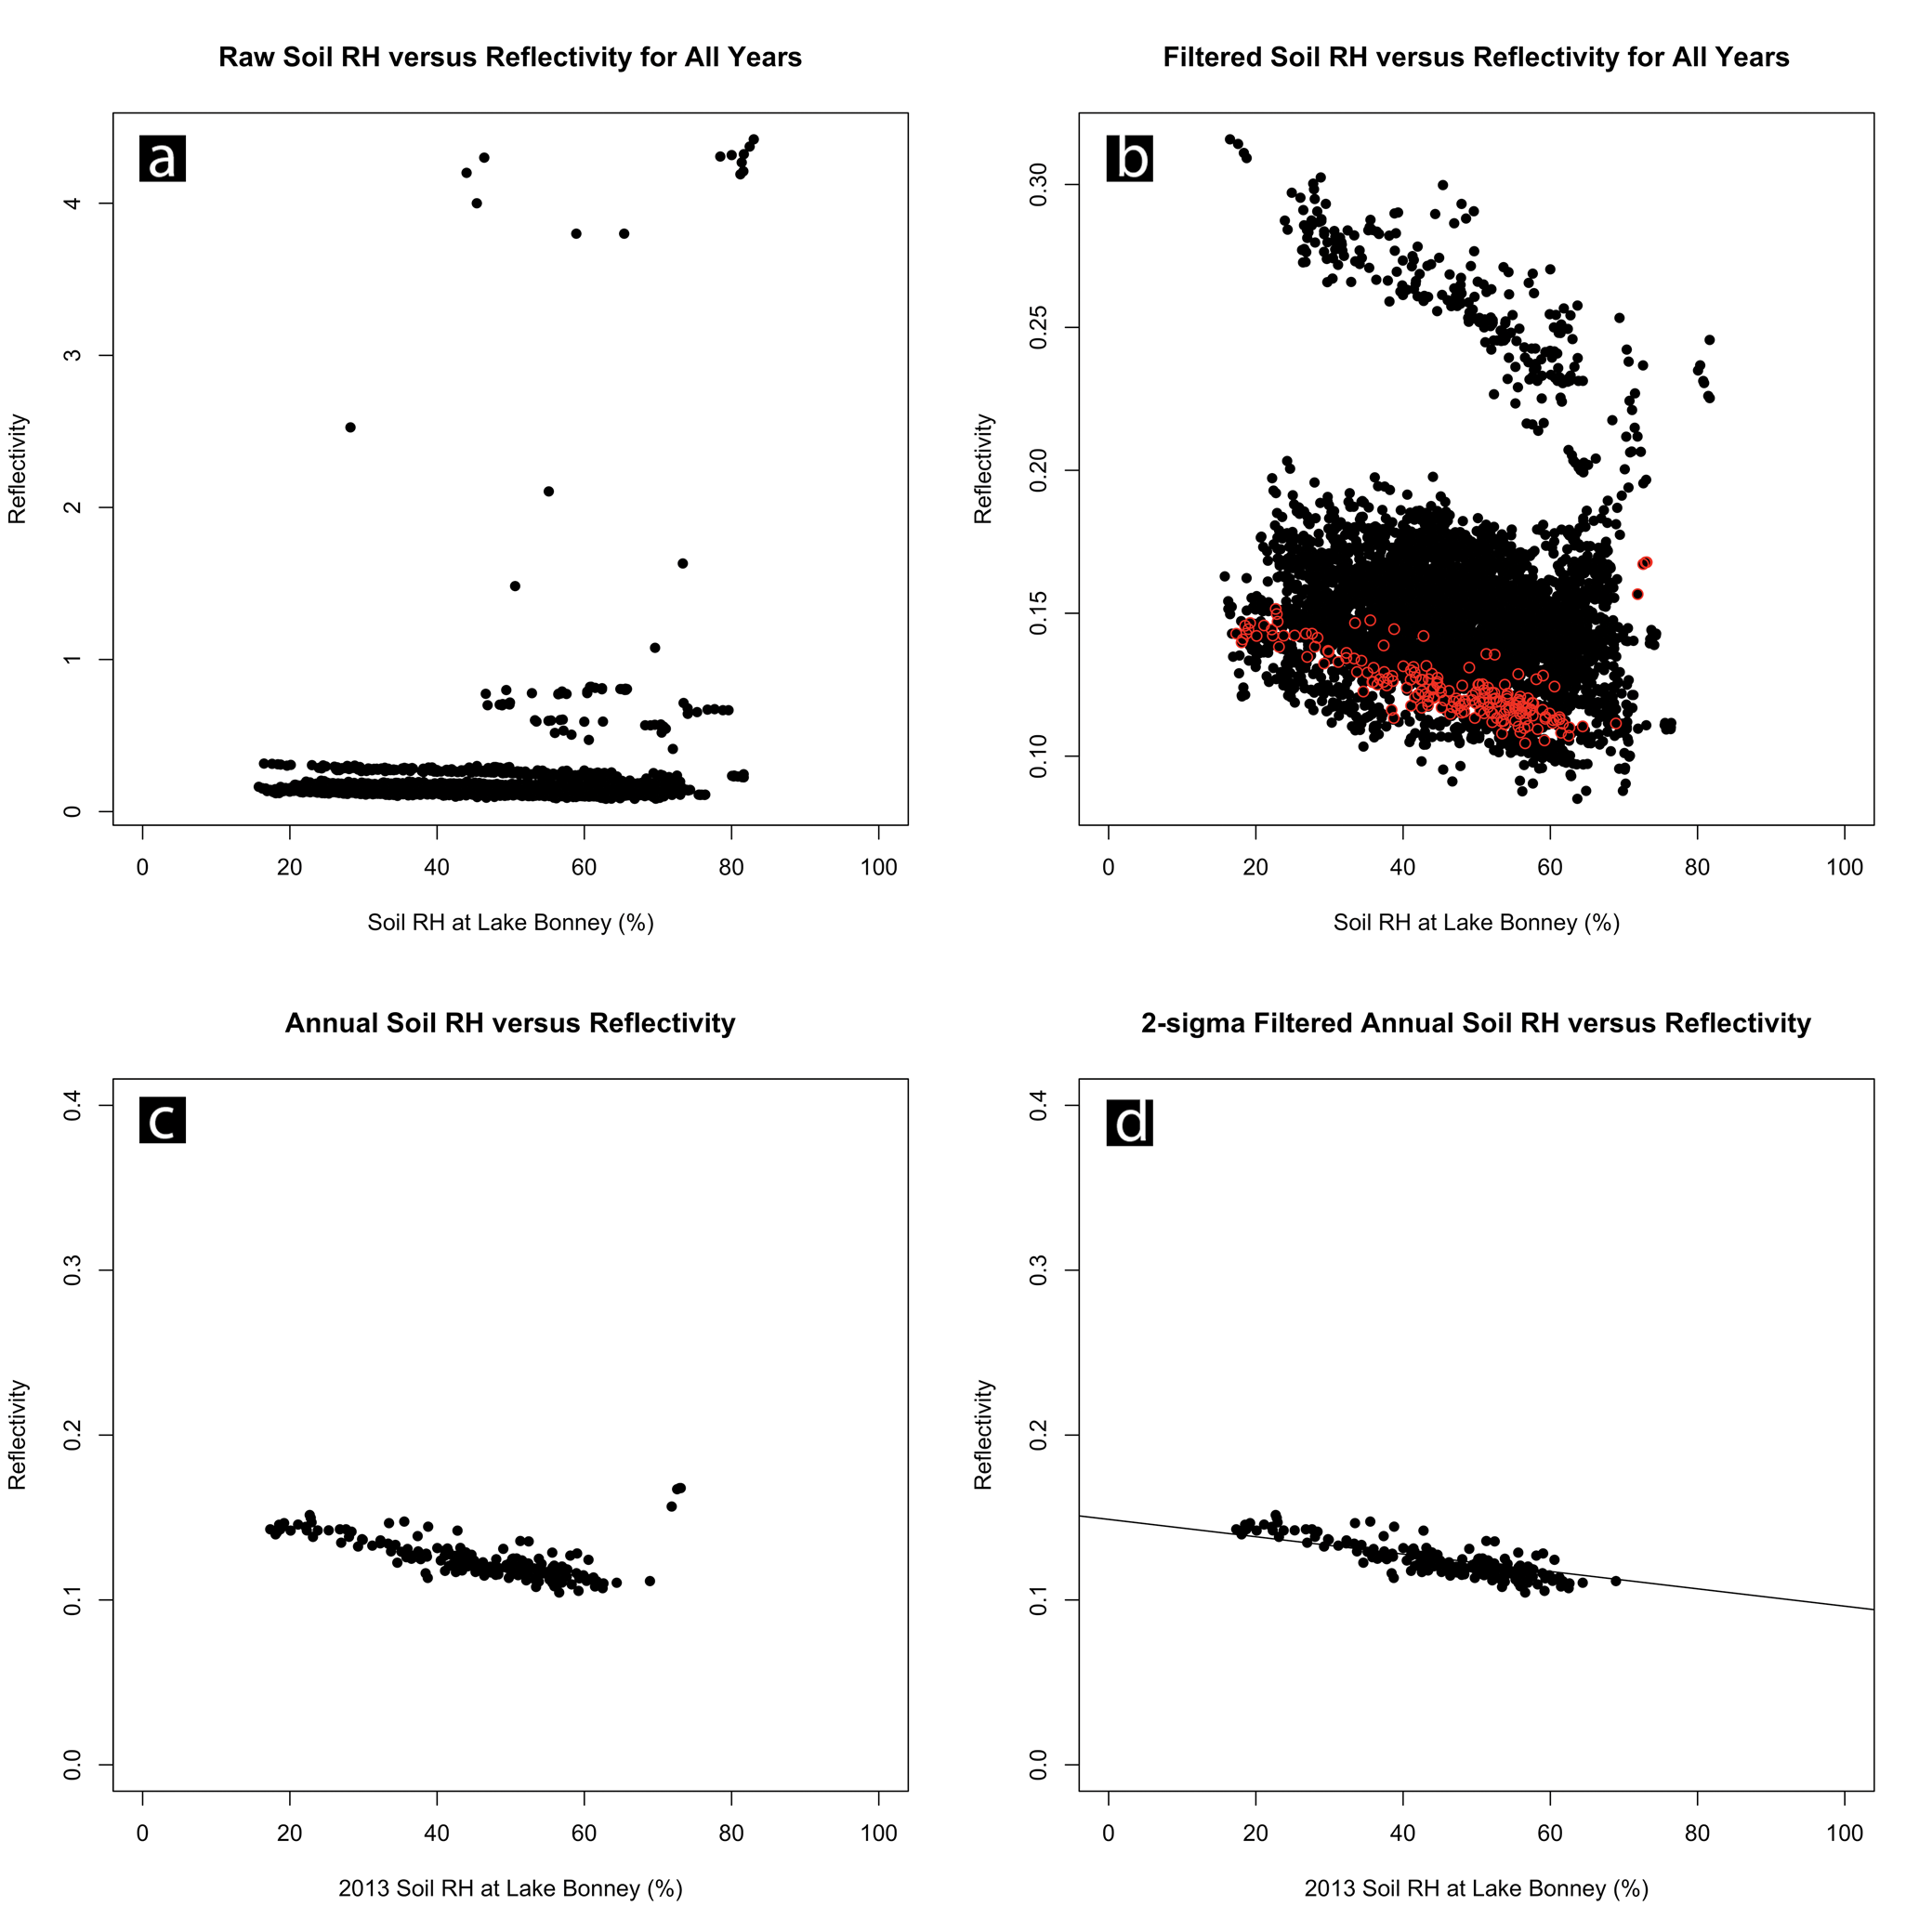
Fig. 2. Example data filtering process. a. Scatterplot of reflectivity and soil relative humidity (RH) for all records over all years. b. Reflectivity and soil RH data from January for all years after filtering to remove reflectance values exceeding 0.4. Data from January 2013 are shown in red. c. Reflectivity and soil RH data from January 2013, to which a linear regression model was fit to remove reflectance values associated with snowfall. d. Fully filtered reflectance and soil RH data for January 2013 and the resulting linear model fit to the filtered data. Note the removal of a small number of high-reflectivity points at the highest soil RH values removed by the filter.
Because surface albedo can vary as a function of solar zenith angle (Briegleb et al. Reference Briegleb, Minnis, Ramanathan and Harrison1986, Yang Reference Yang2008), data were filtered to only include observations when direct-beam incident radiation is zero (i.e. the station is in shadow). This minimizes the effect where at high solar zenith angle (low sun elevation) albedo appears to rise due to increased scattering from the surface. Considering only diffuse illumination also reduces the impacts from sky anisotropy and sensor anisotropy. In practice, sensor station data were filtered to include only values collected during the month of January (when field observations of widespread soil wetting have occurred; Fig. 1) and between 00h00 and 02h00 local time when the Lake Bonney station is in full shadow (Fig. 3). See the ‘Discussion’ section for an analysis of the impacts of measuring indirect and reflected light.
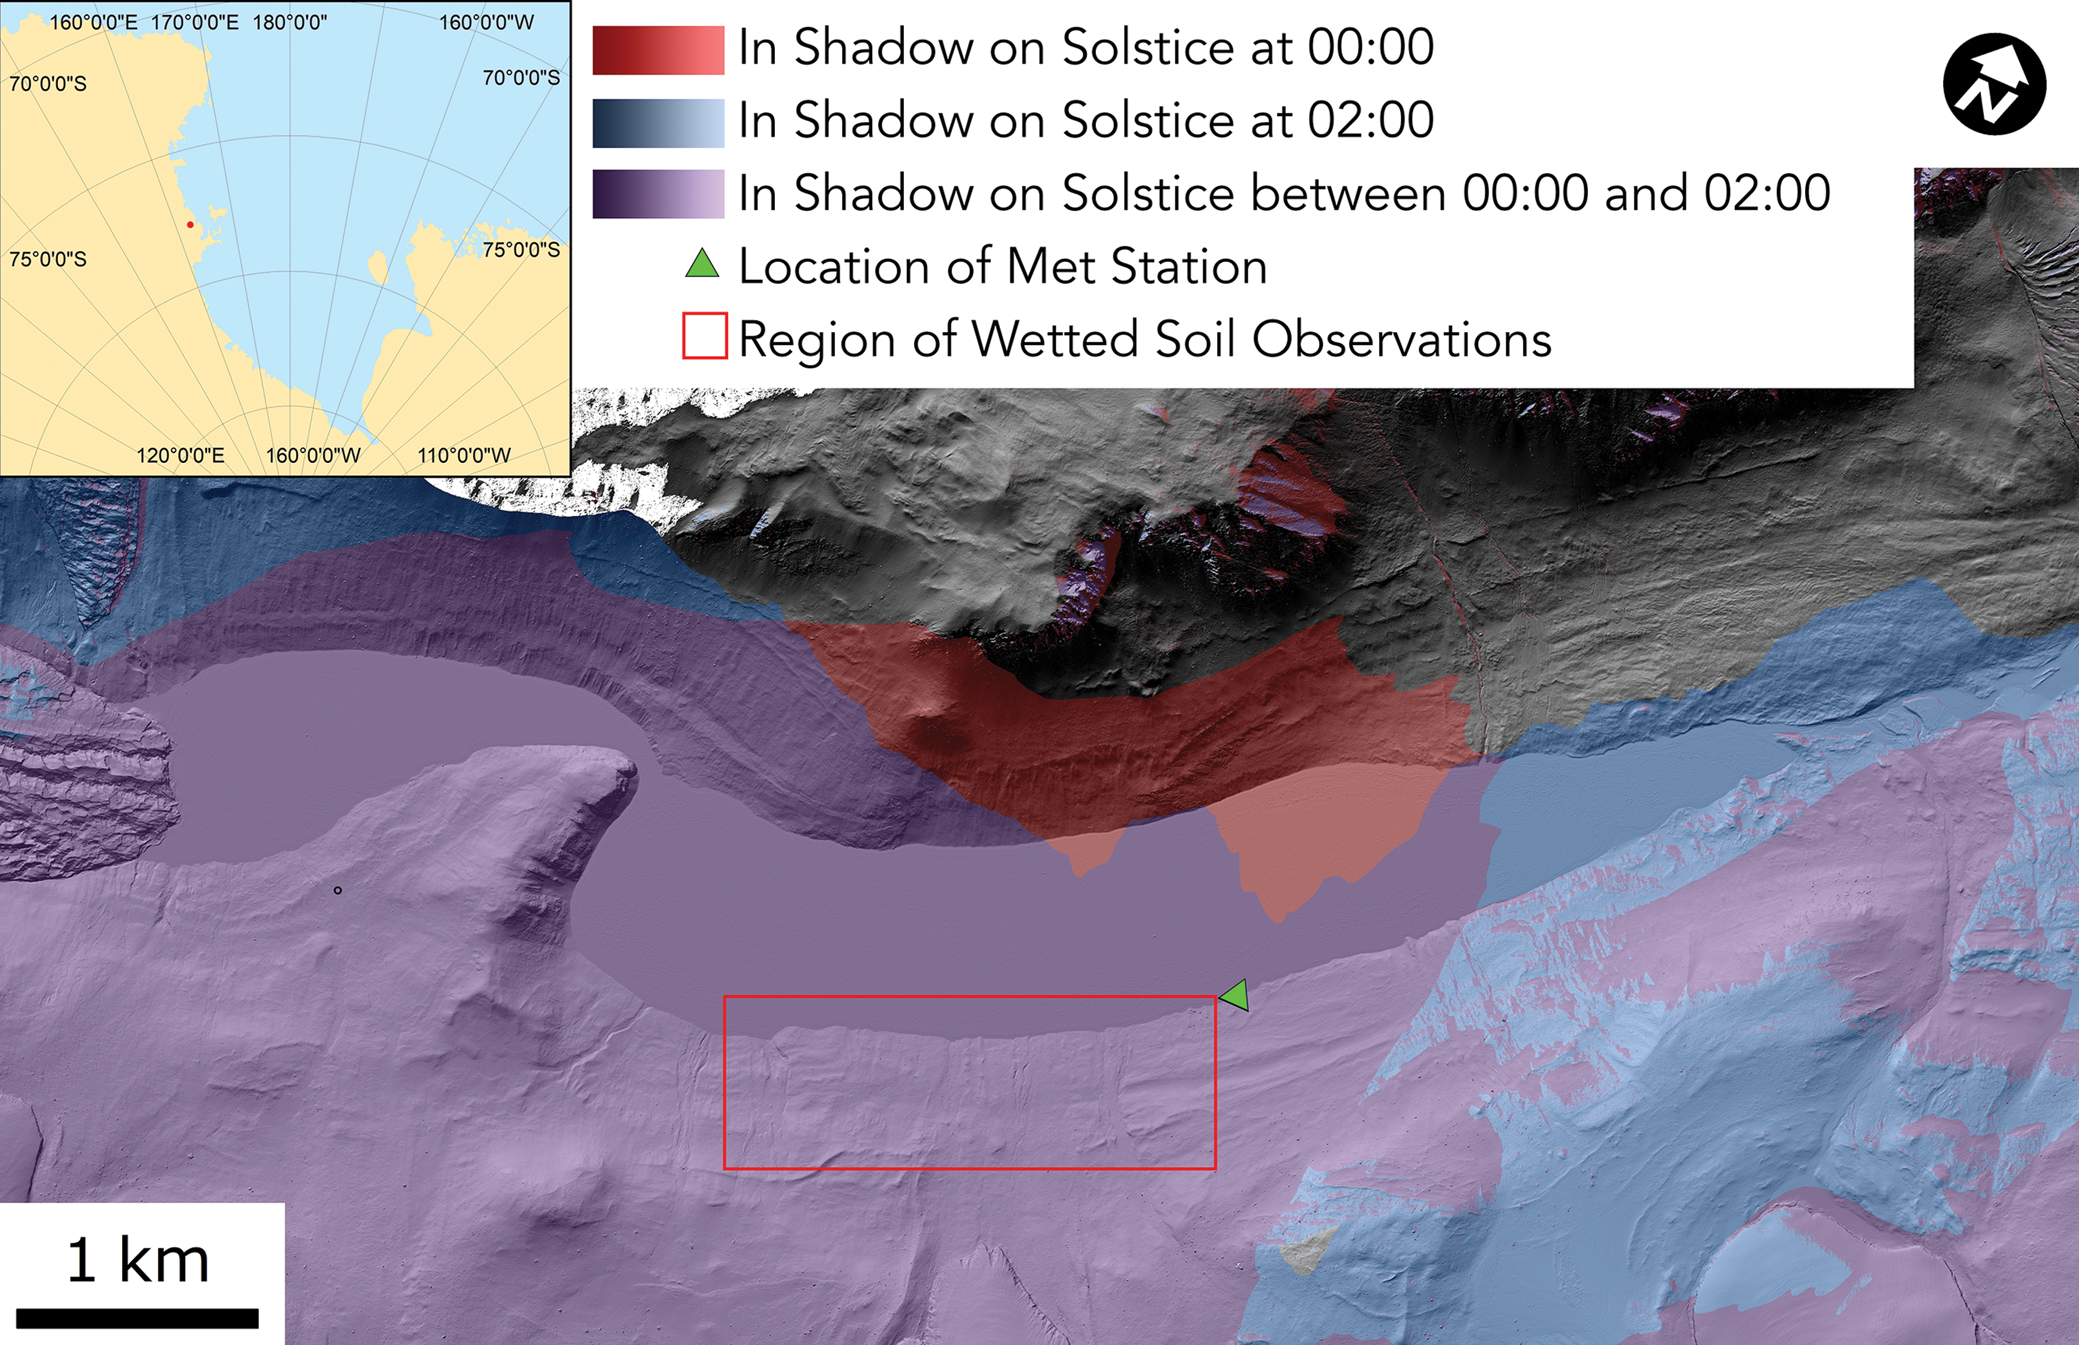
Fig. 3. Field setting for this study, showing Lake Bonney McMurdo Dry Valleys Long Term Ecological Research (MCM-LTER) meteorological station relative to maximum solar elevation (summer solstice) illumination conditions. The meteorological station is in shadow reliably between 00h00 and 02h00 during summer months. Uncoloured, greyscale regions are illuminated during this time range. Inset map shows the location of the field site in the Ross Sea sector of Antarctica (site is marked by a red dot). The base map is LIDAR hillshade from Fountain et al. (Reference Fountain, Fernandez-Diaz, Obryk, Levy and Gooseff2017).
Relative humidity data were reprocessed to determine the equivalent relative humidity for air in contact with and in thermal equilibrium with the soil surface, here termed ‘soil relative humidity’. Soil relative humidity was calculated by determining total atmospheric vapour pressure measured at 3 m elevation (relative humidity × saturation vapour pressure for air temperature recorded at 3 m) using the Magnus equation in the Huang (Reference Huang2018) formulation, and then determining the saturation vapour pressure for air in equilibrium with the soil surface temperature. Soil relative humidity is the ratio between the water vapour pressure measured at 3 m elevation and the saturation vapour pressure of air that has the same temperature as the soil surface:
 $$\hbox{Soil relative humidity} = ( {p_{{\rm vap}, 3{\rm m}}} ) / ( {\,p_{{\rm vap}, {\rm sat}, {\rm ground}}} ) $$
where p vap,3m is water vapour pressure measured at 3 m elevation and p vap,sat,ground is saturation vapour pressure for air at the same temperature as the soil surface.
Data were then further filtered to remove reflectance artefacts and reflectance points that were dominated by the presence of snow. Data points with reflectivity in excess of maximum MDV soil albedo (~0.4) were removed. Anomalously high reflectance values could result from snow on the ground, objects in the upwelling radiation sensor field of view, stray light reflected off illuminated snowy surfaces, etc.
In order to account for changes in apparent reflectivity owing to year-to-year changes in measurement parameters (e.g. the level or geometry of the upwelling sensor, soil roughness in the upwelling sensor field of view, changes to sensor position over time, changes to the distribution of objects in the hemispheric field of view, etc.), the full record was subdivided by year (Fig. 2). Observations recorded when snow was on the ground in the reflected radiation sensor footprint typically show a small number of comparatively high reflectivity value outliers associated with very high relative humidity conditions (in excess of ~70% relative humidity). To remove these snow-influenced observations, a linear model testing for correlation between soil relative humidity and reflectance in each year was fit to the data and a filter was applied that rejected observations for which measured reflectance was more than two standard deviations above the linear model's predicted reflectance. In practice, this removes a small number of high-reflectivity outliers associated with the highest relative humidity measurements that are interpreted as snow-related observations.
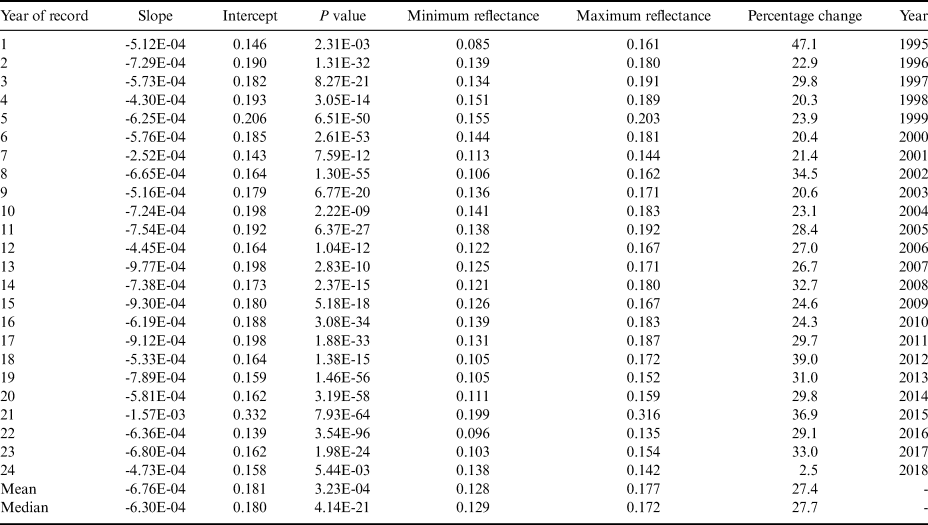
Annual data that had been filtered for snow-related observations were used for subsequent analysis steps. A linear model testing for correlation between soil relative humidity and reflectance was fit to the filtered data. The slopes, intercepts and P values of the linear models are reported for each measurement year in Table I. A linear model testing for correlation between soil temperature and reflectance was also fit to each year's observations.
Table I. Summary of reflectivity change as a function of changing soil relative humidity by year.
Results
Reflectivity at the Lake Bonney study site varies linearly with soil relative humidity (Fig. 4). The median highest reflectivity over all years is 0.172 and the median reflectivity minimum is 0.127, a 27.7% difference between maximum and minimum observed reflectivity. Raw measured relative humidity at 3 m spans ~20–80%, while soil relative humidity spans ~20–60% owing to soil temperatures commonly exceeding air temperatures during shadowed, night-time conditions, reducing the soil relative humidity by increasing the soil saturation vapour pressure.

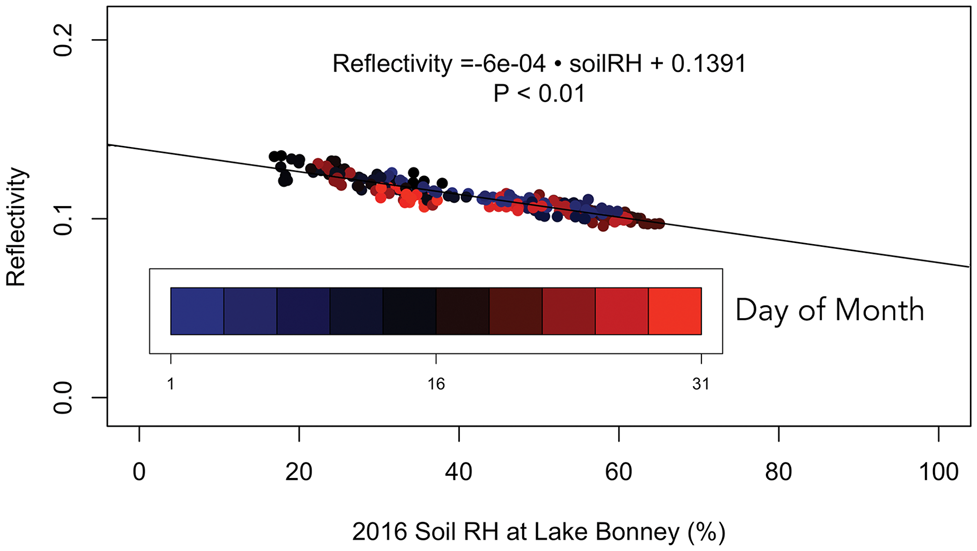
Fig. 4. Reflectivity vs soil relative humidity (RH) for January 2016. Data points are coloured by day of the month. The highest reflectivity values occur mid-month, and no clear reflectivity progression exists through time that could indicate confounding effects from solar elevation change over the course of the month. Comparable figures for all years can be found in the Supplemental Material.
Reflectivity is inversely correlated with soil relative humidity in all sampling years (Table I). A linear fit to soil relative humidity and reflectance datasets gives a median decrease of 6.3 × 10⁻⁴ in reflectivity per 1% increase in relative humidity, with a median intercept reflectance value of 0.18 at 0% relative humidity. Linear models are strongly statistically significant, with median P values much less than 0.001. Reflectivity shows no pattern with day of month, a proxy for solar elevation (Fig. 4). High and low reflectivity values are determined over the full course of the month, with no clustering of values by day.
A slight positive correlation exists between soil temperature and reflectivity over the sampling years, with comparably low P values relative to the relative humidity linear models (Fig. 5). The range of soil temperatures over which reflectivity varies with soil relative humidity is ~-4 to +8°C.
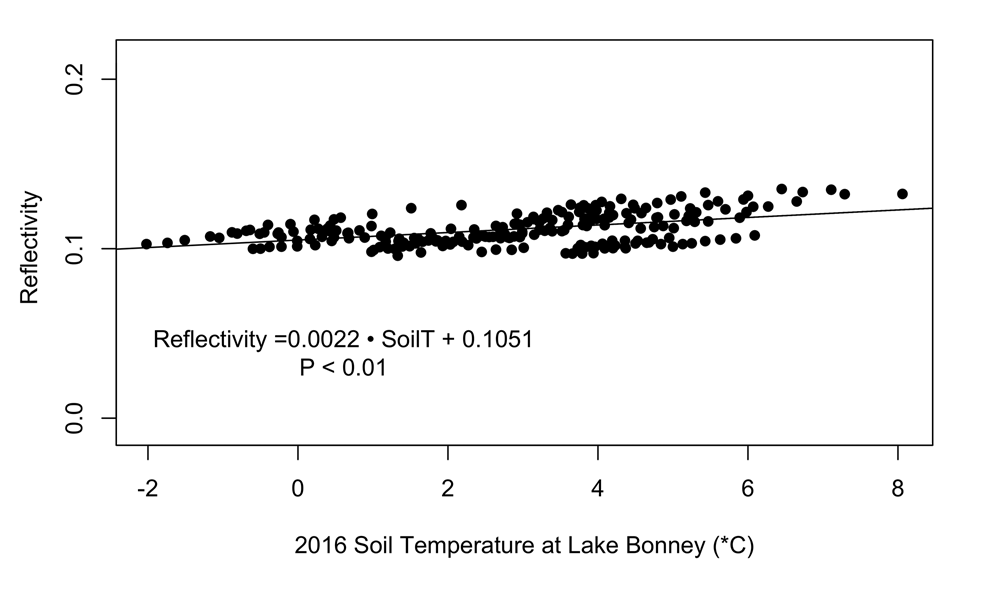
Fig. 5. Reflectivity vs soil temperature for January 2016. Linear point clusters show cooling trends on single-day timescales.
When snow height measured using sonic ranging is compared to reflectivity on days of interest determined by field observations of widespread soil darkening, no clear relationship exists that exceeds the ± 5 cm uncertainty threshold of the snow height sonic ranger observations (Fig. 6). Below the uncertainty threshold, snow height measurements on 6 January 2015 are anti-correlated with surface reflectivity.
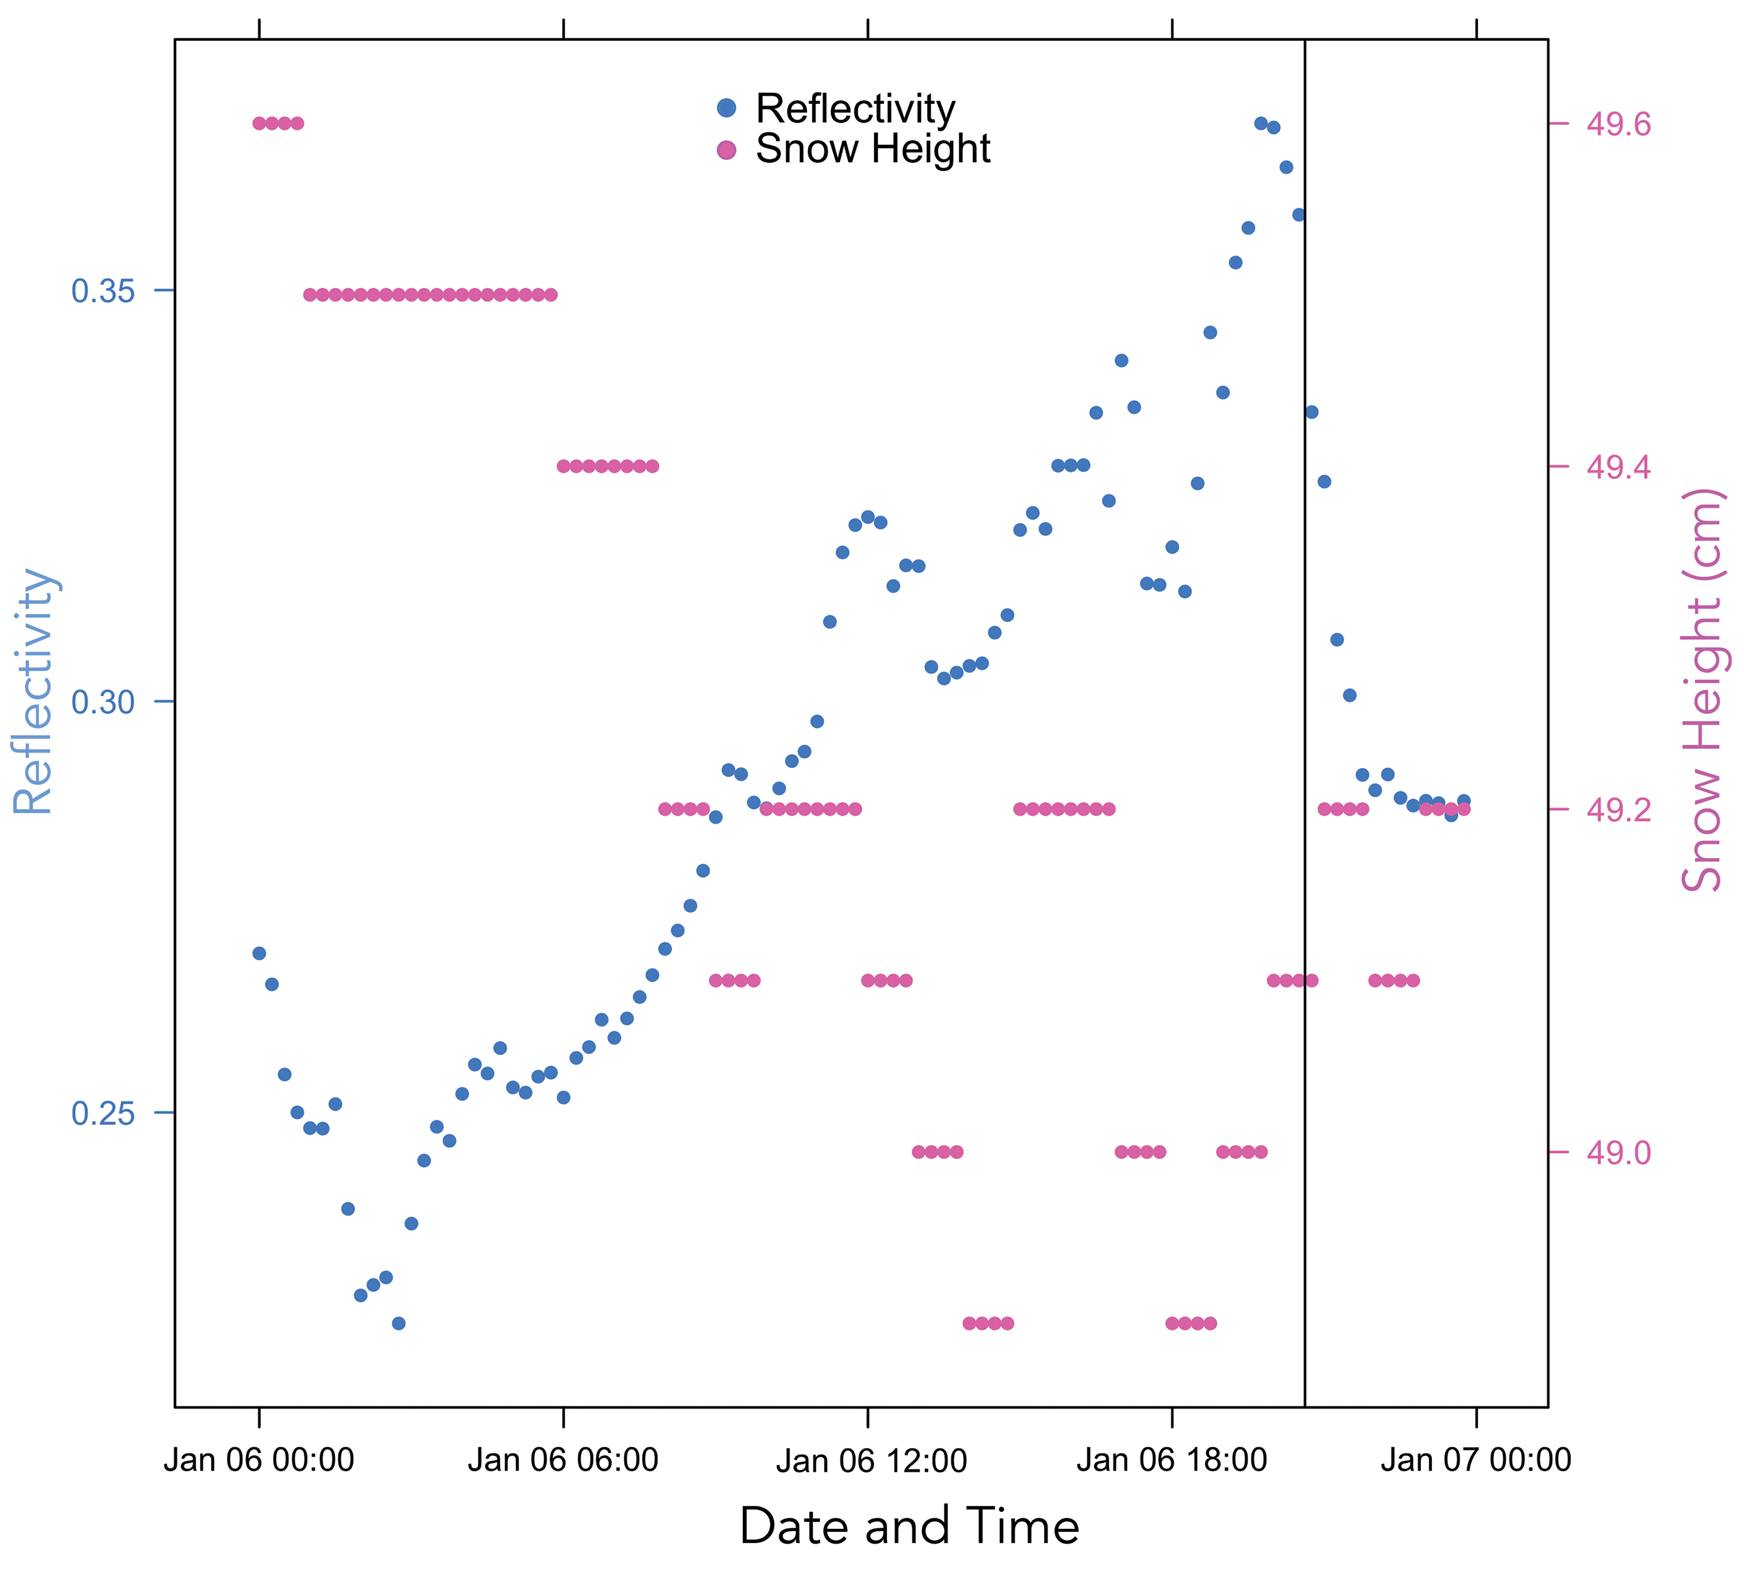
Fig. 6. Soil reflectivity and ultrasonic ranging-derived snow height for 6 January 2015 (see Fig. 2). Time of the photograph in Fig. 2 (when snow on the ground is absent) is marked by the vertical line. Reflectivity changes appear largely anti-correlated with apparent snow height, but snow height variability is below the measurement precision of ± 5 cm. No snow was present on the ground at the meteorological station during this interval.
Discussion
The strong linear relationship between soil relative humidity and decreased soil reflectivity may be an indication of soil darkening due to increases in soil moisture content. If so, these observations suggest that widespread soil wetting may occur under high relative humidity in some regions of the MDV. Such a process could function as a basin-scale moisture source that could affect biogeochemical processes in these cold desert soils. The growth of humidity-controlled soil porewater solutions over hourly timescales has been observed in highly saline water tracks (Dickson et al. Reference Dickson, Head, Levy and Marchant2013), around the periphery of highly saline ponds (Gough et al. Reference Gough, Wong, Dickson, Levy, Head, Marchant and Tolbert2017) and in isolated saline soil patches (Levy et al. Reference Levy, Fountain, Welch and Lyons2012), as soil salts deliquesce and vapour enters deliquescent brines, increasing the size of the brine droplets. However, the instrumental observations reported here are the first that suggest that anomalous episodes of high soil moisture content (sufficient to cause observable surface darkening) may occur away from hypersaline microenvironments in more typical MDV soils.
Instrumental considerations and error sources
Is it possible that the observed reflectivity changes are a result of a process other than soil moisture development? Critically, the reflectance signal does not appear to be a change associated with changing sky albedo. Field observations suggest that it is commonly overcast and cloudy when MDV relative humidity is high and apparent soil wetting occurs. ‘White sky’ ground albedo under cloudy or overcast conditions is higher for most surfaces than ‘blue/black sky’ albedo under clear skies, (e.g. Marion Reference Marion2021). A sky albedo change in the record would tend to increase apparent reflectivity under overcast conditions rather than decrease it as observed here.
Another potential confounding factor that could drive reflectivity observations could be changes to sensor positioning or height or objects in the hemispheric field of view. For example, reflectivity is notably higher in 2015 than in any other year (see Fig. 2b, as well as Supplemental Material). In this year, reported outgoing (reflected) shortwave radiation values are commonly approximately two times greater than measured values in other years in the record (> 200 vs ~100 W/m2). Likewise, some years (e.g. 2017 or 2012) show a bifurcated reflectance record, with two linear trends of decreasing reflectivity with increasing soil relative humidity. These bifurcated records commonly show clustering in time (e.g. early or late in the month of January), suggesting that changes to the sensor field of view may change calculated reflectivity by a few percent. Importantly, however, in all of these cases, decreasing soil reflectivity is observed in all years in association with increasing relative humidity, regardless of the absolute reflectance value. This suggests that the reflectance change observed here is largely insensitive to absolute calibration of the sensor or changes to the sensor footprint (e.g. roughening during station servicing).
The strong linear relationship between soil relative humidity and reflectivity is notable because it is measured by ratioing downwelling solar irradiance with reflected irradiance. The LI-200R probe carries a manufacturer's warning that the measured irradiance (W/m2) may not be accurate if the sensor is used to measure obstructed light, light under cloud cover, artificial light, light filtered through glass or reflected light (https://www.licor.com/documents/d3ckr4kis42388to96i96e0ukwru0p69).
The accuracy change may occur under reflected light conditions due to the difference between the incident solar spectrum and the reflected light ground spectrum. A photodiode on the LI-200 converts irradiance to electrical current, which is then converted to voltage that is measured by the Campbell Scientific data logger. The LI-200 is calibrated against the surface solar spectrum such that the summed photodiode spectral sensitivity times the incident solar spectral irradiance across the ~400–1100 nm range of the sensor is proportional to the integrated total solar radiance reaching the ground. The photodiode has non-uniform sensitivity and is more sensitive to longer wavelengths in the visible to near-infrared range, reaching a peak sensitivity between 900 and 1000 nm (Fig. 7). Because the constant of proportionality between current and irradiance is set during calibration and because the photodiode has variable spectral sensitivity but no spectral resolution, light entering the sensor will produce a larger change in apparent (measured) irradiance when that light has a wavelength in the range that the photodiode is more sensitive to and will produce a smaller change when the light has a wavelength in the low-sensitivity range.
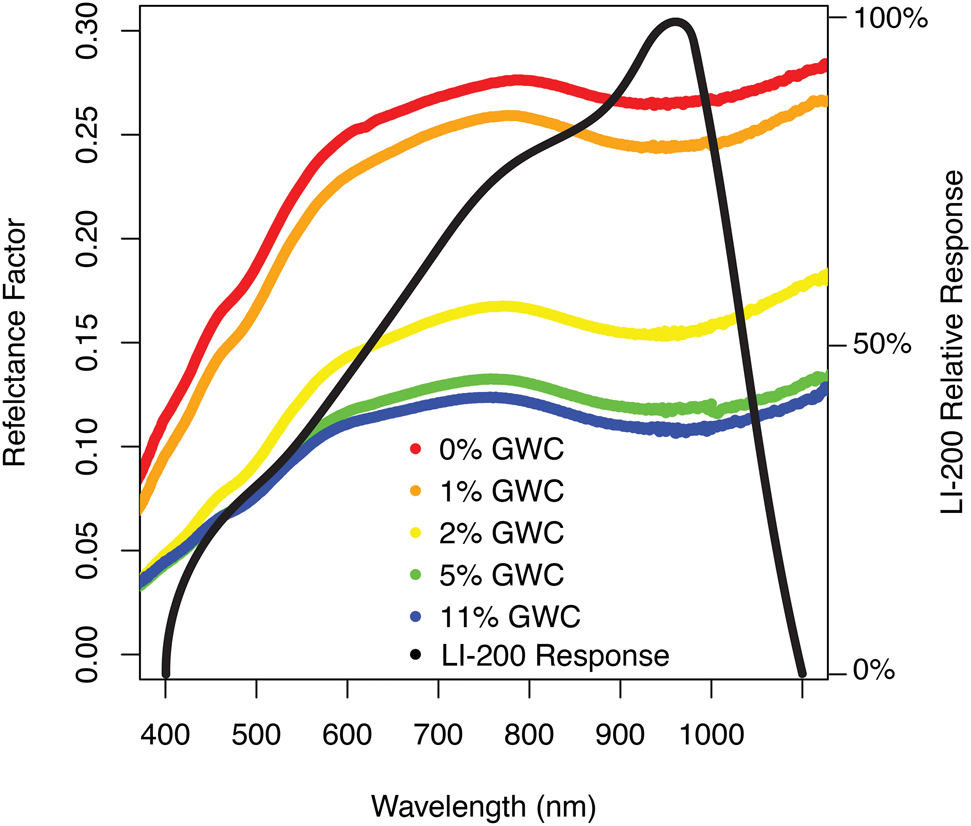
Fig. 7. Reflectance factor for dry and wetted McMurdo Dry Valleys soils over a soil moisture range from 0 to 11 wt.%, determined via gravimetric water content (GWC) determination reported by Levy et al. (Reference Levy, Nolin, Fountain and Head2014), compared to the LI-200 relative response.
The change in reflectance in MDV soils in response to wetting is non-uniform as well. When water is added to MDV soils, the largest reduction in reflectance occurs at the 1.4 and 1.9 μm water absorption features, although broad darkening occurs across the near-infrared and into the visible (Fig. 7) (Levy et al. Reference Levy, Nolin, Fountain and Head2014). Within the spectral range of the LI-200 sensor, the soil reflectivity reduction due to wetting is small in the low-sensitivity range of the photodiode (e.g. 400–500 nm) and is larger in the high-sensitivity range (600–1000 nm). This means that the largest changes to the measured irradiance from the soils occur where the LI-200 sensor is most sensitive to change and also where the soil reflectivity change is large. This means that the soil irradiance change from wetting is very measurable using an LI-200 (high sensitivity × large signal). However, the output current from the photodiode calibrated using the solar spectrum may be larger in terms of absolute irradiance (W/m2) than the integrated spectral irradiance (W/m2/nm) would be if the reflectivity change were measured with an instrument with a uniform spectral response and greater spectral resolution. The enhanced sensitivity of the LI-200 in a spectral range where the reflectance change is large has the potential to increase the apparent darkening of the soil during episodes of dampness.
This enhanced reduction in reflected irradiance from the soil may be partially offset in the reflectivity calculations presented above by reductions in the downwelling irradiance measured during diffuse light conditions. Water vapour in the atmosphere absorbs some power in the 700–1100 nm range. The spectral distribution of solar radiation power is markedly different on cloudy and clear days, as clouds absorb solar radiation in the near-infrared (Gates Reference Gates, Waggoner, Gates, Webb, van Wijk, Businger and Crawford1965). However, the spectral distribution of solar radiation can also show reductions in near-infrared irradiance at low sun angles when atmospheric scattering results in more opportunities for water vapour absorption. Because the incident radiation in the reflectivity calculations (Eq. (1)) is entirely diffuse radiation, some reduction in the incoming solar irradiance is expected at the 700–1100 nm range. This is where the LI-200 is most sensitive and also where darkening in soils occurs during wetting. The consistent and linear reduction in reflectivity as a function of soil relative humidity indicates that the reflectivity drop in the soils at high relative humidity is greater than the irradiance drop from atmospheric absorption during diffusive lighting conditions.
Taken together, these changes to incident and reflected light at the site suggest that reflectivity change is occurring in the soils as a function of soil relative humidity, but that the absolute irradiance change may be different from the value determined by the factory calibration that assumes a solar spectrum distribution of spectral irradiance. Because the sensitivity of the LI-200 is high in the spectral region where albedo change in wetted soils is most pronounced, the reported upwelling irradiance change at high relative humidity should be considered a maximum change. The actual reflected power flux may be lower, but it still sets useful upper bounds on the reflectivity change at the site. This type of semi-quantitative use of LI-200 sensors to measure reflected irradiance is a common application when weight, power or sensor distribution are limited (e.g. Canisius et al. Reference Canisius, Wang, Croft, Leblanc, Russell, Chen and Wang2019).
Soil hydrological implications
If soil reflectivity is changing as a consequence of rising soil moisture, what processes could cause this change? Soils could grow darker as soil moisture rises as a consequence of several mechanisms, including distributed soil salt deliquescence (Gough et al. Reference Gough, Wong, Dickson, Levy, Head, Marchant and Tolbert2017), capillary condensation in fine-grained soils or salts (Wierzchos et al. Reference Wierzchos, Davila, Sánchez-Almazo, Hajnos, Swieboda and Ascaso2012) or growth of unfrozen water droplets bound to soil matrix grains. It is notable that soil relative humidity and reflectivity follow a strong linear correlation; in none of the records is a steep reflectivity drop-off observed that might indicate abrupt phase change or deliquescence at a threshold relative humidity value. Gradual albedo change in response to changing relative humidity may be more consistent with the growth and interconnection of existing soil porewater droplets, which could form in response to deliquescence of soil salts (Gough et al. Reference Gough, Wong, Dickson, Levy, Head, Marchant and Tolbert2017) or could persist as either seasonally unfrozen matrix-bound water or capillary condensation deposits in fine-grained soil particles. Merging of these droplets into thin films sufficient to darken the soils could be an incremental process, resulting in the linear decrease in reflectivity. Continuous wetting is observed in MDV soils exposed to high-humidity conditions (e.g. Levy et al. Reference Levy, Fountain, Lyons and Welch2015), growing increasingly voluminous soil solutions at decreasing exponential rates, even after initial brine droplet formation has ceased.
A model in which high relative humidity causes the growth of pre-existing water droplets is consistent with the observed spatial pattern of soil darkening during high-humidity events (e.g. Fig. 1). Darkening of the soil is widespread over the whole Lake Bonney basin hillslope during the observed events; however, some soil regions remain light-toned - notably, the coarse-grained wind tails adjacent to cobbles and boulders. If the coarsest-grained sediments at the site remain undarkened, this suggests that any water or brine droplets in these soils had not grown large enough during the imaged albedo change event to coat the grains or to fully link between sand and granule grain boundaries, resulting in no change to the reflectance properties of the coarsest soils in the scene.
This interpretation is consistent with direct soil moisture and soil relative humidity measurements collected at other MDV long-term meteorological stations, such as the US Department of Agriculture (USDA) Soil Climate Research Stations (Seybold et al. Reference Seybold, Harms, Balks, Aislabie, Paetzold, Kimble and Sletten2009). At the Bull Pass USDA station, January soil relative humidity is strongly correlated with soil moisture content (Fig. 8). This station directly measures these two values at 2 cm depth, along with downwelling shortwave radiation, but does not measure upwelling (reflected) shortwave radiation, so the data cannot be filtered for high-albedo snow events as the MCM-LTER station data can be. In addition, the USDA stations log hourly vs at 15 min increments, reducing our ability to assess whether soil relative humidity leads or responds to soil moisture change at this station.
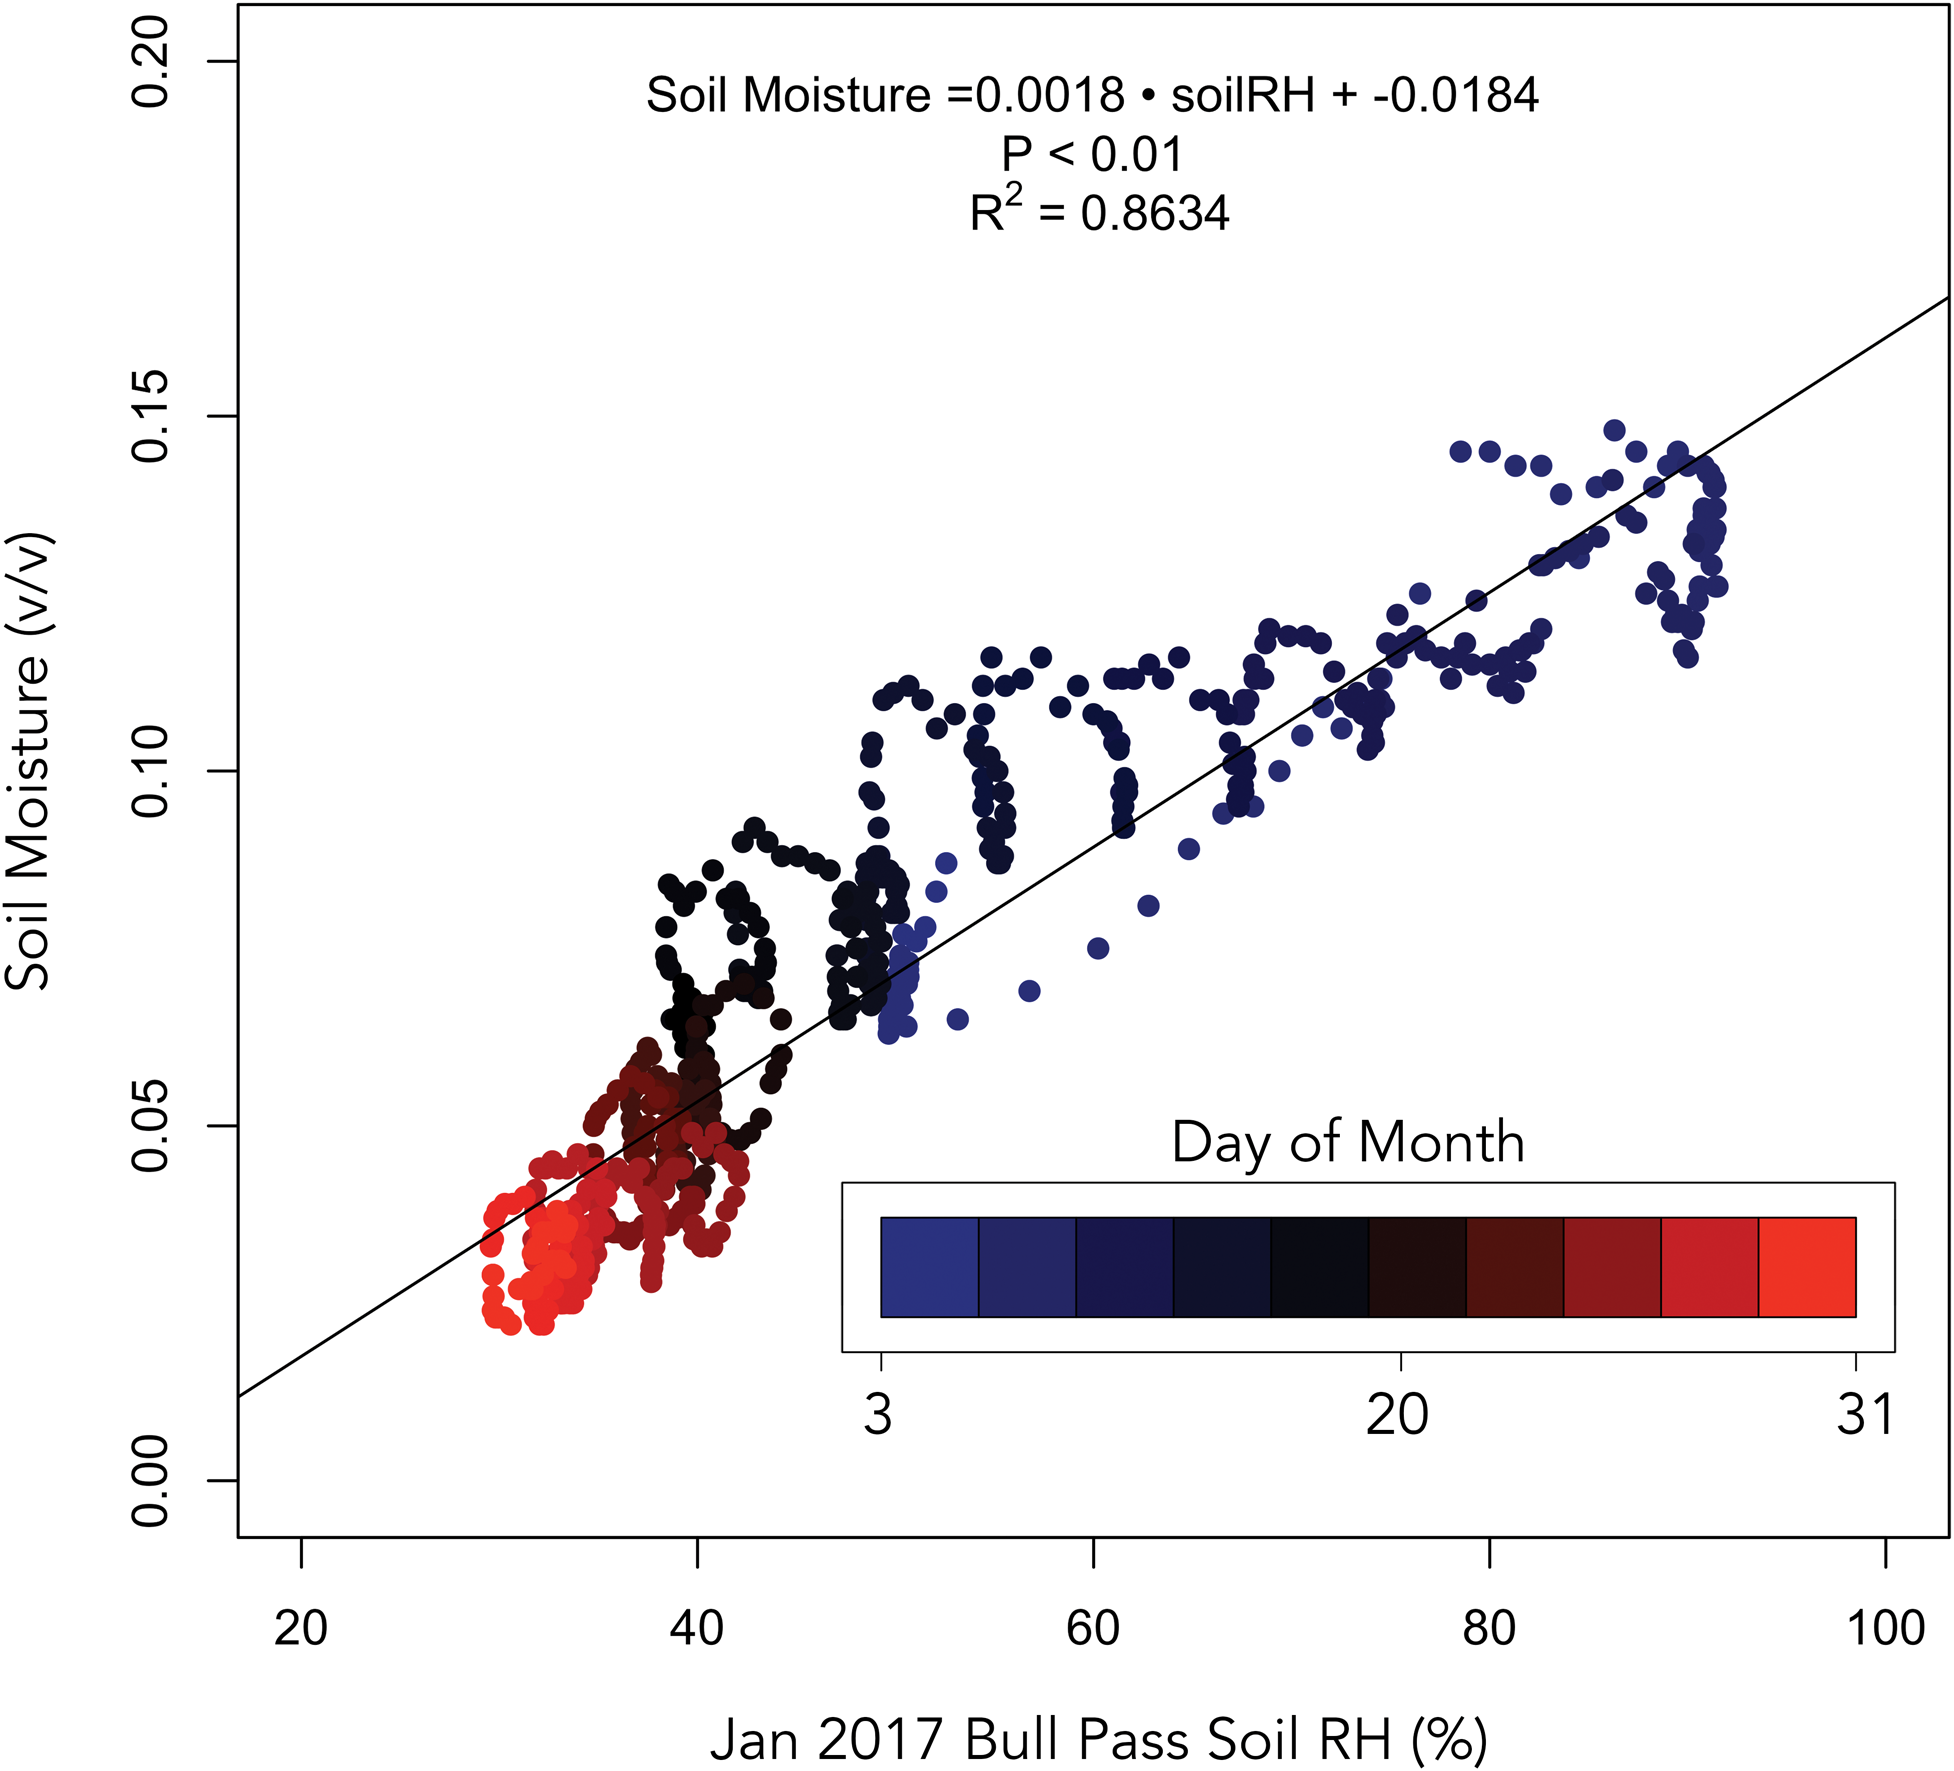
Fig. 8. Measured soil moisture (volume percent, or m3 water per m3 soil) vs soil relative humidity (RH) measured at the Bull Pass US Department of Agriculture Soil Climate Research Station. Soil moisture content and soil RH are strongly correlated during January 2017.
Importantly, snowfall and snowmelt are not implicated in the observed darkening events. During days of interest, no snowfall is measured that exceeds the ± 5 cm uncertainty of the sonic ranging instrument on the meteorological station (Fig. 6). The apparent change in snow height shown in Fig. 6 is below this uncertainty. Furthermore, apparent snow accumulation in the sonic ranger record (Fig. 6) is inconsistent with the measured reflectivity of the surface - reflectance decreases when the snow appears to be accumulating, which is inconsistent with the high albedo of fresh snow. A more probable explanation is that relative humidity is incompletely accounted for in the sonic ranger calibration and that increasing relative humidity and decreasing air density are providing an erroneous surface elevation change signal.
If albedo change at the Lake Bonney weather station results from the formation of soil porewater solutions, how much soil moisture might be involved? Time-resolving surface soil moisture measurements that could evaluate this albedo-based inference are rare in the MDV; however, field plans for 2022–2023 include the installation of soil moisture sensors at some MCM-LTER long-term weather stations (R.F. Brown & P. Doran, personal communication 2021). Such sensors could directly test the prediction that soil moisture anomalies develop in MDV soils during episodes of high relative humidity. This is especially true if soil moisture sensors include soil electrical conductivity measurements, which could be used to detect the growth of intergranular brine solutions at small spatial scales that might challenge soil moisture detection via time domain reflectometry (Wierzchos et al. Reference Wierzchos, Davila, Sánchez-Almazo, Hajnos, Swieboda and Ascaso2012).
Existing hyperspectral reflectance measurements of MDV soils provide one possible constraint on the magnitude of soil moisture growth that could be associated with these albedo reduction events. Taking into account the broad-band visible reflectance factors (equivalent to spectral reflectance or reflectivity per nanometre) that were determined for wetted and dried MDV soils under laboratory conditions (Levy et al. Reference Levy, Nolin, Fountain and Head2014), the ~28% reduction in reflectance observed in this study suggests that soils could be transitioning from dry conditions (reflectance of ~0.18 at < 0.5 wt.% water content) to surficial soil moisture contents of 2–3 wt.%. While this soil moisture content is small by the standards of saturated and unsaturated groundwater systems in the MDV (Cartwright & Harris Reference Cartwright, Harris and McGinnis1982, Gooseff et al. Reference Gooseff, McKnight, Runkel and Vaughn2003, Reference Gooseff, Barrett and Levy2013, Harris et al. Reference Harris, Carey, Lyons, Welch and Fountain2007, Levy et al. Reference Levy, Fountain, Gooseff, Welch and Lyons2011, Reference Levy, Fountain, Gooseff, Barrett, vanTreese and Welch2013), it is considerably greater than the < 0.5 wt.% soil moisture common to MDV soils that dominate interfluves in the MDV (Campbell et al. Reference Campbell, Claridge, Balks, Campbell, Lyons, Howard-Williams and Hawes1997). As noted in the previous subsection, this estimated soil moisture value should be considered a maximum.
Seasonal implications
How might soil porewater conditions change over the course of the summer and how might that impact the detectability of these pore solutions? It is notable that the soil relative humidity linear model reproduces background reflectivity (~0.18) as soil relative humidity approaches zero. In contrast, the linear model relating reflectivity to soil temperature does not have background reflectivity as its y-axis intercept- instead, it produces a median reflectance intercept of ~0.11 at the coldest measured soil temperatures. This makes intuitive sense because of the absence of possible mechanisms that could cause temperature change in soils to impact their reflectivity (with the possible exception of frost formation, which would both be recorded in the relative humidity data and would push reflectivity values higher at low soil temperatures, not lower as is observed). However, soil temperature analysis does provide a useful range of measured temperatures over which humidity-correlated albedo change occurs: -4°C to +8°C.
Taking -4°C to +8°C as the temperature range over which albedo change occurs, the meteorological station data can be re-filtered to determine when and for how long soils might be in their low-reflectivity, presumed dampened state. Soil relative humidity is > 50% and soil temperature is between -4°C and +8°C during 61% of January night-time measurement records. Across the full year of meteorological station observations, these temperature and relative humidity conditions persist in ~6% of all snow-free observations. Over the course of a year, potentially dampened conditions may be temporally extensive, summing to weeks per year of anomalously high soil moisture contents (Fig. 9).
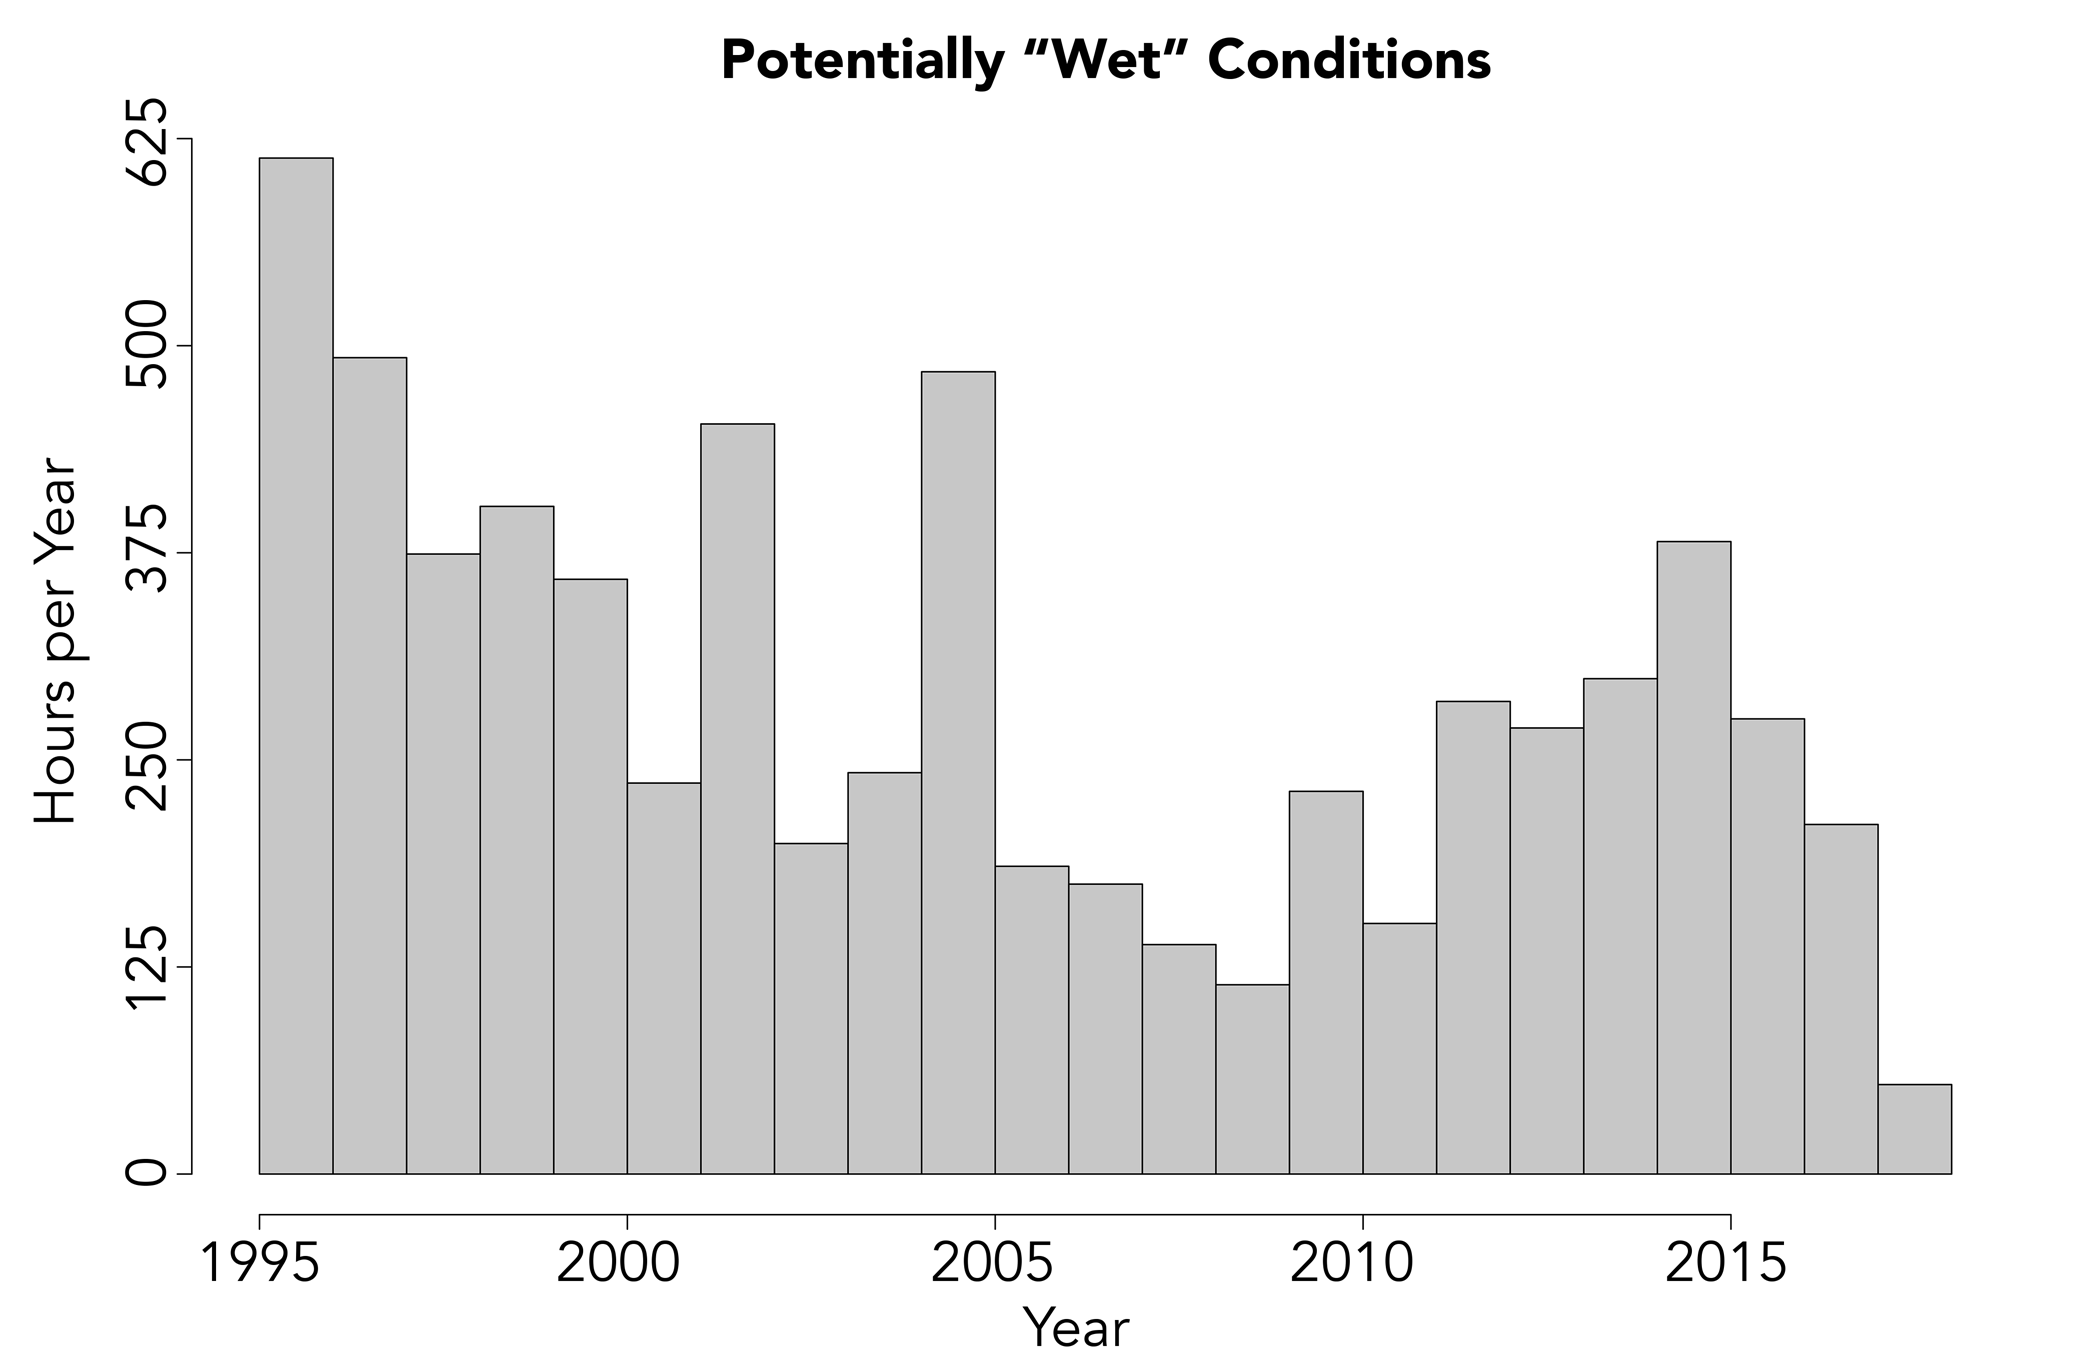
Fig. 9. Hours per year when potentially dampened/darkened soil conditions could occur based on Lake Bonney meteorological station 15 min readings filtered to include only those measurements for which temperature is between -4°C and +8°C and for which soil relative humidity is > 50%.
Are there other possible sources of water vapour that could be contributing to soil dampening and darkening? Water vapour fluxes are generally upwards in the MDV during summer, from subsurface permafrost and ground ice to the atmosphere, as buried ice warms and vapour pressure above the ground ice grows (Hagedorn et al. Reference Hagedorn, Sletten and Hallet2007), except for when snowfall reverses the vapour gradient (McKay Reference McKay2009, Kowalewski et al. Reference Kowalewski, Marchant, Head and Jackson2011). It is possible, then, that vapour flux from ice-cemented permafrost or from buried ground ice is contributing moisture to surface soils and altering their reflectivity. However, two lines of evidence argue against this being a dominant factor: 1) the rapidity with which reflectivity changes in response to relative humidity change (e.g. Fig. 1) suggests that atmospheric forcing rather than diffusive processes from beneath the soil surface is controlling the timing of reflectivity change, and 2) dry-frozen permafrost is present in the upper 70 cm of the soil column in the Lake Bonney basin, suggesting that most water has already been removed from near-surface soils at the sites were reflectivity anomalies are observed (Bockheim et al. Reference Bockheim, Prentice and McLeod2008).
Periods of atmospherically controlled soil moisture anomalies in the MDV could have regional consequences on biogeochemical processes operating in this cold desert ecosystem. Enhanced soil moisture conditions could enhance moisture availability to both microorganisms and soil invertebrates, expanding the duration of the summer during which both primary production and respiration could occur (Poage et al. Reference Poage, Barrett, Virginia and Wall2008). Soil wetting, particularly during shadowed night-time periods, could help make sense of anomalous night-time CO2 fluxes (Ball et al. Reference Ball, Virginia, Barrett, Parsons and Wall2009), as wet soils have small but positive CO2 fluxes that could be enhanced by soil dampening (Ball & Virginia Reference Ball and Virginia2015). Dampened soils could also alter the thermal state of MDV soils, increasing thermal diffusivity (Levy & Schmidt Reference Levy and Schmidt2016) or altering habitat suitability and organismal thermal stress (Wlostowski et al. Reference Wlostowski, Gooseff and Adams2018). Episodic soil wetting at the basin scale as shown in Fig. 1 and implied by the meteorological station data could provide intragranular thin films of water that could drive salt migration on MDV slopes (Wilson Reference Wilson1964, Dickinson & Rosen Reference Dickinson and Rosen2003), advecting solutes or driving grain-surface geochemical reactions such as ion exchange (Toner & Sletten Reference Toner and Sletten2013). Finally, episodic soil wetting could enhance clay swelling and/or freeze-thaw cycling that could promote soil cryoturbation and enhance the formation of inflated desert pavements in otherwise highly arid soils (Bockheim Reference Bockheim2010).
Given the potential for widespread soil moisture anomalies in the MDV triggered by high-humidity episodes to produce regional enhancement in soil moisture and the extreme water limitation known to limit biogeochemical processes, why might this process not have been widely described before now? One factor is that remote sensing observations of the MDV that could detect spatially widespread reflectivity reductions are limited to low-cloudiness to cloud-free observing conditions. If reflectivity reduction events are associated with high relative humidity and cloudy or overcast conditions, it is probable that they could not be observed by orbital sensors. A second factor could relate to the timing of the reflectivity anomalies. The meteorological conditions described above (soil relative humidity > 50% and soil temperature between -4°C and +8°C) associated with dampened soils occur overwhelmingly during late night and early morning time periods when soil surfaces are shadowed and soil relative humidity rises (Fig. 10). These are the times when most MDV field teams have returned to stations or camps and are not typically conducting sampling or observations. Taken together, this suggests that MDV soil processes may be occurring on episodic or diel timescales during which observation and sampling either cannot occur (due to cloud cover) or are not occurring (due to human factors). This constitutes a notable observational gap and strongly motivates regional, autonomous ground-based or aerial monitoring of soil moisture conditions.
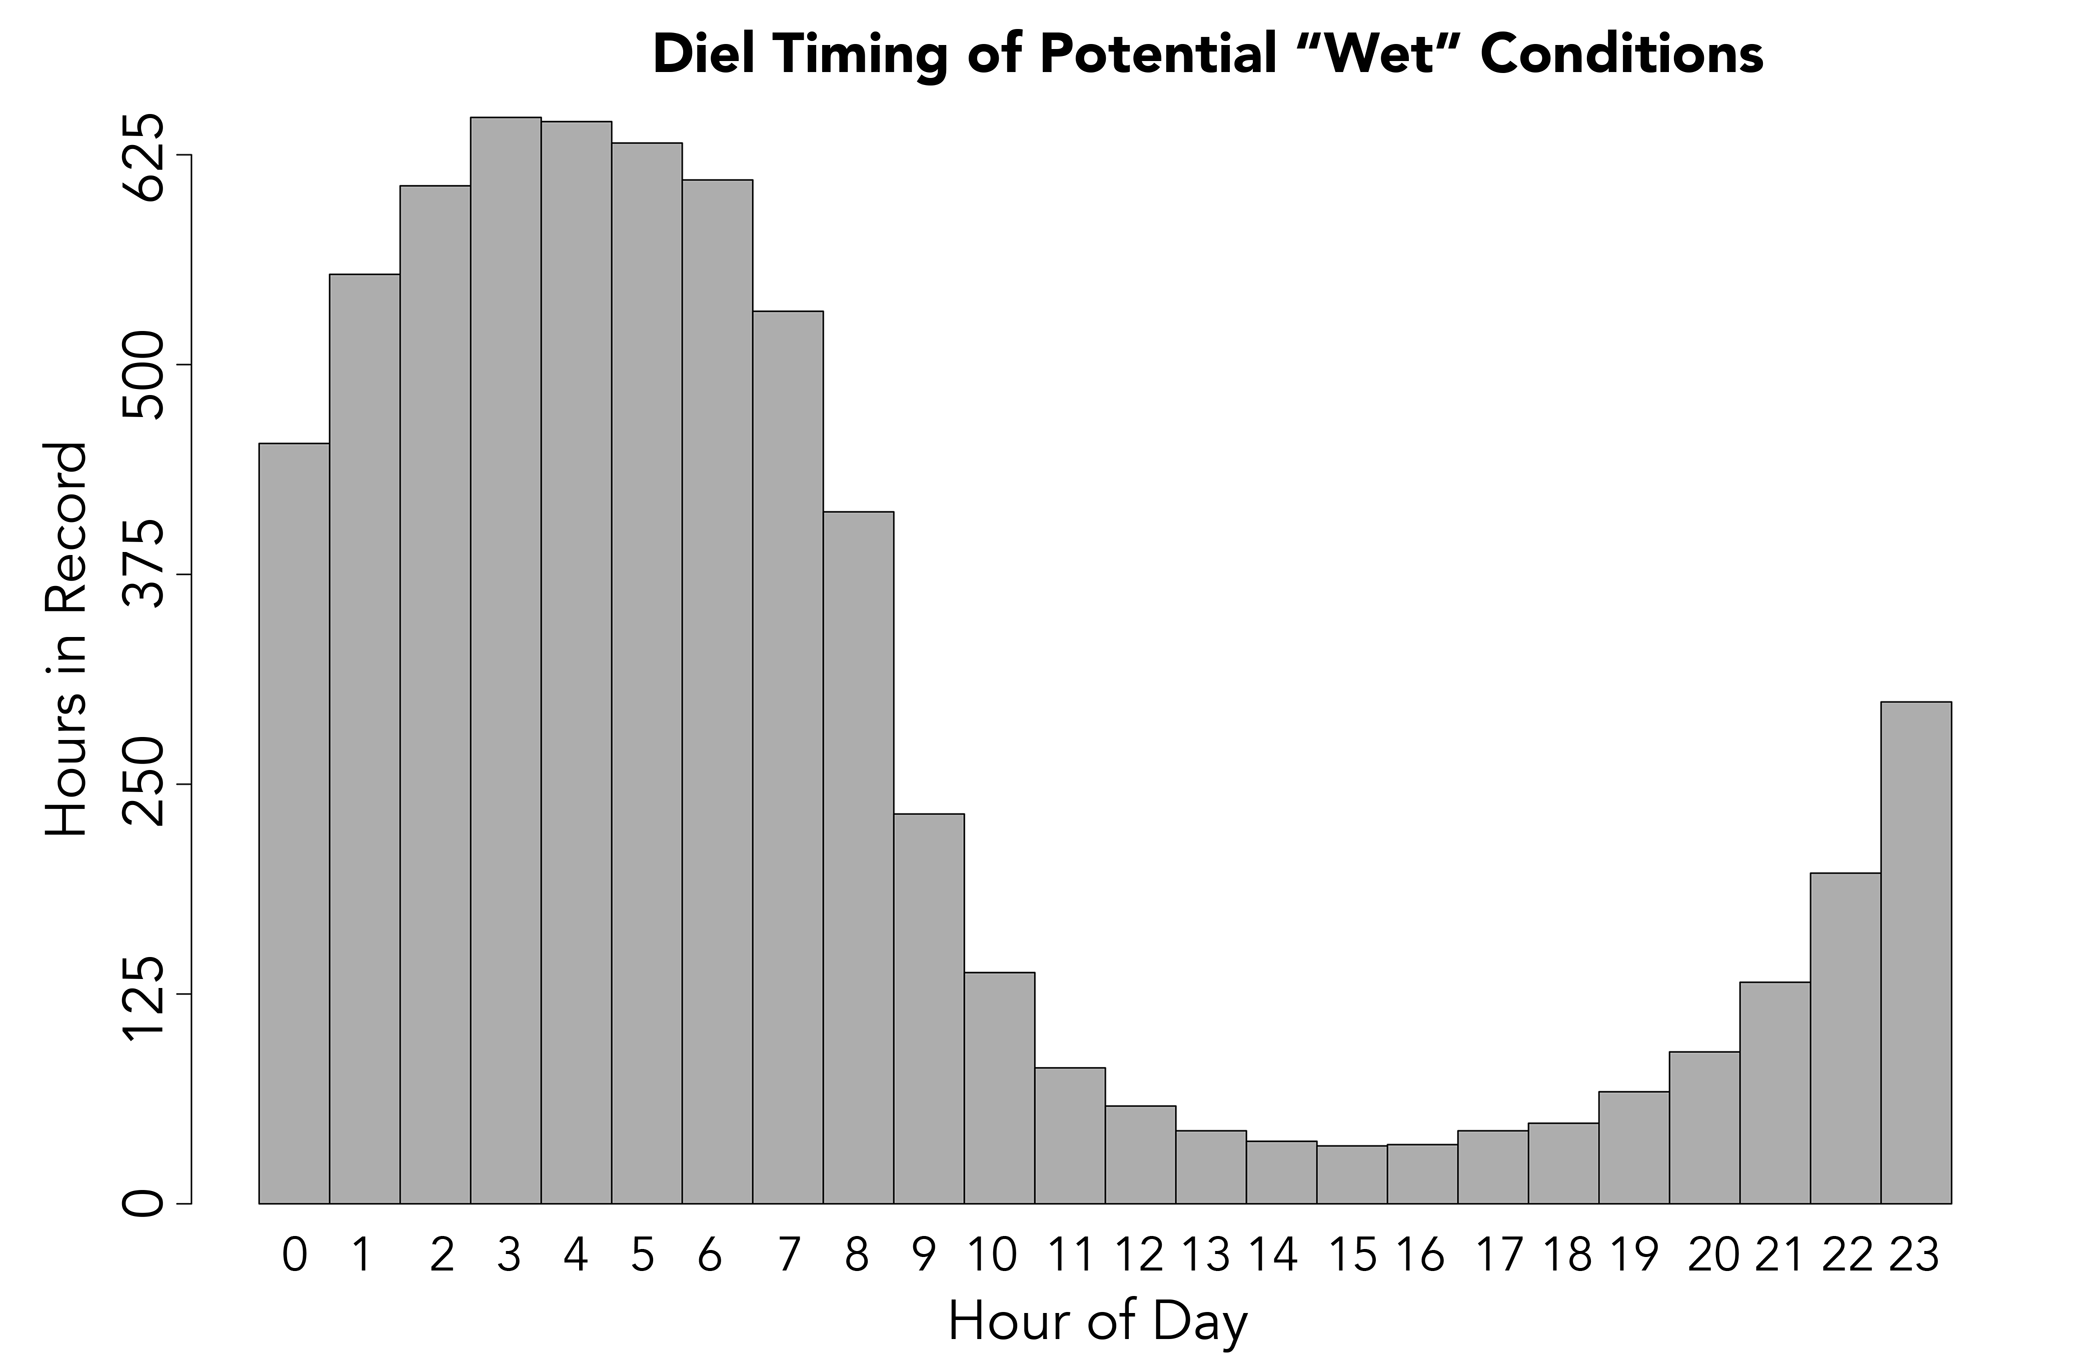
Fig. 10. Hours during the whole Lake Bonney instrumented record when potentially dampened/darkened soil conditions could occur based on Lake Bonney meteorological station 15 min readings filtered to include only those measurements for which temperature is between -4°C and +8°C and for which soil relative humidity is > 50%. Data are binned by the hour of the day during which potential wetting and darkening could occur.
Conclusions
Multi-year measurements made under conditions of diffuse illumination during night-time shadowing at Lake Bonney show a linear decrease in soil reflectivity that is strongly correlated with increased relative humidity. If this reflectivity signal results from the wetting of soils or growth of soil porewater solutions that are driven by atmospheric fluxes of water vapour into the soil surface, it could represent a hitherto undescribed source of regional soil moisture at the basin scale. Median reflectivity change (27.7% decrease) is consistent with darkening due to the wetting of soils from the MDV background value of < 0.5 wt.% to a maximum of 2–3 wt.%. Reflectivity change is observed during mid-summer (January) and is independent of solar elevation or zenith angle. Rapid reflectivity change occurs over quarter-hours to hours and is associated with increasing soil relative humidity. High-humidity, warm (-4°C to +8°C) conditions associated with reflectivity reductions are common during the summer (61% of records between 00h00 and 02h00 during January), but they also occur throughout the summer, providing hundreds of hours of potentially dampened conditions. These conditions occur mostly between 00h00 and 07h00 and commonly under cloudy conditions, which may have limited their detection or description in the past.
Acknowledgements
Thanks are given to the Soil Survey Staff, Natural Resources Conservation Service, United States Department of Agriculture, for access to Bull Pass Soil Climate Research Station data. Any opinions, findings and conclusions or recommendations expressed in this material are those of the author and do not necessarily reflect the views of the National Science Foundation. Special thanks to Andrew Fountain for discussion of the manuscript, as well as to Peter Doran and an anonymous reviewer for their insightful comments.
Financial support
This work was supported in part by National Science Foundation award ANT-1847067 to JL. MCM-LTER data cited in this manuscript were generated with the support of National Science Foundation Grant #OPP-1637708 for Long Term Ecological Research.
Author contributions
JL conceived of the project, conducted the data analysis and is responsible for writing of the manuscript.
Supplemental material
Twenty-three supplemental figures will be found at https://doi.org/10.1017/S0954102021000341.