Introduction
The grey notothen, Lepidonotothen squamifrons (Günther), is an endemic Southern Ocean species found around sub-Antarctic islands and seamounts in the Indian and Atlantic Ocean sectors (DeWitt et al. Reference DeWitt, Heemstra and Gon1990). It is a predominately benthic species, found on the shelf at depths < 570 m, although some individuals have been caught at depths of 700 m (DeWitt et al. Reference DeWitt, Heemstra and Gon1990). Permitin & Sazonov (Reference Permitin and Sazonov1974) identified the Indian Ocean and South Georgia populations of L. squamifrons as separate allopatric sub-species (L. squamifrons squamifrons and L. squamifrons atlantica, respectively) although subsequent molecular analysis has cast doubt on the validity of this distinction (Schneppenheim et al. Reference Schneppenheim, Kock, Duhamel and Janssen1994). There are, however, biological differences between the geographically separated populations, at Kerguelen the oldest fish are an estimated 19 years old and reach 52 cm total length (TL), whereas at Crozet they show a slower growth rate with a maximum estimated age of 12 years and maximum length of 30 cm TL (Duhamel & Ozouf-Costaz Reference Duhamel and Ozouf-Costaz1985). At South Georgia the maximum size recorded has been 55 cm TL at an estimated age of 14–15 years (Shust & Pinskaya Reference Shust and Pinskaya1978), with a faster growth rate than at Kerguelen (DeWitt et al. Reference DeWitt, Heemstra and Gon1990).
Studies have shown that the grey notothen has a diverse diet dominated by benthic invertebrates, including salps/tunicates, crustaceans, cnidarians and ctenophores, with small fish also being important prey items (Duhamel & Hureau Reference Duhamel and Hureau1985, McKenna Reference McKenna1991, Pakhomov Reference Pakhomov1993). The remains of L. squamifrons have been identified in the stomach contents of a range of higher predators, including South Georgia shags (Phalacrocorax georgianus Lönnberg; Casaux & Ramon Reference Casaux and Ramon2002), Patagonian toothfish (Dissostichus eleginoides Smitt; Pilling et al. Reference Pilling, Purves, Daw, Agnew and Xavier2001), black-browed albatross (Diomedea melanophrys Temminck; Cherel et al. Reference Cherel, Wiemerskirch and Trouvé2000), Antarctic fur seals (Arctocephalus gazella Peters; Green et al. Reference Green, Slip and Moore1998), southern elephant seals (Mirounga leonina L.; Green et al. Reference Green, Slip and Moore1998), gentoo penguins (Pygoscelis papua, Forster; Adams & Klages Reference Adams and Klages1989) and even sleeper sharks (Somniosus antarcticus Whitley; Cherel & Duhamel Reference Cherel and Duhamel2004).
Commercial fishing has targeted both the Atlantic and Indian Ocean populations of L. squamifrons, but with differing levels of exploitation in the two regions. The grey notothen was of low commercial importance around South Georgia and Shag Rocks from the late 1960s with 14 456 tonnes caught between 1969–70 and 1989–90, compared to 239 001 tonnes caught in the Indian Ocean sector over the same period (Kock Reference Kock1992). Due to the rapid decline in catches, the CCAMLR (Commission for the Conservation of Antarctic Marine Living Resources) introduced a prohibition of directed commercial fishing for L. squamifrons at South Georgia in 1989 (CCAMLR 1989, Kock Reference Kock1992). The following ban on all commercial bottom trawling in the region, implemented by CCAMLR in 1989, and the subsequent change to pelagic trawling for mackerel icefish (Champsocephalus gunnari Lönnberg; CCAMLR 1990) alleviated the issue of bycatch of L. squamifrons (CCAMLR 2012). The only substantial recorded catches of L. squamifrons at South Georgia since 1990 have been those taken by the annual groundfish research survey which has continued to use a bottom trawl (CCAMLR 2011).
This study uses data from the past twenty demersal groundfish surveys at South Georgia and Shag Rocks to investigate distribution, biomass, interannual variability in abundance, length, weight and growth parameters, maturity, and diet of L. squamifrons to gain a greater understanding of the ecology of this species and the role it plays within the South Georgia ecosystem.
Materials and methods
Sample collection
Data from twenty demersal trawl surveys conducted on the continental shelf of South Georgia and Shag Rocks (sub-Antarctic, 54°S, 37°W; Fig. 1) since 1986 were used in the study (Table I). The main objective of the ongoing surveys is to provide biomass estimates of a key commercial species (C. gunnari) but they also provide information on the abundance and ecology of the other demersal fish species found on the South Georgia and Shag Rocks shelf. Surveys have primarily taken place during the summer (November–April) with the exception of 1997 and 2007 when they took place during the winter (August–September). Extensive spatial coverage of the shelf area around South Georgia and Shag Rocks has been maintained, although no hauls were conducted at Shag Rocks during the 1989 survey and the 2012 survey was restricted to the Shag Rocks shelf only. Each survey (except 2003) followed a random design, stratified by depth and region trawling for 30 minutes bottom time at a speed of approximately 4 knots using a commercial size otter trawl (Everson et al. Reference Everson, Parkes, Kock and Boyd1999) with a 18 m opening and 40 mm cod end mesh liner. In 2003, a radial transect design was used to survey depths from 100–900 m (Collins et al. Reference Collins, Allcock and Belchier2004).

Fig. 1 Map of the south-west Atlantic and Scotia Sea showing location of South Georgia.
Table I Details of the twenty demersal trawl groundfish surveys carried out at Shag Rocks and South Georgia between 1986 and 2012.

Catch processing
Catches were sorted into individual species and a total weight for each recorded. Length frequency measurements were taken on all L. squamifrons (TL to the nearest cm below) and, when time allowed, additional biological data for individual fish were collected including total and gutted weight (g), sex and maturity stage (assessed using a the five-point scale of Kock & Kellermann Reference Kock and Kellermann1991). Stomachs were collected for dietary analysis from sub-samples of the catch in seven surveys (2005–09, 2011 and 2012). Stomach fullness was assessed subjectively prior to removal and recorded on a scale of 0 to 4, where 0 = empty, 1 = ≤25% full, 2 = 25–50% full, 3 = 51–75% full, and 4 = ≥75% full. Stomachs were then placed in ‘zip-lock’ bags and frozen at -20°C for subsequent analysis at the King Edward Point Research Station laboratory on South Georgia.
Diet analysis
Defrosted stomachs were weighed (to the nearest 0.01 g), the contents removed and a total content weight recorded. The stomach contents were separated into different species or species groups and identified to the lowest possible taxonomic level using published guides (i.e. Gon & Heemstra Reference Gon and Heemstra1990, Reid Reference Reid1996, Boltovskoy Reference Boltovskoy1999) and highly digested fish were identified using sagittal otoliths. Prey items were counted, weighed and the digestion state subjectively assessed and recorded on a scale from 1 to 4, with 1 being fresh showing no signs of digestion.
Diet analysis was conducted by calculating percent mass (%M), percent number (%N) and percent frequency of occurrence (%F) of each prey item and the percentage index of relative importance (%IRI, Cortes Reference Cortes1997) where:
 $$\% IR{{I}_i}\, = \,\frac{{\left( {\% {{N}_i}\, + \,\% {{M}_i}} \right)\,\times \,\% F}_i}{{\mathop{\sum}\nolimits_{i\, = \,1}^n {\left( {\% {{N}_i}\, + \,\% {{M}_i}} \right)\,\times \,\% F_i} }}\,\times \,{\rm{100}}\eqno\rm$$
Prey items that contributed < 1%IRI to the diet were then grouped by phylum, and a final group (‘other’) was used to categorize unidentified and non-food items, seaweed and birds (penguin feet). The %IRI of each group, in addition to those prey that contributed > 1%IRI to the diet, were then used to compare interannual, regional, ontogenetic and depth effects on diet. Where highly digested salps/tunicates were present, individual numbers (required for %IRI calculations) were estimated using the mean weight of individuals of undigested specimens.
Data analysis
Catch locations of L. squamifrons during the twenty groundfish surveys, 1986–2012 were plotted using ArcGIS. Catch per unit effort (CPUE) data were Log (Ln) transformed in order to stabilize variance and to aid visualization. Differences in transformed standardized CPUE (kg 30 min-1) were assessed between regions and depth strata using the GLM routine in Minitab (Minitab 16 Statistical Software 2010, State College, PA: Minitab, Inc., www.minitab.com). Plots of catch-weighted length frequency data for annual surveys from 2002 enabled a visualization of length cohort composition and assessment of length composition differences between South Georgia and Shag Rocks. A logistic curve was fitted to the cumulative frequency of individuals of maturity stage 3 or greater to estimate Lm50 for both sexes (i.e. the length at which 50% of the population spawns for the first time) using the logistic equation (see Ni & Sandeman Reference Ni and Sandeman1984):
 $$p\, = \,{{({\rm{1}}\, + \,{{e}^{(\alpha + \beta L)}} )}^{{\rm{ {\hbox{-}} 1}}}}, \eqno\rm$$
where p is the estimated proportion of fish in a category, L is the total length, and α and β are coefficients.
Results
Distribution and abundance
Lepidonotothen squamifrons were widely distributed across the Shag Rocks and South Georgia shelf region (Fig. 2). Frequency of occurrence varied considerably between areas. At Shag Rocks they were caught in 41% of hauls but less frequently (20–29%) in hauls within the four South Georgia area strata (north-west, north-east, south-east, south-west; Fig. 2). Catch rates were highly variable with the greatest catches occurring to the east of the Shag Rocks shelf and to the west and south-west of the South Georgia shelf (Fig. 2). Fish distribution was highly aggregated with over 90% of total catch (by weight) taken in less than 1% of hauls. Of catches over 200 kg, 90% were taken at the eastern end of Shag Rocks or on the south-west of the South Georgia shelf. When sporadic high catches (> 200 kg per haul) were excluded from analyses the highest CPUE was still recorded at Shag Rocks.

Fig. 2 Catches of L. squamifrons on the South Georgia and Shag Rocks shelves from demersal trawl surveys between 1986 and 2012. Crosses indicate hauls with zero catch. The 200 m (solid line) and 1000 m (dashed line) isobaths are shown.
An analysis of CPUE over time (Fig. 3) indicated that within all regions there was considerable interannual variability in fish density throughout the 25-year study period. However, at Shag Rocks and the two easterly sectors of the South Georgia shelf there had been no significant overall change in CPUE over this period, although a non-significant increase in CPUE was evident at both Shag Rocks and on the south-east shelf. In contrast, a weakly significant increase in standardized CPUE was seen on the north-west shelf of South Georgia (F 1,16 = 4.84, P = 0.043, ANOVA) whilst a significant decrease in CPUE was observed on the south-west shelf of South Georgia (F 1,16 = 6.05, P = 0.026, ANOVA) with very low fish density recorded in the four most recent surveys.

Fig. 3 Plots of standardized mean CPUE (Ln kg 30 min-1) over time (1988–2011) for the five area strata at South Georgia and Shag Rocks.
A regional analysis of CPUE with depth indicates that in all areas of the shelf L. squamifrons are rarely caught at depths < 200 m (Fig. 4). At Shag Rocks there is a rapid increase in CPUE at depths > 220 m, reaching a peak at 250 m but remaining high to depths > 400 m. In all of the South Georgia areas, CPUE increased at depths > 250 m and appeared to be increasing at the maximum depths that were sampled during the surveys.

Fig. 4 Plots of the standardized mean CPUE (Ln kg 30 min-1) with depth within the five area strata at South Georgia and Shag Rocks.
Length, weight and growth parameters
A total of 5901 L. squamifrons were measured over the twenty surveys, with TL ranging from 6–50 cm. Not all measured fish were sexed. However, the 1116 males ranged from 8–47 cm, with a mean length of 26.2 cm and mode of 25 cm, and the 1496 females ranged from 9–47 cm, with a mean length of 27.9 cm and mode of 26 cm. Length frequency data derived from consecutive surveys from 2002 onwards (Fig. 5) shows polymodal length distributions that vary considerably between area strata and year. The length composition of the fish surveyed at Shag Rocks was often very different from that seen at South Georgia. In the 2003, 2005 and 2007 data, the length distribution was dominated by fish > 30 cm at South Georgia with far fewer large fish seen at Shag Rocks where a greater range of lengths was observed. There was little evidence of modal progression of discreet cohorts between years. The apparently anomalous length frequency distribution observed in 2006 at Shag Rocks (with large numbers of fish > 40 cm in length) was obtained predominantly from a single large haul of L. squamifrons (4255 kg) that accounted for 87% of the total survey catch of the species. The length:weight relationship pooled for males and females for L. squamifrons is shown in Fig. 6.

Fig. 5 Catch-weighted length frequency distributions of L. squamifrons caught during surveys at South Georgia and Shag Rocks between 2002 and 2011.

Fig. 6 Plot of fish weight against total length for pooled male and female L. squamifrons at South Georgia and Shag Rocks. The fitted line shows W = aLb where a = 0.0036 and b = 3.3551. R2 = 0.98, n = 851.
Maturity
The maturity stage of 1087 males and 1462 females was assessed, and while the majority of fish caught were immature (83% were either stage 1 or 2), a higher proportion of females had reached maturity compared to males (Table II). Regional variation in the relative maturity stages was also evident with larger, mature fish (stages 3–5) being predominately found in the western areas of South Georgia and at Shag Rocks, with no large, mature fish found in the south-east region (Fig. 7). In the western sectors of the South Georgia shelf, there was a considerable bias towards females in catches of fish > 35 cm TL (Fig. 7). No consistent temporal pattern of spawning was observed (Table III) with immature and developing fish dominating the population in all seasons during which a survey took place. However, small numbers of spawning and ‘spent’ fish (stage 4 and 5, respectively) were present in the summer surveys (January and February) and were not seen during the winter or spring surveys (April and September), although sample sizes from these months were considerably smaller. The length at sexual maturity based on Lm50 for both sexes of L. squamifrons derived from the logistic curve fit to maturity data was very similar (37 cm for females, 38 cm for males), approximately 75% of their maximum TL. Sample sizes were too small to assess changes of Lm50 over time.
Table II Maturity stages of male and female L. squamifrons caught on surveys at South Georgia and Shag Rocks from 1987–2012.
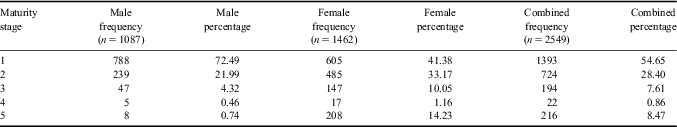

Fig. 7 Regional variation in maturity stage and length frequency of male and female L. squamifrons from groundfish surveys 1987–2012 (maturity plots: grey = stage 1–2, black = stages 3–5; length–frequency plots: solid line = females, dotted line = males).
Table III Maturity stages of male and female L. squamifrons based on month of survey.
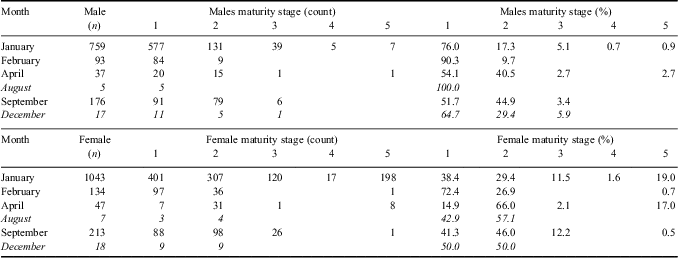
Italicized data highlights months with small sample sizes.
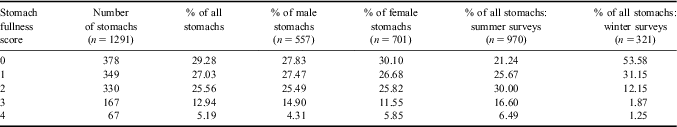
Stomach content analysis
The fullness of 1291 L. squamifrons stomachs taken from 17 of the 20 surveys was assessed (excluding 1986, 1987 and 2010). The majority of stomachs (81.87%) were < 50% full, with the highest proportion of stomachs (29.28%) being empty (Table IV). Both sexes showed similar proportions of stomach fullness (1258 sexed fish: 557 were males and 701 were females) (Table IV). A comparison between stomachs sampled from winter and summer surveys showed seasonal variation, with a much higher proportion of stomachs empty in winter compared to summer (53.58% and 21.24%, respectively) and a higher proportion of stomachs > 50% full in summer compared to winter (23.09% and 3.12%, respectively) (Table IV).
Table IV Stomach fullness scores for L. squamifrons sampled from groundfish surveys 1988–2012.

The contents of 417 full or partially full stomachs collected over seven surveys were examined (Table V). Stomachs were taken from fish 14–47 cm, representative of the size range caught during the surveys (181 male, 215 female).
Table V Diet composition of L. squamifrons collected around South Georgia and Shag Rocks 2005–2012 expressed as percentage index of relative importance (%IRI).

S = summer survey, W = winter survey.
Italicized data (2009 and 2011) highlights years with small sample sizes.
A highly diverse diet was observed with 91 prey types recorded (34 identified to species level, 19 to genus, seven to family, 29 to order or higher, and two to non-food). The maximum recorded prey diversity in an individual stomach occurred in a sample from 2006 where one stomach contained nine different prey items including euphausiidae, tunicate, polychaete, three species of fish, and three species of hyperiid amphipod all in digestion stage 1 or 2.
The %IRI showed that amphipods, euphausiids, fish, fish eggs, polychaetes and salps/tunicates each contributed > 1%IRI to the diet. All other prey were then categorized by phylum or as ‘other’ for further comparative analysis (Tables V & VI).
The %IRI identified salps/tunicates as the most important prey group in four of the seven years analysed (2005, 2006, 2009 and 2012), while in 2007 and 2011 euphausiidae were the primary prey, and in 2008 amphipods were the principal diet component, although only a relatively small number of stomachs were analysed in 2009 and 2011 (Table V). Males and females show a similar prey composition with salp/tunicate dominating the diet, with amphipods and euphausiids as the main secondary prey items. However, there are differences in the proportional representation with salps/tunicates showing a greater level of importance in female diet compared to males (75.39%IRI compared to 59.39%IRI, respectively) (Table V).
Regional variation in L. squamifrons prey composition was evident with salps/tunicates dominating the diet at Shag Rocks (80.02%IRI), whereas at South Georgia euphausiids and amphipods were of highest importance (43.71%IRI and 29.38%IRI, respectively) with salps a minor prey at 2.17%IRI (Table V). Seasonal variation was also apparent with a decrease in the importance of salps and a concurrent increase in the importance of euphausiids and amphipods in the diet in the two winter surveys carried out in 2007 and 2008 (Table V).
Further analysis of stomach contents showed differences in diet composition when comparing small (< 25 cm) and large (> 25 cm) fish, and between fish caught in different depth strata (< 350 m and > 350 m) (Table VI). The order of relative importance of prey type was the same for fish of both size classes (salps followed by amphipods and then euphausiids). However, the proportion of each within the diet was noticeably different with salps more prevalent in the diet of larger fish (Table VI). Salps also dominated the diet of fish caught in depths < 350 m, whereas in deeper water (> 350 m) a more diverse diet was observed where the relative importance of a range of different prey types increased and salps decreased (Table VI). Combining the factors of fish size and capture depth illustrated further differences in diet composition.
Table VI Diet composition of L. squamifrons based on fish length and depth strata around South Georgia and Shag Rocks 2005–2012 expressed as percentage Index of Relative Importance (%IRI).

Discussion
This study represents the first comprehensive assessment of the ecology of L. squamifrons at South Georgia and the first appraisal of the long-term interannual variability in distribution, abundance, trophic ecology and reproductive biology for the species within the Southern Ocean.
Lepidonotothen squamifrons were shown to have a wide distribution across the South Georgia and Shag Rocks shelf with consistent ‘hotspots’ where high catches were regularly obtained. These areas to the east of Shag Rocks and in two clusters at the edge of the shelf to the west of South Georgia, one to the north-west and one to the south-west were consistent over time. The patchy distribution of L. squamifrons has also remained consistent with time, with a single large haul (> 50% of total species catch weight) dominating the catch in eleven of the twenty surveys, and one or two combined hauls contributing > 90% of the total L. squamifrons catch weight in eight surveys. In contrast to the results observed in this study, three Russian surveys carried out in the late 1960s and early 1970s reported that L. squamifrons were more often found in the south-eastern and eastern parts of the shelf, but also off the north-west tip of the island (Shust & Pinskaya Reference Shust and Pinskaya1978). Verification of fishing locations, dates, gear types and catch rates for these surveys has not been possible so it remains uncertain whether this represents a geographical shift in species distribution, or is simply an artefact of sampling differences. Further study of these hotspot areas may help to determine why fish are aggregating in these regions, show whether they are feeding or spawning areas and whether local bathymetric or oceanographic features are providing advantageous conditions.
The highest mean CPUE of L. squamifrons in terms of depth of trawl occurred in 250–350 m, and six of the nine catches > 1000 kg occurred in this depth zone (the remaining three being at mean depths of 217 m, 232 m and 458 m). This is an intermediate depth compared to other notothens such as Patagonian toothfish (D. eleginoides) which can be found at depths down to 2000 m and the yellowfin notothen (Patagonotothen guntheri, Norman, 1937) which inhabits depths 120–250 m (DeWitt et al. Reference DeWitt, Heemstra and Gon1990).
The patchy distribution of L. squamifrons makes it difficult to derive reliable biomass estimates from the trawl survey data due to the large confidence intervals around any estimate. The same concern has been identified in another Southern Ocean notothen, the marbled rockcod Notothenia rossii (Richardson, 1844), where similar patterns of aggregation in small geographic areas violate the assumption that fish are evenly distributed leading to inaccurate estimates of biomass (Kock et al. Reference Kock, Belchier and Jones2004). In addition, the South Georgia groundfish surveys are largely restricted to depths of < 350 m. Our data indicated that peak abundance of the species, may in some regions of the shelf, actually occur at depths greater than those that are regularly sampled by the trawl survey. Consequently any estimate derived from the trawl survey data is likely to underestimate total fish biomass. We, therefore, used only CPUE data to assess changes in fish density in the strata sampled rather then make inferences about changes to absolute L. squamifrons biomass at South Georgia over time. Recently published estimates of L. squamifrons ‘swept area’ derived biomass at South Georgia based on the same groundfish survey data used in this study from 1987–2006 range from 286–28 030 tonnes (Kock et al. Reference Kock, Barrera-Oro, Belchier, Collins, Duhamel, Hanchet, Pshenichnov, Welsford and Williams2012). Such estimates should be viewed cautiously in light of the above concerns and it is felt that their use to provide reliable estimates of stock status is limited.
The length structure of the L. squamifrons caught during surveys varied both spatially and temporally with little evidence of consistent patterns over time. Multiple length cohorts were apparent within the survey data but it was rare that individual size cohorts could be tracked through time. Therefore, little new information on age and growth could be deduced from these data. The lack of clear cohort progression or separation could be a result of highly variable growth rates between years or multiple spawning events with years but these remain uncertain. Length frequency of haul by haul data may provide a better insight in future into size structuring of L. squamifrons at a higher spatial resolution.
Although age was not determined in the current study we calculate that at South Georgia sexual maturity (based on Lm50) is reached at 8 years of age (c. 37 cm TL) for both males and females based on age at length data of Shust & Pinskaya (Reference Shust and Pinskaya1978). Our estimates of length at maturity are very close to those derived for the Kerguelen stock (34–36 cm) made by Duhamel & Ozouf-Costaz (Reference Duhamel and Ozouf-Costaz1985). Maturity data indicate that limited spawning occurs during the mid-summer period during which the majority of survey effort has been carried out. The presence of substantial numbers of maturing fish in January over the Shag Rocks shelf and the western end of the South Georgia shelf suggest that these regions may be important for spawning and may be the reason for the observed aggregating behaviour. The sex ratio highly skewed to females observed over the north-west shelf in some survey years may indicate that aggregations occur as a result of spawning rather than as a result of food availability. Few large fish are found in the northern or eastern regions of the South Georgia shelf indicating that these regions may represent ‘nursery’ areas. Previous studies have indicated that L. squamifrons spawns in February at South Georgia but in October in the Indian Ocean (Duhamel & Ozouf-Costaz Reference Duhamel and Ozouf-Costaz1985). Although our data provided limited support for February spawning, a recent study of larval fish abundance at South Georgia has shown peak abundance of L. squamifrons larvae in a fjord on the the north coast of South Georgia between May–July (Belchier & Lawson Reference Belchier and Lawson2013). Assuming egg development times of 2–3 months (Duhamel & Ozouf-Costaz Reference Duhamel and Ozouf-Costaz1985), spawning would be estimated to occur in early autumn between February and April corroborating the earlier studies. Although there is evidence that L. squamifrons spawn in the fjords and bays of Kerguelen (Koubbi et al. Reference Koubbi, Duhamel and Hebert2000), we found no evidence that high abundances of maturing adults were located in the fjords of South Georgia during the survey period. The succession of larval cohorts observed at Kerguelen (Koubbi et al. Reference Koubbi, Duhamel and Hebert2000) suggest a protracted spawning period for the species in the Indian Ocean which could explain the large mix of maturity stages observed in the South Georgia study.
Lepidonotothen squamifrons are classified as benthic invertebrate feeders, with fish also contributing to the diet (Shust & Pinskaya Reference Shust and Pinskaya1978, Duhamel & Hureau Reference Duhamel and Hureau1985, McKenna Reference McKenna1991), although the underlying complexity was illustrated by Pakhomov (Reference Pakhomov1993) who reported how diet was influenced by location, season, fish age and depth on the Ob and Lena seamounts in the Indian Ocean. Data from the South Georgia groundfish surveys also indicates considerable dietary variability, and with a total of 91 prey types identified in stomach samples with up to nine different items in an individual stomach L. squamifrons demonstrates a flexible and highly opportunistic feeding strategy based on a diverse range of prey species.
Salps/tunicates dominate the diet during the summer and also in shallower water, whereas in winter and at depths > 350 m amphipods and euphausiids became important. Salps are known to be less tolerant of colder temperatures than other zooplankton such as krill (Nicol et al. Reference Nicol, Pauly, Bindoff, Wright, Thiele, Hosie, Srutton and Woehler2000, Pakhomov et al. Reference Pakhomov, Froneman and Perissinotto2002), and the shift in diet may reflect changing patterns of prey distribution related to changes in water temperature both seasonally and vertically throughout the water column. Regional differences in prey may reflect differing water temperatures in the area. The Antarctic Circumpolar Current brings cold water and Euphausia superba Dana up from the Antarctic Peninsula flowing in an anticlockwise direction around South Georgia (Orsi et al. Reference Orsi, Whitworth and Nowlin1995, Murphy et al. Reference Murphy, Watkins, Meredith, Ward and Thorpe2004) where euphausiids are the most important prey in the L. squamifrons diet. At Shag Rocks, the water temperature is slightly warmer than on the South Georgia shelf (Collins et al. Reference Collins, Ross, Belchier and Reid2007) which may explain why salps are the dominant prey item in this region.
The highest proportion of salps/tunicates observed in the diet was in 2009 where the %IRI was > 85%, this may reflect a high abundance of salps and a reduction of other prey items during the sampling period. In 2009, a strong ecosystem anomaly occurred at South Georgia with above average sea temperatures and a low krill biomass which led to severe impacts on krill-dependant predators (Hill et al. Reference Hill, Belchier, Collins, Fielding, Murphy, Trathan, Venables and Waluda2009). A survey carried out by the British Antarctic Survey to the south-west of South Georgia that year reported an unusually high density of salps with nets being clogged by the sheer volume of gelatinous organisms in the water column (Fielding, personal communication 2012). With an apparent shift in the Southern Ocean zooplankton balance where krill is declining and salps are increasing (Atkinson et al. Reference Atkinson, Siegel, Pakhomov and Rothery2004) and a trend of increasing sea temperature at South Georgia (Whitehouse et al. Reference Whitehouse, Meredith, Rothery, Atkinson, Ward and Korb2008) L. squamifrons, as a salp predator, could be one of a limited number of species that may benefit from oceanographic changes in the region.
Ontogenetic differences in L. squamifrons diet were also noted from groundfish survey data with juveniles (< 25 cm TL) exhibiting a more varied diet and a lower dependence on salps when compared to adults (> 25 cm TL). This conflicts with the pattern seen in the Indian Ocean by Pakhomov (Reference Pakhomov1993) who observed an increase in gelatinous prey with increasing fish size up to 25 cm, followed by a decline in fish > 25 cm.
Analysis of stomach fullness showed an increased proportion of empty and < 25% full stomachs in winter compared to samples collected during summer surveys. Pakhomov (Reference Pakhomov1993) also recorded that the greatest proportion of empty stomachs were found during the winter months in the Indian Ocean sector, and this likely reflects reduced prey availability during this period.
This study has enhanced our knowledge of L. squamifrons populations at South Georgia and Shag Rocks both in terms of distribution and biology. The new dietary data can be used to provide more reliable input into regional food web models many of which are currently under development (i.e. Hill et al. Reference Hill, Keeble, Atkinson and Murphy2012). A better understanding of the variability in the distribution of the species, including hotspot regions, should assist with the development of spatial planning such as the refinement of the recently declared South Georgia Marine Protected Areas (MPA). The last three decades have seen a huge reduction of fishing pressure on demersal notothen species such as L. squamifrons at South Georgia, but there has also been an unprecedented warming of the region over this period (Whitehouse et al. Reference Whitehouse, Meredith, Rothery, Atkinson, Ward and Korb2008). The impact of the krill fishery on the L. squamifrons population at South Georgia is currently thought to be very low but increasing krill fishing activity at South Georgia has the potential to impact on populations of fish bycatch species. In addition, populations of fish predators, such as Antarctic fur seals (A. gazella), have expanded dramatically (Staniland et al. Reference Staniland, Gales, Warren, Robinson, Goldsworthy and Casper2010) over the past three decades and, as they are known to feed on fish and krill, could adversely affect many of the populations of fish including L. squamifrons at South Georgia. Long-term studies on the ecology of the fish fauna of South Georgia such as this provide baseline data against which future changes and threats to fish populations can be more reliably assessed.
Acknowledgements
We would like to thank the captains, crews and scientists who have been involved in South Georgia and Shag Rocks trawl surveys since 1986. The first two surveys were undertaken as part of the US Antarctic Marine Living Resources Program, the third was a joint UK/Poland survey, and the remainder were carried out by the UK. Sample processing was carried out at the King Edward Point Applied Fisheries Laboratory, South Georgia. The research was funded by the Government of South Georgia and the South Sandwich Islands (GSGSSI). The comments of the reviewers are also gratefully acknowledged.