


Introduction
The Scotia Sea encompasses a broadly dispersed arc of islands from Shag Rocks and South Georgia that lie in close proximity to the Polar Front, to the south-easterly distributed South Sandwich Islands, the high latitude South Orkney Islands and more westerly South Shetland Islands lying near the Antarctic Peninsula. Due to the broad latitudinal range of the Scotia Sea, as well as the influence of two distinct hydrographic regimes, including the Antarctic Circumpolar Current in the north and Weddell Sea convergence in the south, the region encompasses both low- and high-Antarctic fish fauna. Taxonomic exploration of fish species in the Scotia Sea began as early as the 19th century, though studies until recently have been heavily biased towards species around South Georgia (reviewed in Kock & Jones Reference Kock and Jones2005). Commercial harvesting of fish in this region did not begin until 1977 but by the mid-1980s management of the resource was undertaken through The Convention on the Conservation of Antarctic Marine Living Resources (CCAMLR). Both research and fishing ventures have yielded in-depth survey data on the species composition of fish within the Scotia Sea. The majority of shelf species (77–92%), and indeed the greatest biomass (95% of all individuals) belong to the suborder Notothenioidei (Kock & Jones Reference Kock and Jones2005). This assemblage includes five families, all of which are well represented in the Scotia Sea: Nototheniidae, Channichthyidae, Harpagiferidae, Artedidraconidae and Bathydraconidae. However, we currently do not have a measure of the accuracy of species identifications using conventional morphological criteria.
Species identification is a major fisheries issue and has been targeted, for example, by the Food and Agriculture Organization (FAO) programme since the 1960s. Aggregate data from 1950–2002 shows that up to 33% of the fisheries catch failed to be identified to species (Lleonart et al. Reference Lleonart, Taconet and Lamboeuf2006). In fact, species resolution in capture fisheries statistics has been declining, apparently influenced by the imprecision in the statistics from south-east Asia (Lleonart et al. Reference Lleonart, Taconet and Lamboeuf2006). Indeed, the distribution of our taxonomic knowledge of fish is highly biased among taxa and regions of the globe. Whereas some regions benefit from centuries of research and catch statistics, leading to a solid taxonomic knowledge, other areas such as the Southern Ocean have only recently received commercial and/or scientific attention. The classification of taxonomically cryptic fish and fish products is of particular importance where sampling access is at a premium. There can be few more difficult or costly regions to access than the Southern Ocean and the opportunity to fish in these waters is further constrained by the fact that they are seasonally difficult to navigate and are also largely uncharted for depth and bottom features. Southern Ocean waters are thereby typically unworkable for many traditional fishing methods such as bottom trawling, thus limiting the amount of scientific data that can be collected.
Empirical support confirming the utility of DNA barcoding (Hebert et al. Reference Hebert, Cywinska, Ball and DeWaard2003) is amassing at a rapid rate for a wide range of organisms (Waugh Reference Waugh2007), and recent studies have shown that barcoding can identify a large variety of fish species (Steinke et al. Reference Steinke, Vences, Salzburger and Meyer2005, Ward et al. Reference Ward, Zemlak, Innes, Last and Hebert2005, Pegg et al. Reference Pegg, Sinclair, Briskey and Arpden2006). In the Ward et al. proof-of-concept study (2005) barcoding effectively discriminated between 207 species of Australian fish including 143 species of teleosts and 61 species of sharks and rays. Pegg et al. (Reference Pegg, Sinclair, Briskey and Arpden2006) subsequently confirmed the utility of barcoding to identify fish larvae from Australian waters. A suite of potential applications of DNA barcoding has been documented that can have important direct benefits for fish biology and fisheries research (Costa & Carvalho Reference Costa and Carvalho2007). In the Southern Ocean, a barcoding system would be invaluable for maximizing opportunistic sampling from dedicated science cruises as well as from industry such as the krill fisheries. Such increased sampling effort would undoubtedly lead to important information on the distribution and range shifts of known species as well as provide further measures of diversity for rare, cryptic or even novel taxa. A barcoding system based on authenticated adult specimens of Antarctic fish would also provide the means to identify fish during early developmental stages, including eggs or larvae, when they may be either morphologically uniform or, indeed, vastly different from the adult form. Such uncertainty in early stage developmental morphology remains a major limiting factor in identification of larval spawning locations, distribution and estimates of recruitment (see Richardson et al. Reference Richardson, Vanwye, Exum, Cowen and Crawford2007). The early juvenile stages of many species of nototheniids look remarkably similar and consequently many species are difficult to identify. Here, we examine the concordance between the morphological and molecular criteria (“DNA barcoding”, Hebert et al. Reference Hebert, Cywinska, Ball and DeWaard2003) of species delimitation in fishes from the Scotia Sea, thereby testing the utility of DNA barcodes as a screening tool to point out taxonomic ambiguities in Scotia Sea fish.
Methods
Sampling
Fish were collected from the Scotia Sea as part of a project focused on the relationship between gene flow and oceanography in two key notothenioids: Champsocephalus gunnari (Lönnberg) and Notothenia rossii (Richardson), 1844. Specimens were harvested as bycatch from rough ground bottom trawls deployed in near- or on-shelf waters between 90–300 m depth or from trammel nets set in near-shore waters. Sampling locations were selected in the vicinity of islands, and included Deception, King George, Elephant, South Orkney, South Sandwich, South Georgia and Shag Rocks (metadata including sampling sites are available in the project ‘Fish of Antarctic Scotia Sea’ in the Barcode of Life Data System: www.barcodinglife.org). Specimens were also collected opportunistically from survey work associated with sampling marine biodiversity across the shelf edge using both Agassiz trawls and an epibenthic sledge at 1500, 1000, and 200 m depths. Fish were identified during the sorting of the catch directly following trawl recovery. Morphological identification was assigned to the lowest possible taxonomic category, which, in the majority of cases, was to species level. In cases where the identity was not immediately apparent, specimens were stored at 4°C for up to 24 h until they could be identified (by A.W. North) using the dichotomous keys of Gon & Heemstra (Reference Gon and Heemstra1990), occasionally facilitated by use of a dissecting microscope to resolve finer features. On several occasions identification was hampered by ambiguous morphological features, poor specimen condition, or early developmental stage, and species identity was noted as tentative in the field notes. A sample of fin, tail or muscle was collected immediately after taxonomic identification and stored in 95% ethanol at -20°C.
DNA isolation, amplification and sequencing
DNA isolates were obtained using the Chelex dry release method (Hajibabaei et al. Reference Hajibabaei, DeWaard, Ivanova, Ratnasingham, Dooh, Kirk, Mackie and Hebert2005). A 10:1 mixture of Chelex buffer with Proteinase K (Sigma®) was prepared, and 110 μl of the mixture was placed in each well. A small sample of tissue from each specimen was put into the extraction mixture. Extraction plates were then incubated at 55°C for 14–16 hours and subsequently heated to 95°C for 20 min. Extraction plates were centrifuged at 1 000 rpm for 5 min immediately before setting up the polymerase chain reaction (PCR) reactions.
A 631–645 bp fragment of the cytochrome oxidase I (COI) gene was amplified following the fish DNA barcoding protocol developed by Ivanova et al. (Reference Ivanova, Zemlak, Hanner and Hebert2007), with some adjustments. We used either one of the primer cocktails COI-2 and COI-3 described therein. Each PCR had a total volume of 25 μl, consisting of 1x PCR buffer, 2.5 mM of MgCl2, 0.1 mM of dNTP, 0.25 U of Taq polymerase, 0.2 μM of each forward/reverse primer cocktail and 2 μL of DNA template. All PCR reagents were supplied by Promega®, except the primers which were from MWG Biotech®. The thermocycle profile for reactions using COI-2 was: 94°C for 1 min, five cycles of 94°C for 30 sec, 50°C for 40 sec, and 72°C for 1 min, followed by 35 cycles of 94°C for 30 sec, 54°C for 40 sec, and 72°C for 1 min, with a final extension at 72°C for 10 min. For PCR using COI-3 primer cocktails, it consisted of 94°C for 2 min, 35 cycles of 94°C for 30 sec, 52°C for 40 sec, and 72°C for 1 min, with a final extension at 72°C for 10 min.
A 652 bp fragment of the cytochrome b (cyt b) gene was also amplified where COI failed to resolve putative species. A protocol modified from Derome et al. (Reference Derome, Chen, Dettaï, Bonillo and Lecointre2002) was used (with primers CytbLeft CAT TTT GAG GCG CAA CTG TA, and CytbRight AGG GGG AAG AAG ATG AGG AA) and a thermocycle profile consisting of 94°C for 3 min, 35 cycles of 94°C for 30 sec, 55°C for 30 sec, and 72°C for 2 min, with a final extension at 72°C for 10 min.
Following amplification, PCR products were cleaned by incubation with 10 U Exonuclease I (New England Biolabs®) and 1 U Shrimp Alkaline Phosphate (Promega®) at 37°C for 1 hour, followed by heating at 80°C for 5 min. Samples were sequenced in both directions by Macrogen Inc (South Korea) using an Applied Biosystems® 3730 sequencer.
Data analyses
Bidirectional COI and cyt b sequences were individually edited and aligned in MEGA3 (Kumar et al. Reference Kumar, Tamura and Nei2004). Additional published bathydraconid and artedidraconid cyt b sequences obtained from GenBank were included in the dataset for subsequent analysis. We used Neighbour-joining (NJ) analysis implemented in MEGA3, and the Kimura two-parameter distance model, to build tree-type representations of the molecular divergences of COI and cyt b. All trees were subjected to 10000 bootstraps. The average values obtained for conspecific and congeneric divergences were applied in the calculation of the ‘taxonomic resolution ratio’ (TRR), which is defined as the quotient between congeneric divergences and conspecific divergences.
We applied a suite of analytical tools available in the Barcode of Life Data System (BOLD; Ratnasingham & Hebert Reference Ratnasingham and Hebert2007) to our data. They included the within-project Distance Summary (DS), Nearest Neighbour (NN), Test Assigned Identifications (TAI) and Identify Unknowns (IU), and also the BOLD Identification System (IDS) analyses. Briefly, the DS analysis performs an automated computation of pairwise divergences at different taxonomic levels. The NN analysis determines the within-project nearest neighbour for each specimen. The TAI tool tests ‘the validity of existing identifications with those generated by the IDS system’, while IU assigns identifications to specimens lacking prior species-level identification. In any of the identification tools the BOLD system employs a linear search to collate nearest neighbours from a global alignment of all reference sequences in the database, that is, sequences comprising species with a minimum of three representatives and a maximum conspecific divergence of 2% (further details can be found in Ratnasingham & Hebert (Reference Ratnasingham and Hebert2007) and at www.barcodinglife.org). Representative COI sequences for putative species generated in this study were also submitted to IDS to produce a NJ tree with the 100 nearest matches.
Two distinct DS were calculated for the whole of our dataset. The first (DS1) was an analysis of the data keeping the original taxonomic assignments. For the second distance summary (DS2), we identified independent molecular operational taxonomic units (MOTU, Blaxter Reference Blaxter2004) in our dataset. This approach allows the assignment of putative species clusters that emerge from the molecular divergence data, and hence enables the DS analysis to test species groupings under various molecular hypothesis scenarios. The MOTU were established by grouping specimens diverging less than 2% from their nearest neighbour under the same MOTU. We selected this empirical structuring based on previous work on COI divergences of fish species (Ward et al. Reference Ward, Zemlak, Innes, Last and Hebert2005, F.O. Costa et al. unpublished data), which show that > 95% of the within-species comparisons exhibit an average COI divergence value below 2%.
Results
Here we present barcode results for 34 putative species representing nine different families, including 27 species from four families of the Notothioidei (for each specimen, metadata, sequence traces and Genbank accession numbers (EU326313-EU326436) are available at the previously described BOLD site: www.barcodinglife.org). Notably, our sampling encompassed the eight most abundant fish species of the Scotia Sea (Kock & Jones Reference Kock and Jones2005), including: Gobionotothen gibberifrons (Lönnberg), Champsocephalus gunnari, Chaenocephalus aceratus (Lönnberg), Chaenocephalus rastrospinosus (DeWitt et Hureau), Pseudochaenichthys georgianus (Norman), Lepidonotothen larseni (Lönnberg), L. nudifrons (Lönnberg), and Notothenia coriiceps (Richardson). We also examined the influence of geographic variation on COI diversity for most species, sampling individuals from up to four different localities around the Scotia Arc. For each species, 1–12 representative individuals were analysed, yielding a total of 124 sequences. No insertions, deletions, stop codons or sequences indicative of NUMTs were observed, and BLAST analysis using GenBank confirmed the sequences to be fish COI.
Neighbour Joining Analyses
The separation of nine families was resolved by the NJ analysis, and generally well supported by bootstrap values that were on average c. 72% (Fig. 1). These families include the Bathydraconidae, Artedidraconidae, Channichthyidae, Nototheniidae, Myctophidae, Zoarcidae, Liparidae, Rajidae, and the Muraenolepididae. Certain species were not resolved by COI barcoding within the two families Bathydraconidae and Artedidraconidae. In contrast, in the Liparidae, deep divergences were found among individuals identified as Careproctus georgianus (Lönnberg) or Paraliparis thalaso sp., forming six discrete groupings (MOTUs #33–38). Identifying Careproctus and Paraliparis species is notoriously difficult using morphological data (I. Everson, personal communication 2006) and there is relatively little knowledge of species diversity in these families from the Southern Ocean. However, one careproctid (#305) was considered to be a misidentified specimen as it clustered with a Paraliparis sp. at the end of a deep topological divergence (MOTU #38) and in subsequent analyses matched other BOLD sequences for that genus. A further two specimens identified as Careproctus (MOTUs #34 and #37) were in a degraded condition when they were recovered from the net. It is believed that they were regurgitated by a highly stressed fish that had escaped the trawl after initial capture. The Agassiz trawl was fished at considerable depth (1000 m) with a slow retrieval haul, creating the potential for larger, more strongly swimming fish to escape after initial capture. The general body morphology and capture location led to these specimens being tentatively ascribed to Careproctus georgianus and our study confirms that they are of the family Liparidae. However, tree topology suggests that not only was morphological identification probably incorrect but that our liparid samples represent several different species and indeed, genera (see subsequent sections). Two additional cases of misclassification included 1) an individual ascribed to Trematomus scotti (Boulenger) (#085) that clustered definitively with T. bernacchii (Boulenger) and 2) an individual classified as Gobionotothen marionensis (Günther) (#339) that clustered with Lepidonotothen nudifrons. The latter specimen was an early juvenile and only tentatively identified to species level at capture. Because of the gross misidentification of C. georgianus (#305), T. scotti (#085), and G. marionensis (#339) they were removed from subsequent analyses.
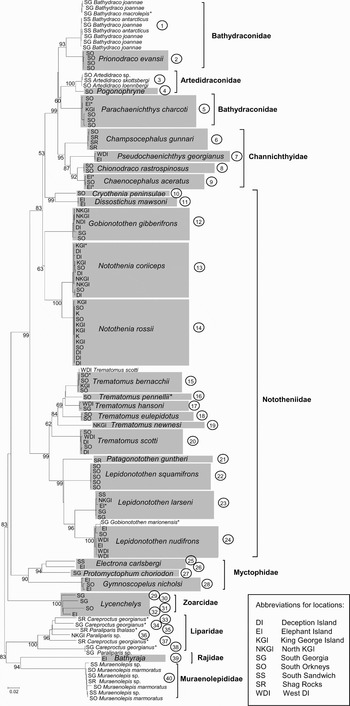
Fig. 1. Neighbour-joining tree based on COI barcode nucleotide distances (K2P) for ten families of Antarctic fish. Bootstrap values greater than 50 are shown near the respective branches. MOTUs (see Methods) are shown in open circles. * Indicates where morphological ID was tentative due to factors such as specimen quality or developmental stage.
Morphological identification of eleven other individuals, in addition to the Gobionotothen marionensis specimen, was sufficiently tentative for a note of uncertainty to be included in the field data sheets (these individuals are distinguished with an asterisk in Fig. 1). Taxonomic uncertainty sprang from a lack of distinguishing morphological features due to either 1) an early stage of development, 2) specimen degradation, or 3) intermediate and/or ambiguous morphological characteristics in adult fish. Although four additional individuals (including two Chaenocephalus aceratus, one Parachaenichthys charcoti (Vaillant), and one Lepidonotothen larseni) were at an early stage of development (juvenile), thereby introducing ambiguity in their taxonomic identification in the field, only G. marionensis appears to have been misclassified. A further nine adult fish were noted to have been ascribed tentative species-level classification, including Trematomus pennelli (Regan), T. bernacchii, Bathydraco macrolepis (Boulenger), Careproctus georgianus, Paraliparis thalasso bathyalis (Andriashev) and Notothenia coriiceps (Fig. 1). Field notes indicate for the latter specimen that we were unable to distinguish whether it was N. rossii or N. coriiceps, though barcoding confirmed it to be the latter. Our barcoding also confirmed that the T. bernacchii specimen was correctly identified. Further confirmation for the remaining specimens is impossible with the current dataset. Congruence of our tree topology with those generated for phylogenetic analysis of the trematomids (see Discussion), however, suggests that the identification of T. pennelli is probably correct. In contrast, our assignment of B. macrolepis appears most likely to be incorrect (see subsequent Results for cyt b).
Distance summary
The general discriminative ability of the COI dataset is illustrated by the considerably higher average within-genus divergences compared to mean within-species divergences for both distance summaries (ratios of 18 and 28 for DS1 and DS2 respectively, Table I). However, for DS1 the maximum within-species divergence (9.95%) is considerably higher than the minimum within-genus (0%). A detailed inspection of the pairwise distances indicates very high divergence values within Electrona carlsbergi (Taning) and Careproctus georgianus and absence, or very low level, of divergence among Bathydraco spp. and Artedidraco spp. The application of MOTU criteria (DS2) to our dataset identified 40 MOTU and lowered to 1.55% the maximum conspecific distance (within MOTU #40, putative Muraenolepis marmoratus (Günther)), and increased to 3.64% the minimum congeneric distance (Lycenchelys spp. MOTUs #31 and #32). The multi-species bathydraconid and artedidraconid clades represented single MOTUs, but the two specimens of Electrona were classified as separate MOTUs, and there were 4 MOTUs of Lycenchelys spp. and 5 MOTUs within Liparidae. For all remaining specimens the MOTUs coincided with the original species identifications. The resolution ability of COI thus increased substantially with DS2 (TRR 28), at the cost of reducing discriminative sensitivity in Bathydraco spp. and Artedidraco spp., but gaining discrimination power for 12 MOTUs, particularly for Electrona spp., and within the Zoarcidae and Liparidae.
Table I. Pairwise COI barcode nucleotide divergences for Scotia Sea fish and focal genera, using K2P distances (%).

aNumber of species with more than 1 sequence, and number of sequences analysed, reported within parenthesis.
bData reported as K2P distance ± SE.
cTRR = taxonomic resolution ratio (see Data analysis in Material and methods).
dAlso for 24 genera and 121 sequences; within-family, -order and -class values are the same as for DS1.
In the three focal genera analysed for conspecific versus congeneric divergences, TRR ranged from 28–31, indicating a discriminative capability equal to or above the global dataset average (Table I). In addition, in all three cases, there was no overlap between maximum conspecific divergences and minimum congeneric distances, therefore showing the robustness of COI barcodes for the unambiguous identification of species within the Nototheniidae family, including Lepidonotothen, Notothenia and Trematomus.
Comparisons with BOLD database
Using TAI analyses in BOLD, several “tight matches” with distances of 0.15–0.4%, were identified between COI sequences generated in this study and those previously lodged in BOLD. Such concordance confirmed species-level ID for Protomyctophum choriodon (Hulley) Gymnoscopelus nicholsi (Gilbert), and Electrona carlsbergi (Elephant Island specimen only). Furthermore, submission of our sequences to BOLD IDS produced a 100-nearest-matches tree that grouped our sequences for both Trematomus scotti and Champsocephalus gunnari with respective BOLD sequences for these species. Additional TAI and IU analyses produced both “loose” and “distant matches”, encompassing between 1–5% and 5–11% divergence respectively, providing confirmation of correct genus and/or family-level ID in our data. These included two loose matches for Lycenchelys (specifically, one specimen from South Georgia and one from Elephant Island) and Bathyraja, and distant matches for the two remaining Lycenchelys specimens, for three Muraenolepis individuals (including ones from South Sandwich Islands and South Georgia), and for all the Paraliparis spp. Analyses of sequences with BOLD IDS produced a 100-nearest-matches tree, grouping our sequences for Chionodraco, Careproctus (for only one specimen; the remaining three specimens clustered in unresolved clades of liparids), Trematomus, Patagonotothen, Lepidonotothen, Dissosticus, Artedidraco, and Bathydraco with matching BOLD sequences for these genera. Notably, our data for three species of Bathydraconid merged with three previously lodged sequences for B. macrolepis. NJ analyses failed to reveal any diagnostic molecular divergence between species or individuals in this family despite the composite database including our sequences and the three BOLD sequences, resulting in 11 individuals from three species.
Several additional mismatches were revealed by TAI analyses. One of our Electrona carlsbergi specimens (South Sandwich Islands) exhibited complete homology with a sequence for E. antarctica (Günther) previously lodged in BOLD. Furthermore, a short distance (0.31%) was found between our specimen of Patagonotothen guntheri Norman, 1937 and a BOLD sequence for P. tesselata (Richardson). Although generally considered a sub-Antarctic species (distributed along the coasts of Chile, Argentina and the Falkland Islands) there are two reports of P. tesselata from the region where our putative Patagonotothen sample was caught (between Shag Rocks and South Georgia; see www.fishbase.org). As no further P. guntheri specimens are available in our dataset or in BOLD we are not able to resolve this taxonomy further here.
Amongst the Liparidae the taxonomic divisions were less coherent. IDS analyses grouped only one of the careproctid species (MOTU #38; Fig. 1) with its congenerics lodged in BOLD. These were all specimens from the north Pacific and, indeed, TAI analysis indicates Careproctus furcellus (Gilbert et Burke) as the nearest neighbour for the C. georgianus sample with a distance of 5.86%. Two additional C. georgianus from the study (MOTUs #33 and #34) were nearest neighbours to Paraliparis pectoralis (Stein) specimens from north Pacific (distances of 2.36–6.44%) and trees depicting 100-nearest-matches analyses confirm that these specimens group most closely with a variety of Paraliparis spp. These IDS analyses also revealed that the majority of careproctid and paraliparid samples in the BOLD archive form multiple para-generic mixed clades. Consequently, in its currently incomplete form, the BOLD Liparidae archive cannot help resolve this taxonomy in the Antarctic.
Cytochrome b analysis for bathydraconids and artedidraconids
To address the lack of species-level resolution with COI within the Bathydraco and Artedidraco genera, we amplified a partial fragment of the cyt b gene. For the bathydraconids, cyt b was amplified in six of the nine COI-barcoded individuals, representing three different species: B. antarcticus (Günther) (n = 2), B. joannae (DeWitt) 1985 (n = 3) and B. macrolepis (Boulenger) (n = 1; although a degree of uncertainty in taxonomic classification was expressed in the field notes for this specimen). The cyt b gene was also amplified and sequenced from three barcoded artedidraconid individuals, representing at least two different species including A. skottsbergi and A. loennbergi.
A bootstrapped NJ tree, with additional sequences from GenBank for Artedidraco mirus (Lönnberg), A. skottsbergi (Lönnberg), Bathydraco macrolepis and B. marri (Norman), showed clear separation between families, but failed to discriminate between species (Fig. 2a). Pairwise distance calculations using the Kimura 2-parameter substitution model revealed values for the artedidraconids ranging from 0–0.06%, with a within-genus mean of 0.03% ± 0.01. For the bathydraconids the range was 0–0.03%, with an average of 0.02% ± 0.003 for within-genus divergence. For the artedidraconids this mean was highly skewed by comparison with the GenBank sequence for A. mirus. Distances between the species sampled in our study were all 0.01%. Average interspecific distances for B. antarcticus and B. joannae was also 0.01%, suggesting that the distance of 0.03% observed between our B. macrolepis and the GenBank sequence lodged for this species may be due to morphological misclassification.
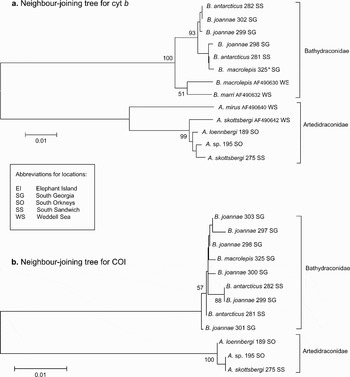
Fig. 2. Neighbour-joining trees based on nucleotide distances (K2P) for Artedidraco and Bathydraco genera. a. Tree based on cyt b sequences from the current study and from GenBank. b. Tree based on COI sequences from the current study. Sequences taken from GenBank are listed with their accession numbers. Bootstrap values greater than 50 are shown near the respective branches.
A NJ tree for COI produced similar topology, with some individuals exhibiting identical clustering to that seen with cyt b (Fig. 2b). COI distance values for the artedidraconids ranged from 0–0.15% with a mean of 0.1%, whereas values for bathydraconids ranged from 0–0.51% with a mean of 0.26%.
Discussion
The goal of using barcoding to discriminate among species was met for nearly all the fish families that were sampled from the Scotia Sea. In one instance, apparent failure of the barcoding system occurred when both COI and cyt b markers failed to discriminate between species within the Bathydraco and Artedidraco genera. This may reflect shared haplotypes possibly representing previous introgressive hybridisation between species with overlapping ranges. It may also indicate some degree of misidentification in the field, though morphological discrimination between species is considered straightforward (I. Everson, personal communication 2006). Derome et al. (Reference Derome, Chen, Dettaï, Bonillo and Lecointre2002) present a multi-gene analysis indicating rapid diversification over a very short time span for lineages/subfamilies of the bathydraconids. A high degree and rapid rate of diversification, possibly via sympatric or microvariant speciation, is also proposed for the artedidraconids (Bargelloni et al. Reference Bargelloni, Marcato, Zane and Patarnello2000a). Our findings of high sequence homology across species for both COI and cyt b genes are congruent with these scenarios. Indeed, one of the key concerns raised against barcoding is that DNA sequence variation in COI may not be detectable for very closely related and/or recently diverged species (Hickerson et al. Reference Hickerson, Meyer and Moritiz2006, Mallet & Willmot Reference Mallet and Willmot2003); our data may be indicative of such a case and clearly a different marker system needs to be explored to resolve interspecific variation in the bathydraconids and artedidraconids. Clearly cyt b would not be a suitable alternative gene. Such research will have additional merit since, despite the existence of well-established morphological keys to the identification of Antarctic fish larvae (Effremenko Reference Efremenko1983, Kellermann Reference Kellermann1990, North & Kellerman Reference North and Kellerman1990), these keys are deficient in information for these two families in particular (Kock & Jones Reference Kock and Jones2005).
In a second instance, the failure to obtain species-level classification may arise from morphological identification problems. For the Liparidae, although species names could not be assigned, taxonomic units are clear at species levels of divergence (e.g. 6 branch tips with at least 6% divergence; Fig. 1). A similar magnitude of divergence is seen in the Zoarcidae with four unidentified species of Lycenchelys clearly resolved by barcoding but unresolved by morphological taxonomy. A relatively recent radiation has been proposed for both the Liparidae and Zoarcidae in the Scotia Sea, with patterns similar to those observed in the Bering Sea (Andriashev Reference Anderson1986, Anderson Reference Andriashev and Stein1988). Of at least 67 known liparid species in the Southern Ocean, there are estimated to be at least 28 species of Careproctus (Andriashev & Stein Reference Andriashev1998). The Zoarcidae are also extremely speciose with 26 known species from the Antarctic (Møller & Stewart Reference Møller and Stewart2006). New species continue to be described for the Zoarcidae and Liparidae (e.g. Matallanas & Pegueño Reference Matallanas and Pequeño2000, Møller & Stewart Reference Møller and Stewart2006), which are clearly priority families for further taxonomic attention.
Biogeography
Barcoding has the power to provide valuable insight into patterns of genetic divergence affected by species-level or ecological variation (Hajibabaei et al. Reference Hajibabaei, Singer, Hebert and Hickey2007). By sampling and sequencing individuals from different parts of their distribution in the Scotia Sea, we attempted to control for potential biogeographic patterns of the intraspecific COI signal. For example, it is reasonable to consider that populations from the South Orkneys, situated at the Weddell–Scotia Sea confluence, might be effectively isolated from other Scotia Sea populations. Despite the fact that sample sizes are low in this study, our data do not indicate any significant geographic component to the observed patterns of variation in the COI sequence. Although many of the BOLD NN pairwise comparisons with distances > 1% are found between specimens from disparate regions of the Scotia Sea, many such comparisons also yield small genetic distance values. With our current dataset, we cannot resolve any geographic relationship, thus confirming the emergent pattern of low within-species divergence of COI sequence variation.
The lack of geographic variation observed in our study is of particular interest with respect to the genus Notothenia. Differences in morphological and meristic characteristics have been used to substantiate division of several notothenioids into subspecies, or even allopatric species (Gon & Heemstra Reference Gon and Heemstra1990). Among examples of the latter is the putative separation of Notothenia coriiceps and N. neglecta (Nybelin) as allopatric taxa. Significant controversy is associated with this classification, centred largely on the fact that sample sizes are low and from few localities, and at best may only represent subspecies-level divergence (DeWitt Reference DeWitt1966). Considering the plasticity of traits and/or frequency of intermediate characteristics in Notothenia, it has been argued that no taxonomic distinction is in fact deserved (Everson Reference Everson1969, Gon & Klages Reference Gon and Klages1988). Indeed, Gon & Heemstra (Reference Gon and Heemstra1990) conclude that any continued use of such taxonomy in the literature “is due more to taxonomic inertia than to cogent evidence in favour of such recognition”. One locality where it has been proposed that these forms may be readily distinguishable is King George Island, an area where much of our sampling was focused. However, collected from regions to the north and south of King George Island (Deception and Elephant Island), in Potter Cove itself, as well as in regions further east along the Scotia Arc, our samples as yet reveal no significant variation in molecular diversity indicative of subspecies-level divergence, let alone species-level divergence. In one of the few studies examining the genetic basis of intraspecific morphological variation in Antarctic fish, Bernardi & Goswami (Reference Bernardi and Goswami1997) also found no link with 12S and 16S mitochondrial sequence variation and morphological variation in Trematomus bernacchii. Variation in morphological and meristic traits may thereby indicate phenotypic plasticity arising from occupation of varied environments, rather than identification of reproductively distinct assemblages. This hypothesis, however, needs to be tested fully with data from more variable genetic regions such as nuclear DNA markers.
Corroboration of phylogenetic signal
The interpretation of tree topology for DNA barcoding agendas is concerned with the delineation of taxa, or grouping of tips, rather than phylogenetic relationships and patterning (Steinke et al. Reference Steinke, Vences, Salzburger and Meyer2005, Hajibabaei et al. Reference Hajibabaei, Singer, Hebert and Hickey2007). Although the COI barcode is a short sequence from a single gene that is rarely subjected to detailed phylogenetic tree-building, barcode sequence data can still prove phylogenetically informative. Not only does it highlight preliminary patterns of genomic diversity, but it can be a valuable “shared genomic cornerstone” bolstering the suite of potential genes used to build a phylogeny and, indeed, even bridging gaps in resolution between species-level tips and deeper tree branches (Hajibabaei et al. Reference Hajibabaei, Singer, Hebert and Hickey2007). With this in mind, some phylogenetic signals are present in our sequence data that are relevant to previous phylogenetic analyses of several families of Antarctic fish.
Patterns resolved by COI are concordant with previously described relationships within the Channichthyidae, Artedidraconidae and Bathydraconidae (based on combined cyt b and control region sequence; Derome et al. Reference Derome, Chen, Dettaï, Bonillo and Lecointre2002), though relationships resolved between these families differ. Such discordance is most notable among the artididraconids: where Derome et al. (Reference Derome, Chen, Dettaï, Bonillo and Lecointre2002) place the artididraconids as a sister group to a composite group composed of the bathydraconids and channichthyids, COI data resolve the artedidraconids (with 99% bootstrap support) as a sister group to one branch of the bathydraconids distinct from the channichthyids. Relationships based on COI data also match previous molecular topologies suggesting that the Bathydraconidae is paraphyletic (Bargelloni et al. Reference Bargelloni, Zane, Derome, Lecointre and Patarnello2000b, Derome et al. Reference Derome, Chen, Dettaï, Bonillo and Lecointre2002, Near et al. Reference Near, Pesavento and Cheng2004), although the bootstrap value supporting this for CO1 is extremely low (29%). When combined with morphological data, however, there is support for a monophyletic family comprised of three strong lineages (Derome et al. Reference Derome, Chen, Dettaï, Bonillo and Lecointre2002), one of which (Cygnodraconae, including Parachaenichthys charcoti) clusters more closely with the artedidraconids than the other putative bathydraconid lineage in our data. Combined D-loop and cyt b sequences (Bargelloni et al. Reference Bargelloni, Zane, Derome, Lecointre and Patarnello2000b) as well as 16S and 12S combined sequences (Bargelloni et al. Reference Bargelloni, Marcato, Zane and Patarnello2000a) place the artedidraconids and P. charcoti in a topology different from that seen in our data, although the COI topology is quite similar to that of 16S when the complete gene sequence is analysed (Near et al. Reference Near, Pesavento and Cheng2004). The resolution of relationships among species of the genus Trematomus afforded by COI were also remarkably similar to phylogenetic studies of genetic differentiation in this taxa (Ritchie et al. Reference Ritchie, Bargelloni, Meyer, Taylor, Macdonald and Lambert1996, Bargelloni et al. Reference Bargelloni, Marcato, Zane and Patarnello2000a, Reference Bargelloni, Zane, Derome, Lecointre and Patarnello2000b, Stankovic et al. Reference Stankovic, Spalik, Kamler, Borsuk and Weglenski2002, Near et al. Reference Near, Pesavento and Cheng2004, Sanchez et al. Reference Sanchez, Dettaï, Bonillo, Ozouf-Costaz, Detrich III and Lecointre2007). Similarly, COI data supported previously reported relationships (Near et al. Reference Near, Pesavento and Cheng2004) among the species of the genus Lepidonotothen as well as their sister genera Patagonotothen.
Further applications
We have demonstrated that many of the most common fish in the Scotia Sea are identifiable by DNA barcoding. This study creates a powerful resource for identifying a range of sample types including eggs and larvae, as well as material that has been separated from its identifier (e.g. fin clip or muscle tissue) or was collected in a degraded or disrupted condition (e.g. stomach contents). This broadly applicable approach could be integrated with major FAO fisheries information systems (Lleonard et al. 2006), providing a valuable tool to fisheries-related and ecological monitoring in the Scotia Sea.
One of the claims of DNA barcoding is that of accelerating the biodiversity inventory, and this is of course most relevant for lesser studied regions such as the Antarctic. DNA barcoding has exceptional promise in highlighting taxa in this region that require further taxonomic investigation and resolution, be it from studies of morphological, meristic or molecular characters, and preferably a combination thereof. We would expect that the integration of classical approaches with DNA barcoding will empirically address hypotheses of cryptic speciation and contribute to broader studies of molecular evolutionary theory (Bazin et al. Reference Bazin, Glémin and Galtier2006). The cumulative molecular data arising from DNA barcoding will result in a tractable taxonomic framework for the resolution of fundamental population processes such as spawning, recruitment and dispersal. Such information is especially pertinent in an environment where natural and anthropogenic activities are causing accelerated changes to species abundance and distribution (Clarke et al. Reference Clarke, Murphy, Meredith, King, Peck, Barnes and Smith2007).
Acknowledgements
This work was supported by an AFI/NERC Grant to GRC, WFH, AWN and other partners (AFI 6–16). Invaluable collaboration with the British Antarctic Survey BIOPEARL programme was facilitated by Katrin Linse. We thank the officers and crew of the RRS James Clark Ross, as well as Alastair Newton and the BIOPEARL team for help with collections. Inigo Everson provided valuable comments on various aspects of the manuscript and Jan Albin cheerfully assisted in the laboratory. Helen Wilcock was instrumental in developing the gene flow project and provided the initial vision and drive that gave rise to this research.


