


Introduction
The Scotia Arc is a very dynamic region of archipelagos linking South America and the Antarctic Peninsula. It encompass islands with a wide range of isolation levels, size and age, some of which have been well sampled whilst others are poorly known. It is the only Southern Ocean area with ‘staging posts’ between any southern continent and Antarctica, reports of marine non-indigenous species (Ralph et al. Reference Ralph, Maxwell, Everson and Hall1976, Clayton et al. Reference Clayton, Wiencke and Klöser1997) and is the meeting point of a number of biogeographic provinces (Dell Reference Dell1972). Some of its islands are rapidly warming (Quayle et al. Reference Quayle, Peck, Ellis-Evans, Peat and Harrigan2002) and others, the youngest in Antarctica, are currently active volcanoes. Over the last ten million years the Scotia Arc has been the most rapidly changing area around the Southern Ocean as it expanded out to create the Scotia Sea, new sea floor and archipelagos (Livermore et al. Reference Livermore, Hillenbrand, Meredith and Eagles2007). Further back in time the Drake Passage opened in this area, about 34 million years ago, leading to the circulation of deep water, the Antarctic Circumpolar Current (ACC) and the subsequent oceanographic isolation of Antarctic marine benthos (Lawver & Gahagan Reference Lawver and Gahagan2003). Thus the Scotia Arc now comprises islands as disparate as large ancient continental fragments such as South Georgia with many marine endemics (Barnes & De Grave Reference Barnes and De Grave2000, Linse et al. Reference Linse, Griffiths, Barnes and Clarke2006) and very small young volcanoes, like Montague Island, which was erupting at the time of the current study.
Although some large areas have been barely sampled at all, the data available suggest that the Southern Ocean is clearly rich in benthos (Clarke & Johnston Reference Clarke and Johnston2003), especially on the shelf (Brey et al. Reference Brey, Klages, Dahm, Gorny, Gutt, Hain, Stiller, Arntz, Wägele and Zimmerman1994). Most of Antarctica's richness occurs on its seabed and understanding the nature of this should be considered a scientific priority for a number of reasons. The Southern Ocean seabed has very low anthropogenic impact, high endemism (Arntz et al. Reference Arntz, Gutt, Klages, Battaglia, Valencia and Walton1997), an arguably sensitive fauna (Peck et al. Reference Peck, Webb and Bailey2004) and is already showing signals of the predicted regional warming (Meredith & King Reference Meredith and King2005). Past studies on the benthos of the region have generally concentrated on the uppermost shelf (Arntz & Rios Reference Arntz and Rios1999, Arntz & Brey Reference Arntz and Brey2003, Arntz et al. Reference Arntz, Thatje, Linse, Avila, Ballesteros, Barnes, Cope, Cristobo, De Broyer, Gutt, Isla, López-González, Montiel, Munilla, Ramos Esplá, Raupach, Rauschert, Rodriguez and Teixidó2006), especially with respect to disturbance such as ice scour (Barnes & Conlan Reference Barnes and Conlan2007). Most of these Southern Ocean benthos studies have assessed benthos by broad-scale distribution patterns at high taxonomic levels (e.g. Ramos Reference Ramos1999). More detailed studies have focussed on specific sites, such as the South Shetland Islands (Saiz-Salinas et al. Reference Sáiz-Salinas, Ramos, García, Troncoso, San Martin, Sanz and Palacin1997, Arnaud et al. Reference Arnaud, López, Olaso, Ramil, Ramos-Esplá and Ramos1998, San Martin et al. Reference San Martín, Parapar, García and Redondo2000) or particular taxa (Manjón-Cabeza & Ramos Reference Manjón-Cabeza and Ramos2003, San Vicente et al. Reference San Vicente, Castelló, Corbera, Jimeno, Munilla, Sanz, Sorbe and Ramos2007). In the past many datasets have relied on estimating percentages of total catch by eye or by semi-quantitative abundance scales due to large catch sizes and time limitations (e.g. Ramos Reference Ramos1999). In the current study we attempt to semi-quantitatively sample richness at four depths, 200–1500 m at all the major archipelagos of the Scotia Arc. In doing so we aim to provide a powerful and novel baseline data set on how rich and abundant benthos is in this dynamic region and how it changes with depth, archipelago, environment and latitude.
Methods
Study area
Eight study areas were selected within the Scotia Arc, in the Southern and South Atlantic oceans. Although all of these areas are in the same region, similar latitudes, influenced by the Antarctic Circumpolar Current (ACC) and broadly similar in terms of low temperatures and high salinities, they also differ in many respects. Most importantly the study areas vary in age, geological history, isolation, ice interaction, primary productivity, substrata (e.g. sediment accumulation) and position relative to the Polar Front. Two of the areas are relatively young volcanic calderas, Deception Island and Southern Thule, and both have erupted in recent time. Southern Thule is thought to have experienced possible 20th century eruptions (Baker Reference Baker1968) and Deception Island last erupted in 1967–70 (Cranmer et al. Reference Cranmer, Ruhl, Baldwin and Kaufmann2003). Our samples were taken from within the caldera at Deception and outside the caldera, on the slopes of the volcano, at Southern Thule. Most of the study areas are crustal fragments, which have true shelf and slope areas, except for Southern Thule, which is a volcano that rises steeply from the sea floor (Smellie et al. Reference Smellie, Morris, Leat, Turner and Houghton1998). Those areas closest to the Antarctic Peninsula or under the influence of the Weddell Gyre (South Shetland Islands, South Orkney Islands and South Sandwich Islands) are within the extent of the winter sea ice zone (Simmonds & Jacka Reference Simmonds and Jacka1995) and also tend to experience greater numbers of icebergs and therefore greater iceberg scouring than those further north (Barnes & Conlan Reference Barnes and Conlan2007).
Sample collection
Sampling of benthos was undertaken using a 2 m wide Agassiz trawl (AGT). This was deployed at one area in the South Atlantic (Falklands Trough - FI) and seven areas in the Southern Ocean (Deception Island - DI, Livingston Island - LI, Elephant Island - EI, Powell Basin/South Orkney Islands - PB, Southern Thule - ST, South Georgia - SG and Shag Rocks - SR) (Fig. 1, Table I) during the JR144 (BIOPEARL) cruise with RRS James Clark Ross from February–April 2006. Sampling was carried out at four sites/depths over a depth gradient from 200 m to 1500 m at each area (with the exception of just one site within the volcanic caldera of Deception Island). CTD readings were taken at each location and depth to acquire temperature and salinity readings.

Fig. 1. The position of the South Sandwich Islands in the Southern Ocean and, insert, the study sites where the Agassiz trawl (AGT) was deployed during the cruise JR144.
Table I. Geographic, bathymetric and environmental details of Agassiz trawl (AGT) stations of the Southern Ocean cruise JR144.

Stations: DI=Deception Island, LI=Livingston Island, EI=Elephant Island, PB=Powell Basin/South Orkney Islands, ST=Southern Thule, SG=South Georgia, SR=Shag Rocks and FT=Falkland Trough.
At most areas and sites the seabed topography was examined prior to trawl deployment using multibeam sonar (SWATH). The deployment protocol was standardized as described in Allcock et al. (Reference Allcock, Lockhart, Ellingsen, Mooi and De Broyer2003). The position of the AGT's arrival on and leaving of the seafloor was recorded using the vessel's cable tension meter. The mesh size of the AGT net was 10 mm and on board the catch was sieved, finishing with 0.5 mm mesh. Once on board the entire samples were hand-sorted and identified into taxonomic groups (mainly class level). The systematic assignment to higher taxonomic groups followed Barnes (Reference Barnes1998). The wet mass of the different taxa was measured using calibrated scales (0.001 kg). Numbers and wet masses for each taxon were recorded in a digital database, which also contained all information on each trawl.
Comparisons of community compositions between stations were measured using Bray-Curtis similarities (Bray & Curtis Reference Bray and Curtis1957). The relative abundances were used to compensate for the semi-quantitative nature of the AGT data. The class level richness data are compared with data from LAMPOS (Arntz & Brey Reference Arntz and Brey2003) and South Georgia groundfish survey 2005 (unpublished report South Georgia Government).
Results
The benthic communities around the Scotia Arc were rich at higher taxonomic levels. The macro- and megafauna comprised a total of 15 phyla and 29 classes from the 29 trawls (Table II). The total number of individual (counting colonies as one individual) animals was 10 483 with a total wet mass of 130.341 kg. The maximum number of phyla and classes found in one site/trawl (one depth of one study area) was twelve and nineteen respectively. To enable comparisons between trawls all numbers and masses were standardized to per areas of 1000 m2.
Table II. Abundances of phyla and classes by study area and site (depth) around the Scotia Arc in the samples of JR144. The area abbreviations are as in Table I.

The abundance of macro- and megafauna varied more than two orders of magnitude, sometimes even within classes and within study areas (Table II). Just a single individual represented many taxa at some or many sites. The occurrence of taxa could be broadly categorized into a few basic patterns. Some were well represented across areas and depths in either high (e.g. malacostracans) or low (e.g. anthozoans) numbers. A second category of classes was well represented at certain depths (e.g. Stelleroidea at the 200 m sites of DI, EI, PB, SR and FT), though not so in certain areas (at the 200 m sites of LI, SG and ST). The stenolaemate bryozoans (cyclostomes) showed a third type of occurrence, in being found at only few sites but were often abundant where they occurred (200 m site at SR). Fourthly, there were classes, such as the calcarean sponges or polyplacophoran molluscs, which were rare by site and depth and never abundant. Finally some taxa were very patchy or showed no obvious pattern (e.g. bivalves). We also found two single occurrences of Chaetognatha (not listed in Table II) at 1000 m at Southern Thule and at 1500 m at Elephant Island.
The total abundance and wet mass of zoobenthos per 1000 m2 (Fig. 2a & b) varied considerably between regions and between depths. The Falkland Trough region had the largest combined total for all four trawls (2825 ind. 1000 m-2) whilst the lowest overall abundance was at Southern Thule (637 ind. 1000 m-2). However, variability in abundance was more obvious with bathymetry. The shallow shelf (160–200 m) trawls showed the highest values (except for Livingston Island) and the most variability ranging from 379 at ST to 2383 at FT (ind 1000 m-2) (Fig. 2a). For the majority of regions (but see Southern Thule and Shag Rocks) the deepest trawls, 1500 m, yielded the least abundance. At deep shelf/shallow slope depths (500 m and 1000 m) there was greater similarity in values and no distinct pattern or depth gradient.

Fig. 2. Abundance and wet mass of zoobenthos with sites and depth. a. Abundance of pooled zoobenthos standardized to per 1000 m2 trawl area. b. Total wet mass (kg) of zoobenthos standardized to per 1000 m2 trawl area. The area abbreviations are as in Table I.
The wet mass of animals, standardized to 1000 m2 trawls, recorded from each trawl also varied between geographical areas and with depth (Fig. 2b). The highest total regional mass was found at Elephant Island (39.07 kg) and the lowest at Livingston Island (1.19 kg). As with the numbers of individuals, the shallowest stations had the greatest mass of macro- and megabenthos. Amongst the study areas only Livingston Island did not show considerably higher mass at its 200 m station. Generally wet mass decreased with increasing depth. Notably the site/depth trawls that contained the highest abundance were not the same as those with the highest wet mass (Fig. 2).
The relative abundances of each phylum (Fig. 3a) showed great variation both between regions and depths. Some trawls were dominated by representatives of a single phylum e.g. the Livingston Island 1000 m sample comprised over 95% annelid worms. Shallow water sites were less dominated by any single phylum and tended to have a wider range of taxa that were also more evenly spread. The deeper water sites were dominated by fewer, typically two to four, different phyla. Some phyla were consistently present, usually as a large proportion of most trawls e.g. Annelida, Mollusca, Echinodermata and Crustacea. Other phyla tend to show a patchy distribution of dominance despite being found in many trawls e.g. Bryozoa, Chelicerata, Cnidaria, Chordata and Porifera.

Fig. 3. The relative composition of benthos a. by abundance, and b. wet mass of each phylum per trawl sample. The area codes are as in Table I and the key to the taxa is shown.
The dominance of phyla by site by wet mass (Fig. 3b) was often quite different to that shown in terms of relative abundance. Many phyla present in small numbers can dominate the relative mass due to a few very heavy individuals e.g. the sponges of the family Rosellidae. Conversely some phyla can be represented by hundreds of individuals but make up a very small percentage of the wet mass due to very low individual masses e.g. most bryozoans. As with relative abundance, the relative wet mass of phyla varied considerably between taxa, regions and depths.
The two volcanic study areas, Deception Island and Southern Thule, showed very similar patterns of relative mass of phyla. Chordata and Echinodermata dominated both. Crustacea were present in most trawls but only seem to dominate in the deeper trawls, especially those from South Georgia and Shag Rocks.
The relative abundance and wet mass patterns of those phyla represented by a single class (Priapula, Chelicerata, Sipuncula, Echiura, Annelida and Chordata - see Fig. 4a & b) obviously had identical class and phylum level patterns. Other phyla (Bryozoa, Crustacea and Porifera) represented by two or more classes, often had one class widespread and commonly found and the other classes being more patchy in distribution, wet mass and abundance. These more patchy classes could be regionally important, such as the hexactinellid sponges, which was only found in seven out of 29 samples but constituted 57% of the wet mass of a single trawl at Elephant Island. In contrast, classes such as the Gastropoda were present in 19 samples but did not form a large proportion of the relative abundance in any samples and only formed a substantial proportion of the relative wet mass in three samples.

Fig. 4. Proportional abundance and wet mass of classes in trawl sample around the Scotia Arc. The plots shown are a. relative (%) abundances, and b. wet mass of each class per trawl (A) minor classes (Anopla, Articulata, Calcarea, Cephalopoda, Cirripedia, Crinoidea, Echiurida, Inarticulata, Nemertea, Priapulida, Scaphapoda and Sipunculida) were combined to form “other”. The area abbreviations are as in Table I.
With the exception of the class Crinoidea, the Echinodermata formed a major component of both the relative abundance and relative wet mass in most trawls (constituting over > 10% of 20 trawls). The relative importance of each class of Echinoderm varied with region and depth. Echinoidea were not abundant in most trawls, with the notable exception of 500 m at South Georgia where they accounted for 80% of the individuals and >90% of the wet mass. Holothuroidea were widely distributed and made up a large proportion of abundance and wet mass in several deeper trawls, most significantly at Southern Thule. The fifth class of Echinodermata, Stelleroidea, which formed a significant proportion of abundance and wet mass of most samples (found in 23 out of 29 trawls), were only absent from deeper water samples in the three regions furthest to the north.
The absence/presence of phyla and classes at sites and areas was analysed to study biogeographic and bathymetric trends in the occurrence of the taxonomic group (Fig. 5). Seven (Porifera, Mollusca, Echinodermata, Crustacea, Cnidaria, Chordata and Annelida) out of the fourteen phyla were found in all study areas, a further two (Chelicerata and Bryozoa) were only absent at Deception Island, where only one trawl was taken. The same seven dominant phyla were found at all depths (160 m, 200 m, 500 m, 1000 m and 1500 m). Brachipoda, Chelicerata and Bryozoa were all present at every depth except for the 160 m Deception Island sample. Nine of the twenty-nine classes were found in all areas and a further five groups were only missing from the Deception Island sample. The same nine classes were also found to occur at every depth and another six classes were only absent from the single Deception Island sample.

Fig. 5. Higher taxa with depth and site around the Scotia Arc. Presence/absence matrix for both (l) Phylum and (ll) Class levels for all samples. Grey squares show the presence of a taxon. The 200 m Deception Island sample = 160 m depth). For area name abbreviations see Table I.
Levels of faunal similarity between trawl samples (nMDS plots, Fig. 6a & b) showed strong depth and site patterns. Overall samples were typically more similar (clustered) by depth rather than site, but levels of similarity changed with depth. Shallow shelf (160–200 m) trawls were most similar to each other. Deeper shelf and shallow slope samples were indispersed whilst deeper (slope - 1500 m) trawls were least similar to each other (i.e. showed most dispersion). Some Shag Rocks samples showed close similarity to those of its nearest geographical neighbour, South Georgia. Patterns of similarity were clearer with abundance data (Fig. 6a) than with wet mass data (Fig. 6b) but showed similar trends. The nMDS analyses were also characterized by fairly high stress (> 0.13).

Fig. 6. Similarity of Scotia Arc samples with site and depth. The plots are two-dimensional ordination (MDS) of class level data using a. 4th root transformed abundance, and b. wet mass data from Bray-Curtis similarity. For area name abbreviations see Table I.
Generally biomass increased with abundance in our Scotia Arc samples but relationships differed with site. We found no significant trend in the increases at Powell Basin and Southern Thule samples (R2 values were 0.235 and 0.202 respectively) and only one sample was taken at Deception Island (Fig. 7a). The increase of richness with mass was steepest at Livingston Island but, as at Elephant Island and South Georgia, increases had high R2 values but were not significant. In two regions, Shag Rocks and the Falkland Trough, there were significant and similar trends of increasing richness with increasing wet mass (R2 = 0.993 and 0.964 respectively). The relationship with pooled data of these two sites (Fig. 7b, R2 = 0.962) showed that the number of classes approximately doubles with order of magnitude increases in wet mass. Repeating these analyses using phyla as the measure of richness gave similar increasing patterns with wet mass as at class level, and with the only significant relationships being for the Shag Rocks and Falkland Trough sites.
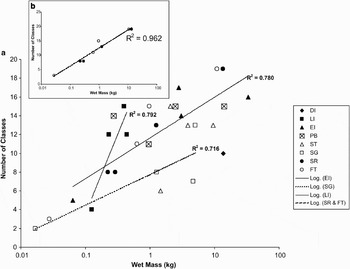
Fig. 7. Richness with biomass of shelf and slope benthic samples, standardized to 1000 m2 trawl area, around the Scotia Arc. The plots are class level richness with wet mass for a. all samples, and b. specifically for Shag Rocks and Falkland Trough samples. Regression lines shown are all significant (ANOVA, P < 0.05). The key to sites is shown (for area name abbreviations see Table I) and on the insert (b) Shag Rocks samples are shown as open circles and the Falkland Trough are shown as solid circles.
Discussion
Richness
The current study showed Scotia Arc continental shelf samples to be remarkably rich at higher taxonomic levels, even at remote and geologically young sites. We found 15 phyla (major types of animals) in total across the Scotia Arc as has a previous study in the South Shetland Islands (but using grabs and corers, see Saiz-Salinas et al. 1997), but such richness needs context to be meaningful. Representatives of 21, (more than half the world's phyla) could potentially be found by coarse sampling, e.g. by Agassiz trawl, the seabed (the remainder are either microscopic, parasitic or terrestrial). Of these phyla, Ctenophora, with the exception of a few, not very abundant benthic species, would be unusual as they are typically pelagic. Of the remaining 20 phyla, we could find no Southern Ocean record of the Phorona in the published literature. The Phorona and another phylum of small (<1 cm long, 1 mm wide) animals, the Entoprocta occur attached to hard surfaces so would not be readily sampled using an Agassiz trawl (but see Gallardo & Castillo Reference Gallardo and Castillo1969) and would be difficult to see on removal from water. Thus the 15 phyla found in the current study represents all but three phyla of the total we could realistically expect and, furthermore, we found up to 12 different phyla within some single trawls. Class level richness found by the current study, 29, was also very high. Other studies, using a variety of apparatus have supported these findings of both high local-scale richness and this being widespread in the region. Even on the shelf of the world's most remote island, Bouvetøya, Arntz et al. (Reference Arntz, Thatje, Linse, Avila, Ballesteros, Barnes, Cope, Cristobo, De Broyer, Gutt, Isla, López-González, Montiel, Munilla, Ramos Esplá, Raupach, Rauschert, Rodriguez and Teixidó2006) found a total of eleven phyla and twenty classes. Intensive sampling has been undertaken at a few locations, such as around the South Shetland Islands. Of the 15 phyla found at the South Shetland Islands, rarely were more than 50% found in any one sample (Gallardo & Castillo Reference Gallardo and Castillo1969, Saiz-Salinas et al. 1997, Lovell & Trego Reference Lovell and Trego2003). Previous sampling at Shag Rocks and South Georgia, two of our study locations, did so using benthic trawls enabling more robust comparisons between our and other studies. Trawls reported by previous studies found approximately similar levels of class richness (Fig. 8). The higher number of classes found by the current study at these sites, compared to most previous sampling, probably reflects differences in apparatus (Agassiz vs bottom trawl). Like the current study, previous sampling around Shag Rocks and South Georgia found a non-linear decrease in richness with increasing depth (see Fig. 8).

Fig. 8. Class level richness with depth at Shag Rocks (SR) and South Georgia (SG). The scientific cruises collecting the data were; the current study (JR144), a 2005 South Georgia Groundfish Survey (GFS) and in 2002 LAMPOS. The apparatus used were Agassiz (AGT) and bottom (GSN) trawls.
Abundance and biomass
Faunal abundance showed no relationship with latitude but decreased with increasing depth as has been found at a number of localities in the region (e.g. Piepenburg et al. Reference Piepenburg, Schmid and Gerdes2002 but see Saiz-Salinas et al. Reference Saiz-Salinas, Ramos, Munilla and Rauschert1998). Total wet mass also showed no latitudinal or regional pattern and similarly decreased with increasing depth. (Saiz-Salinas et al. Reference Saiz-Salinas, Ramos, Munilla and Rauschert1998). Food quantity and quality (Cadée Reference Cadée1992, Saiz Salinas et al. 1998) as well as decreasing availability of hard substratum type (see Barnes Reference Barnes2008) seem likely to be major influences. The lowest values of wet mass in the current study were found at Livingston Island as were the least difference between shallow and deep samples. These samples were predominantly muds (Table I). The apparently low abundance and wet mass at Livingston Island could be due to sampling bias. The Agassiz trawl samples epifauna well but infauna poorly (Arnaud et al. Reference Arnaud, López, Olaso, Ramil, Ramos-Esplá and Ramos1998) but Saiz-Salinas et al. (Reference Saiz-Salinas, Ramos, Munilla and Rauschert1998) also found decreased biomass with depth using a grab well suited to sampling infauna.
Dominance of taxa by abundance or wet mass did not show such clear relationships to depth, as for example found by Saiz Salinas et al. (1998). We, like Arnaud et al. (Reference Arnaud, López, Olaso, Ramil, Ramos-Esplá and Ramos1998), found a strong dominance of single taxa in some areas such as the Annelida at Livingston Island. Typically though, at shallow shelf depths (160–200 m) a number of phyla were abundant and this varied considerably between sites. Some to much variability for shallow assemblages can be linked to patchiness in recovery time and seabed topography due to ice-scour and, to a lesser extent, other disturbance (Gutt & Piepenburg Reference Gutt and Piepenburg2003, Barnes & Conlan Reference Barnes and Conlan2007). Much lower food levels, a more homogenous seabed, fewer hard surfaces and other factors contribute to a depth pattern but it was perhaps surprising that no regional pattern was evident considering the study encompassed sites each side of the Polar Front, of very different ages and levels of isolation. With small number of samples (such as at 1500 m), chance catches of a patch of one type of animal lead to an increased chance of samples appearing to be dominated by a single group.
The most striking site similarity was between the shallow shelf in the two active volcanos, Southern Thule and Deception Island. There have been recent eruptions in both areas, the 1967–1970 events at Deception Island destroying virtually all of its local fauna before gradual recovery (Gallardo et al. Reference Gallardo, Castillo, Retamal, Yañes and Llano1977). The rapidly colonizing and growing ascidians (Rauschert Reference Rauschert1991) dominated the wet mass of fauna at both locations as seems to be the case in the shallows newly exposed by the collapse of the Larsen B iceshelf (J. Gutt personal communication 2007). Future work drying and ashing these samples will undoubtedly reveal them to constitute a much lower proportion of the dry mass or organic (ash-free dry) mass, because of the high proportion of water in an ascidian body. Several phyla and classes are characteristically absent from impoverished Deception Island and the composition of our trawl was mainly typical of this most well sampled site (see Barnes et al. 2008). The other young volcano, Southern Thule, is much more isolated and surrounded by deep sea. It is unsurprising, therefore that the Holothurioidea, which are particularly important in deep-sea communities (Gutt Reference Gutt1988, Billett et al. Reference Billett, Bett, Rice, Thurston, Galeron, Sibuet and Wolff2001), dominated the deeper samples of Southern Thule.
Half of the phyla, and nine of the classes, found in the current study occurred at all study regions and depths. Many others were only absent from a few locations. Considering only one sample was taken at each site-depth combination, it seems likely most higher taxa are ubiquitous in this area at shelf and slope depths. This is supported by the collecting of the few taxa we did not from several Scotia Arc localities and depths by previous benthic surveys (e.g. Ramos Reference Ramos1999, Lovell & Trego Reference Lovell and Trego2003, Fig. 8). Conversely other studies (e.g. Ramos Reference Ramos1999) have not found certain taxa at some sites (e.g. Crinoidea at Shag Rocks or Southern Thule).
Generally representatives of the classes Inarticulata (brachiopods) and Stenolaemata (bryozoans) were only found in samples which contained rocks (Table I). Samples which included boulders could have a very high richness of cryptofauna, even at 1500 m (Barnes Reference Barnes2008). Such boulders can be associated with type of substrata as many are ‘dropstones’ which have been released from melting icebergs (Oskierski Reference Oskierski1988, Thomson Reference Thomson2003). As large icebergs have been recorded throughout the Scotia Arc it is probable that most regions have some dropstones. The lower densities of hard substratum for cryptofauna, and generally of animals, at deeper slope depths (Rex et al. Reference Rex, Etter, Morris, Crouse, McClain, Johnson, Stuart, Deming, Thies and Avery2006) would require a much greater trawling effort to sample taxa to the same extent as on the shallow shelf.
Despite most higher taxa probably being fairly ubiquitous in the Scotia Arc and present in most site-depth samples our (Bray-Curtis) data showed little similarity to that by Ramos (Reference Ramos1999). For example, in contrast to the current study, Ramos (Reference Ramos1999) found definite groupings between South Georgia and the South Orkney Islands, with Shag Rocks and the South Sandwich Islands as relative outliers. In common was the South Shetland Islands and Elephant Island similarity, however this was dependent on use of ‘abundance’ rather than ‘wet mass’. We found only one pattern that was reflected in both relative abundance and wet mass, the grouping of Shag Rocks and the Falkland Trough. This is of particular interest given that these areas are south and north of the Polar Front respectively. However, both areas are in regions of strong currents, eddies and turbulence (Clarke et al. Reference Clarke, Barnes and Hodgson2005) and perhaps have similar overlying productivity. The highest levels of assemblage similarity across sites were between those in the shallows probably as a result of the higher abundances, masses and richness of these samples. The relatively high stress levels of the nMDS plots are probably due to the high dispersion (dissimilarity) of the deeper sites from each and all others.
The shelf around Antarctica is known to be richer in benthos than average for its area (Clarke & Johnston Reference Clarke and Johnston2003) but this study convincingly shows that this high taxonomic level richness can be seen at most sites throughout the Scotia Arc, and even in single samples. We found abundance and richness to be strongly linked to depth as other workers have suggested (Saiz-Salinas et al. Reference Saiz-Salinas, Ramos, Munilla and Rauschert1998) whilst we observed no distinct latitudinal gradient in benthic abundance and biomass in the Southern Ocean (Piepenburg et al. Reference Piepenburg, Schmid and Gerdes2002). We found considerable variability within regions and habitat types - soft sediments at nearby Livingston and Elephant islands showed the lowest and highest wet masses of fauna, perhaps due to primary productivity (Holm-Hansen et al. Reference Holm-Hansen, Hewes, Villafanñe, Helbling, Silva and Amos1997). This study provides an important first insight into how shelf and slope fauna are distributed across the entire Scotia Arc from shelf to slope at higher taxonomic levels. However, Antarctic endemism rarely exceeds genus level and thus this data should prove of most value as a source of comparison when the same samples are identified to genus and species level.
Acknowledgements
We would like to thank the Captain and crew of the RRS James Clark Ross. We would also like to thank Alastair Newton, Anthony North, Dan Smale, Jan Strugnell, Jenny Rock, Matthew Brown and Stephanie Kaiser for their assistance with sorting the samples. We are very grateful to Claire Allen, Anna Hey and Elizabeth Petrie for running the SWATH bathymetry system. This paper is a contribution to British Antarctic Survey core project ‘BIOPEARL’ and linked with the SCAR ‘EBA’ programme.


