


Introduction
Deception Island (South Shetland Islands, West Antarctica) is a horseshoe-shaped Quaternary volcanic island with well-recorded geomorphic events related to recent eruptions. Historical eruptions took place in 1842, 1912, 1917, 1967, 1969 and 1970 (Smellie et al. Reference Smellie, López-Martinez, Headland, Hernández-Cifuentes, Maestro, Miller, Rey, Serrano, Somoza, Thomson and Thomson2002). During this period of time, the island's geomorphic evolution has modified the inner shoreline and given rise to new volcanic edifices like cinder cones and maars and tuff cones principally formed during phreatomagmatic eruptions (Roobol Reference Roobol1973, Baker et al. Reference Baker, Roobol, McReath, Harvey and Davies1975, Ortiz et al. Reference Ortiz, Vila, García, Camacho, Diez, Aparicio, Soto, Viramonte, Risso, Menegatti and Petrinovic1992, Smellie Reference Smellie2001, Reference Smellie2002).
Deception Island has been the site of a whaling station and several Antarctic stations since early in the 20th century. Accordingly, different maps and cartographic representations were produced which reflected the eruptions that were taking place, like Kendall's map of 1829 (Roobol Reference Roobol1973), Brecher's 1:10 000 maps of 1956, 1968 and 1970 (Brecher Reference Brecher1975), the 1:25 000 topographic map plotted by the British Directorate of Overseas Surveys, now Ordnance Survey International (OSI 1957) and the 1:25 000 topographic map plotted by the Spanish Army Geographical Service, now Army Geographical Centre (Centro Geográfico del Ejército, CGE 1992). There are also some sketches (Hawkes Reference Hawkes1961, Baker et al. Reference Baker, Roobol, McReath, Harvey and Davies1975, Roobol Reference Roobol1982, Birkenmajer Reference Birkenmajer1991, Reference Birkenmajer1992) and other historical topographical small-scale maps, like the one plotted to a scale of 1:200 000 by the OSI in 1968 (OSI 1968). In 2006, the CGE published a new topographical map of Deception Island based on a Quickbird image georeferenced with almost one hundred control points calculated from a Global Positioning System (GPS) geodetic network called REGID (REd Geodesica Isla Decepción) (Berrocoso et al. Reference Berrocoso, Fernandez-Ros, Torrecillas, Enriquez de Salamanca, Ramirez, Pérez-Peña, González, Páez, Jiménez-Teja, García-García, Tarraga and García-García2006, Reference Berrocoso, Fernández-Ros, Ramírez, Enriquez de Salamanca, Torrecillas, Pérez-Peña, Páez, García-García, Jiménez-Teja, García-García, Soto, Gárate, Martín-Davila, Sánchez-Alzola, De Gil, Fernández-Prada and Jigena2008). The REGID network has been used to monitor the volcano since 1988–89 and now has 12 geodetic vertices. The results obtained from it show that, in terms of surface deformation, the highest current vertical and horizontal ground-surface deformation values are to be found in the areas known as the 1970 volcanic craters and Telefon Bay. To continue the monitoring of topographical changes on the island, we decided to establish as accurately as possible exactly what superficial changes have taken place in the 1970 volcanic craters since the most recent volcanic episode and determine their possible causes. Thanks to the absence of snow in the studied area during the greater part of the year, it was possible both to collect good field data and also to assess the changes that occurred each year.
The goal of this work is to determine the geomorphic changes which have taken place in the 1970 volcanic craters area of Deception Island, since 1968 by comparing digital height data drawn from different sources to produce the most accurate results possible. A similar study was carried out by Cooper et al. in 1998 in Port Foster, Deception Island's inundated caldera, with bathymetric records from several cartographic sources for the period 1829–1993.
Regional setting and the most recent eruptive process at Deception Island (1967–70)
Deception Island is an active volcanic island younger than 0.75 Ma (Valencio et al. Reference Valencio, Mendía and Vilas1979). It lies in Bransfield Strait, between the South Shetland Islands and the Antarctic Peninsula, in a very complex tectonic area at the confluence of two main tectonic plates: the South American and Antarctic plates, and three micro-plates: the Scotia, Phoenix (also known as Drake) and South Shetland plates (Barker & Austin Reference Barker and Austin1994, Rey et al. Reference Rey, Somoza and Martínez-Frías1995, Galindo-Zaldívar et al. Reference Galindo-Zaldívar, Jabaloy, Maldonado and Sanz de Galdeano1996, Klepeis & Lawver Reference Klepeis and Lawver1996, González-Casado et al. Reference González-Casado, Giner-Robles and López-Martínez2000, Barker et al. Reference Barker, Christeson, Austin and Dalziel2003, Muñoz-Martín et al. Reference Muñoz-Martín, Catalán, Martín-Dávila and Carbó2005) (Fig. 1). The volcanic sequence that built up Deception Island evolved from submarine pillow lavas to subaerial eruptions, mainly Strombolian and phreatomagmatic (Baker et al. Reference Baker, Roobol, McReath, Harvey and Davies1975, Martí et al. Reference Martí, Vila and Rey1996, Smellie Reference Smellie2001, Smellie et al. Reference Smellie, López-Martinez, Headland, Hernández-Cifuentes, Maestro, Miller, Rey, Serrano, Somoza, Thomson and Thomson2002, Maestro et al. Reference Maestro, Somoza, Barnolas, Rey, Martínez-Frías and López-Martínez2007), indicating that the island actually evolved through the collapse of a huge volcanic edifice under a regional stress.
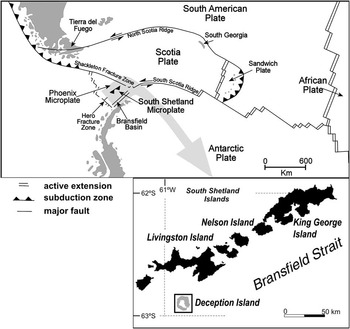
Fig. 1 Map showing the tectonic setting and location of Deception Island (South Shetland Islands, Antarctica).
The present landscape shows a horseshoe-shaped island with a flooded, well developed, collapsed caldera (Port Foster) (Fig. 2). Historic volcanism on Deception Island principally affected the inner rim of the volcanic caldera and was associated with fractures with regional orientations (NNW–SSE) (Martí et al. Reference Martí, Vila and Rey1996). The caldera boundary and the collapse scarp have affected pre-caldera deposits and the location of post-caldera eruptive centres and cinder cones (Smellie Reference Smellie2001, Reference Smellie2002, Smellie et al. Reference Smellie, López-Martinez, Headland, Hernández-Cifuentes, Maestro, Miller, Rey, Serrano, Somoza, Thomson and Thomson2002).

Fig. 2 Toponyms, scientific stations and historical eruption sites on Deception Island and the study area. Solid lines represent the suggested locations of regional morphological lineations.
Eruptions at high elevations were Strombolian, with small magma volumes and durations ranging from hours to days and some subsequently emitted small lava flows which flowed towards Port Foster. Eruptions at lower elevations were principally phreatomagmatic or produced maars.
The most recent eruptive processes took place between 1967 and 1970 with a total volume of erupted material of between 0.12 km3 (Roobol Reference Roobol1982) and 0.20 km3 (Baker et al. Reference Baker, Roobol, McReath, Harvey and Davies1975). The 1967 eruption began on the edges of Telefon Bay in December. The eruption column reached a height of 2500 m, affecting the Chilean Antarctic Station “Pedro Aguirre Cerdá”, which was partially destroyed (Baker et al. Reference Baker, Roobol, McReath, Harvey and Davies1975). This 1967 eruption generated an ephemeral island (known as “Yelcho” or “Marinero Suárez”) around four aligned vents in Telefon Bay which was connected later to the main body of the island during the coastal change caused by the 1970 eruption (Clapperton Reference Clapperton1969). The 1967 eruption caused a basal surge of volcano-sedimentary lapilli with 0.05 km3 of pyroclastic material (Roobol Reference Roobol1982).
The eruption of 1969 was in February and was magmatic (Smellie Reference Smellie2002, Smellie et al. Reference Smellie, López-Martinez, Headland, Hernández-Cifuentes, Maestro, Miller, Rey, Serrano, Somoza, Thomson and Thomson2002) with a total emitted volume of 0.03 km3 (Roobol Reference Roobol1982). The eruptive centres were located along three fissures. The first was NNW trending, the second, running along a NNW–SSE axis, appeared north of the first and the third, with the same orientation as the second, was located at Pendulum Cove (Fig. 2). A series of en echelon rifts opened beneath the glacier ice cover (Shultz Reference Shultz1972) and a lahar destroyed the British Antarctic Station “Station B”, located in Whalers Bay, altering the geomorphology and shoreline of the surrounding area (figs 2 & 9 in Smellie Reference Smellie2002).
Since there was no human presence on the island, the 1970 eruption was recorded by the seismographs of the British Antarctic Survey in August. The eruptive centres were located in the same general area as the eruptions of 1967, in the northern part of the island, with five maar-type marine craters in Telefon Bay and seven land vents (Shultz Reference Shultz1972) in the area discussed in this paper. One of seven land craters was developed in glacier ice. The craters formed during 1970 are aligned with the eruptive centres generated in 1967, trending NNW along an arcuate trace about 5 km long. The land craters were steep-sided with rim diameters of 40–360 m and depths of between 30 and 105 m in the eastern vent (Shultz Reference Shultz1972). The eruption began in the bay on the landward side of the 1967 island (Yelcho island) and later extended to the location of the 1967 land centre, with a total emitted volume of 0.04 km3 of pyroclastic material (Roobol Reference Roobol1982). The eruptive column reached a height of 11 km and air-fall material was found at a distance of 100 km from the main focus of the eruption. During this eruption, the Chilean Antarctic Station was totally destroyed by volcanic ash and other debris.
The monitoring of the Deception Island volcano from 1988–89, to study its surface deformation, showed that the greatest vertical and horizontal deformation is associated with the 1970 volcanic craters, where surface deformation values of over 5 cm yr-1 were recorded for the period 2002–03 in TELE, BOMB and CR70, stations belonging to REGID GPS network (Fig. 3).

Fig. 3 Surface deformation values for the period 2002–03. a. Horizontal displacement rates, and b. vertical displacement rates.
Cartography, new field data and rationale
On analysis it was found that the most accurate historical maps of Deception Island available are the 1:10 000 maps produced by H. Brecher (Brecher Reference Brecher1975) for the years 1956, 1968 and 1970. These maps cover only the 1970 volcanic craters and Telefon Bay areas. Of the more recent maps, the CGE map plotted in 1992 (CGE 1992) and planimetrically updated using satellite imagery in 2003 (CGE 2006), is the one which provides the most up-to-date information.
Brecher's maps were plotted using a projection and a geodetic system different from those used in the CGE map. It was therefore absolutely necessary to project Brecher's maps using the same cartographic system (Universal Transverse Mercator (UTM) zone 20S), and incorporating the same geodetic system (World Geodetic System 1984, WGS84) constraints. Our plan was therefore to construct a digital elevation model (DEM) from the topographic maps and then compare the numerical models obtained to determine changes in the two volumes, overlapping the historical cartography with the new cartography and analysing the geomorphological changes revealed. In 2006 we collected new topographic field data with GPS for the six land craters in the 1970 volcanic area. No data was recorded for the seventh and largest crater because it has become totally back-filled by glacier ice (see Fig. 4b). Then we derived a DEM to compare with the 2003 CGE map so that we could analyse geomorphological changes over a short time. Field observations and photographs were also taken into account.
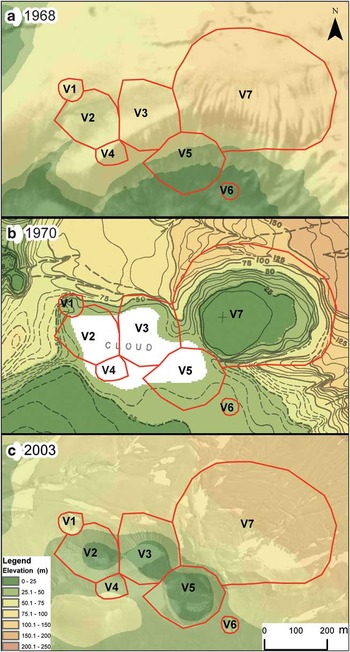
Fig. 4 The 1970 volcanic craters area with the craters’ perimeter in 2006 (red line) except for V7 (filled by ice flow following the 1970 eruption) in a. 1968, aerial photo with DEM, b. 1970, Brecher's map with DEM, and c. 2003, QuickBird image with 1992 DEM.
Before comparing the different types of mapping, one more factor had to be taken into consideration for maximum accuracy: the island's geodynamics over the last 36 years and its surface deformation. Geodetic studies carried out between 1987 and 2007 (Berrocoso et al. Reference Berrocoso, Fernández-Ros, Ramírez, Enriquez de Salamanca, Torrecillas, Pérez-Peña, Páez, García-García, Jiménez-Teja, García-García, Soto, Gárate, Martín-Davila, Sánchez-Alzola, De Gil, Fernández-Prada and Jigena2008) produced deformation models for Deception Island with mean planimetric deformation rates of 1.3 cm yr-1, confirming the two main conjugate fracture systems (NW–SE and NE–SW). About the altimetric deformation, values greater than -5 cm yr-1 have been recorded during the years the island has been monitored.
Linear anamorphosis (UTM) was not taken into consideration because its contribution for the purposes of these rough calculations is negligible. The historical topographic information, aerial photography, new cartography and satellite imagery sets were collected and loaded into a multidisciplinary GIS called SIMAC (Torrecillas et al. Reference Torrecillas, Berrocoso and García-García2006).
Brecher's maps of 1968 and 1970
In 1975, Brecher published three 1:10 000 scale maps of Deception Island (Brecher Reference Brecher1975), dated December 1956, January 1968 and August 1970 (Fig. 4b). The 1970 map was plotted from a 1:23 150 scale topographic map based on 1:28 000 scale aerial photography by the Argentine Naval Hydrographic Service (Servicio de Hidrografía Naval Argentino) (K-17 camera, focal length 6 inches, format 9 x 9 inches), taken to record the eruption which occurred on the island in the same year. These maps did not fully indicate all the changes that had taken place during the period of eruptions, because of the seven new craters which appeared in the 1970 volcanic craters area (Roobol Reference Roobol1979) the six smallest lay beneath a cloud, possibly the plume associated with the craters themselves. To cover that clouded area we therefore also used Brecher's 1968 map, which has similar photogrammetric properties.
Brecher's maps display local co-ordinates with no information about the cartographical projection, the datum or the ellipsoid used. However, one point located at the centre of a crater is given in geographical co-ordinates accurate down to the level of minutes. Also, Brecher mentioned that the sea level recorded for 1970 may have an error of 3 m in height, and that the map took into account a margin of planimetric error of 5 m with regard to the absolute values.
Brecher's map was initially georeferenced to the system of local co-ordinates with RMS error being less than ± 2 m. It was then digitalized with a semi-automatic contour digitizing algorithm and this above mentioned error was therefore discarded, the final planimetric error being estimated at ± 7 m and the final altimetric error at ± 3 m.
The main problem in this study was to find a way to adapt Brecher's data to the WGS84 system and UTM projection of current CGE cartography, with which it was going to be compared. We partially solved the datum problem by resorting to datums used by Argentina, USA, UK or Chile at the time the photographs were taken, such as the “South American 1969 mean for Argentina, Bolivia” datum, the “South American 1969 Argentina” datum and the “Deception Island” datum. Although the maps were plotted from local co-ordinates, global geographic co-ordinates are offered for one single point (62°55′S, 60°39′W). Assuming the existence of different datums for these co-ordinates, it is possible to obtain the co-ordinates of this point in UTM projection and WGS84 system via geodetic transformations, principally of three parameters (Helmert 3D) considering the age of some datums. The spot can also be located on the 2003 CGE map, so the closest approximation to this location could verify the datum used to record Brecher's information. The direct CGE map identification for the point gives the UTM co-ordinates (619 552 m, 3 021 872 m) with a cartographic planimetric error of ± 5 m and a planimetric location error of about ± 25 m, which are very close to those provided by the “Deception Island” datum of (619 597 m, 3 021 828 m). The data reveal no changes exceeding σ= ± 220 m for the “South American 1969 mean for Argentina, Bolivia” and the “South American 1969 Argentina” datums.
Several cartographic projections were tried, including UTM itself and the Polar Stereographic projection, using the “Deception Island” datum but none of them produced satisfactory results and it was concluded that Brecher must have employed a system of local co-ordinates. Since the studied area is only 1.2 x 0.7 km in size, any local projections have minimal planimetric deformation, and we were able to make direct comparisons between the two projections. With this in mind, the 1970 Brecher map was georeferenced by affine transformation using control points in recognizable topographical features in the 2003 CGE map. The same transformation was also applied to the 1968 Brecher map. With regard to elevation measurement, the 2003 CGE map (the mean above sea level (m.a.s.l.) is from 1992) and Brecher's data each have their own 0 elevation data. Also, an apparent 0.5–1 m subsidence of Port Foster shoreline was related by Shultz (Reference Shultz1972, p. 2840) related with the 1970 eruption. The possible relationship with the present values therefore had to be determined, and to that end variations in spot heights and shoreline had to be studied, this eliminated the uncertainty about m.a.s.l. on Brecher's maps, evaluated by Brecher himself as 3 m, as mentioned above. The chosen method involved visual adjustment followed by the subtraction of surfaces to balance out differences in elevation. The calculation method was based on contour lines, spot heights, and constant elevation zones, such as the beds of craters and lakes and stream lines. To do this it was necessary to generate DEMs and we used the interpolation called TOPOGRID, under Arcgis 9.3. The preliminary study of the two DEMs showed that, taking the mean value of the height difference distribution obtained as the point of departure, the mean estimated error might be -4 m, and we therefore decreased the Brecher maps by the same value (Fig. 4a & b).
A study of the volumetric and morphological differences between Brecher's maps for 1956, 1968 and 1970 can be seen in Torrecillas et al. (Reference Torrecillas, Berrocoso, Pérez-López and Torrecillas2012), where we estimated a total erupted volume between 1956 and 1967 of more than 0.005 km3 and a reduction of 1.4 km in the inner coastal shoreline during the most recent eruptive processes in 1967–70.
The CGE map and the new information from the 2003 Quickbird image and 2006 GNSS technology
The topographic map of Deception Island 1:25 000 of 1992 by CGE (1992) produced the best cartographic representation of Deception Island until the 21st century. The map was plotted at 1:28 000 scale from aerial photographs by the Argentinian Naval Hydrographic Survey of 1968 and 1970, under UTM projection, zone 20S, and WGS84, but the information contained in the photographs was updated by a topographic survey of the north-western part of the island in 1991–92 (Smellie et al. Reference Smellie, López-Martinez, Headland, Hernández-Cifuentes, Maestro, Miller, Rey, Serrano, Somoza, Thomson and Thomson2002, p. 7). The CGE map was plotted from a modern topographic survey using receivers from the Global Navigation Satellite System (GNSS) GPS and incorporating bathymetric data for Port Foster. The height differences between the GPS ellipsoidal WGS84 heights and the orthometrical m.a.s.l. heights (undulation (N)) were calculated at about 13 m (Smellie et al. Reference Smellie, López-Martinez, Headland, Hernández-Cifuentes, Maestro, Miller, Rey, Serrano, Somoza, Thomson and Thomson2002, p. 8).
As mentioned earlier, in 2003 the Astronomy, Geodetics and Cartography Laboratory at the University of Cadiz (Spain) commissioned the acquisition of a Quickbird image for Deception Island. The image was taken in January of 2003, with 0% cloud cover. For the orthorectification process multiple control points were collected during the 2002–03 and 2003–04 research seasons, the co-ordinates being based on the REGID GPS network (Berrocoso et al. Reference Berrocoso, Fernandez-Ros, Torrecillas, Enriquez de Salamanca, Ramirez, Pérez-Peña, González, Páez, Jiménez-Teja, García-García, Tarraga and García-García2006, Reference Berrocoso, Fernández-Ros, Ramírez, Enriquez de Salamanca, Torrecillas, Pérez-Peña, Páez, García-García, Jiménez-Teja, García-García, Soto, Gárate, Martín-Davila, Sánchez-Alzola, De Gil, Fernández-Prada and Jigena2008). The image was used to plot an updated planimetry of the island in collaboration with the CGE, and this was published in 2006 (CGE 2006). The new map of the island has better defined contour lines and a higher level of detail, making it almost compatible with a 1:5000 scale map, but its m.a.s.l. and elevation data are from 1992.
Although updated information about the island was available, volcanic landforms are still subject to rapid geomorphic processes even outside periods of volcanic activity, mainly attributable to thawing and erosion. In 2006, with these rapid changes in mind, ‘Real Time Kinematic’ techniques were employed to collect GPS data on the six craters which had appeared during the 1970 eruption as highly visible landmarks. No data were recorded for the seventh, largest, crater located further to the east (see Fig. 4b) because it has become totally back-filled by glacier ice and its outline is almost completely obscured (Fig. 4a). The data collected comprised 27 points at the base of each crater and several more points along its rim. Both planimetric and altimetric recordings were accurate down to within 4 mm.
To incorporate these data in the 2003 CGE map, the ellipsoidal WGS84 height given by the GPS had to be transformed into an orthometric m.a.s.l. height. The Deception Island geoid (Berrocoso et al. Reference Berrocoso, Enriquez De Salamanca, Ramírez, Fernández-Ros and Jigena2007) gave a mean value of undulation (N) of -19.59 m in that area (Fig. 5), and this value had to be added to the ellipsoidal height to obtain a geoidal and orthometric m.a.s.l. height. The value differed from the -13 m established in the topographical survey in 1992 by 6 m. To retain the m.a.s.l. of the 2003 CGE map and compare changes in elevation, we had to add these 6 m to the orthometric height obtained from the new 2006 GPS points.

Fig. 5 Undulation (N) of Deception Island geoid.
Volumetric variations in the 1970 land volcanic craters area: 1968–2006
Before the numerical subtraction, we obtained the error of the comparative analysis of the DEMs. It must be remembered that the errors in Brecher's DEM were estimated at ± 7 m for the final planimetric error and at ± 3 m for the final altimetric error, and the errors calculated for the 2003 CGE DEM were ± 5 m for planimetric error and ± 3 m for altimetric error. These values decreased the expected accuracy of our calculations. For differences with the situation prior to 1992 our study assumed an altimetric error of ± 10 m as a reliable initial value for comparative purposes. For comparison with the 2006 GPS values, the revision was limited to the error in the CGE map, ± 3 m, because that of the GPS field data was insignificant.
The island's geodynamics over the last 36 years would display a planimetric displacement of 0.5 m at a mean planimetric deformation rate of 1.3 cm yr-1. This is well within the maximum planimetric error parameters of ± 5 m allowed by the 2003 CGE map, and was therefore ignored. The mean altimetric deformation rate for the last fifteen years is -5 cm yr-1. If this value had been maintained from the most recent eruption in 1970, by 2006 it would have represented a height loss of 1.8 m. In this case this loss constitutes part of the starting data error, but in future calculations using more accurate data it will have to be taken into account.
After the numerical substractions of DEM, the main factors to analyse, which contribute to the destruction of a crater, are the nature and strength of the volcanic substrate, the climate, magma pathways, the crater's height, landslides and erosion (Tibaldi et al. Reference Tibaldi, Corazzato, Kozhurin, Lagmay, Pasquarè, Ponomareva, Rust, Tormey and Vezzoli2008). In the area being studied, the climate, landslides or ice flow and erosion were identified as the most important factors to be considered, because the 1970 craters there are not very high (< 64 m, according to 2006 GPS points, Table I, the difference between the rim maximum elevation and the floor elevation in V3 crater), the walls are composed of poorly consolidated and crudely stratified older pyroclastic material (Shultz Reference Shultz1972) and the eruptions which caused them generated only ash, not lava flows. No lateral collapses or collapses due to volcanic processes associated with tectonic stress are evident in the photographs and satellite image of the area (Fig. 6). Neither was the 1970 craters zone affected by the lahars/Jokulhlaup from the 1969 eruption: according to Roobol (Reference Roobol1982) it is located in an area in which the risk of this type of process is low. What can be seen is land shift and ice flow in the V7 crater (Fig. 4) with widespread wind modification of the ash surface, and some major displacements can be quantified in the DEMs being compared.
Table I Some morphometric aspects of the 1970 craters in 2006: mean diameter and mean height.

*This crater rim is connected to another crater, so the value is lower than if the crater was separate.

Fig. 6 View of crater V5 from the south, looking in a NNW direction. At the rear, crater V3.
The numerical subtraction of elevation between 1970 and 1992 (2003 CGE map) (Fig. 7b) clearly revealed the great height changes which had taken place over 20 years. Gains were shown in 93.7% of the area with data. In 50.9% of cases these were greater than +25 m, the main gains in elevation being in zones near to craters. Values over +50 m were mainly found in the quick filling of the largest volcanic crater (V7) which appeared in 1970 with three quarters of the crater wall composed of glacier ice in a glacier ice tongue (Shultz Reference Shultz1972). We estimate its fill volume as 8.6 x 10⁻³ km3, comprising core material from the glacier that slid into position within a few years of the eruption and, to a lesser extent, material dragged down during thawing in the southern summer. A height loss of between 0 and -25 m can be seen on the upper elevations (Fig. 7b). A slight gain in material can also be seen to the south-east (light green area), where a small hill was formed. This hill appears in the 1968 Brecher map (Fig. 4c) and is identified in the 2003 GCE map (Fig. 4a), but is missing from that plotted in 1970, the reason being that the contour lines in this zone were erroneously interpolated (dashed line, Fig. 4b) by Brecher. Despite the plume covering the area, mentioned earlier, part of the difference in volume in craters V1, V2, V3 and V5 is reflected (Fig. 7b). Note the loss of material in the V3 and V5 crater floors with values below -14 m and a mean value of -7 m. As this fell within our assumed altimetric error of ± 10 m, we ruled out this data.
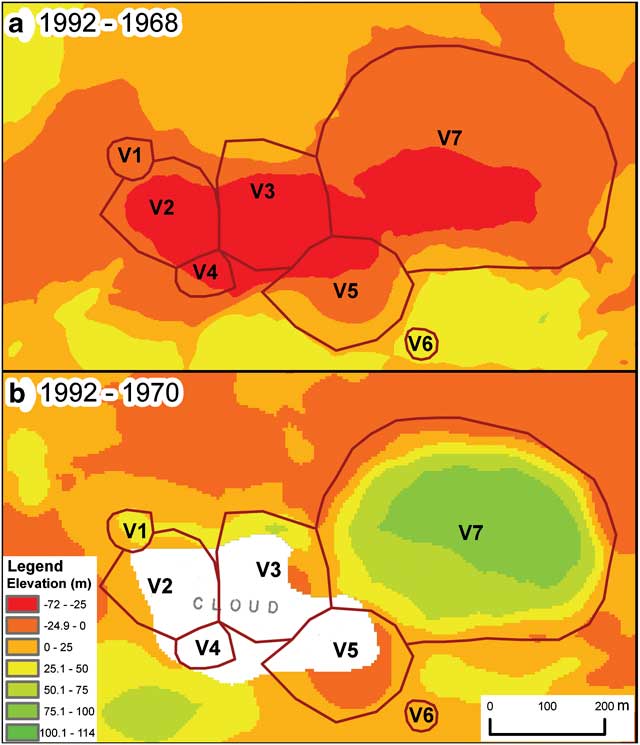
Fig. 7 Elevation differences in the 1970 volcanic craters area between a. 1968–92, and b. 1970–92.
Comparative analysis of the maps from 1968–92 (Fig. 7a) clearly shows (red and dark orange zones) the losses of material which have occurred along the morphological lineations during the last eruptive process 1968–70 (Fig. 2). These main losses occurred in the centre of the new craters, above all in the most central craters V2 and V3 where they exceeded 50 m. Almost 35% of the area displays evidence of material loss, while outside this morphological lineation gains can be seen (yellow area) which are in part due to the deposition of ash from the eruption (Fig. 7a). Gains lower than +25 m were seen in 56% of this yellow area.
The incorporation of 2006 GPS points into the new 2003 CGE map also revealed major changes from 1992 (Fig. 8a). These were fundamentally gains in 92% of the studied area, like on the crater walls and floor (light yellow and light and dark green areas) (Fig. 6), with a mean sedimentation rate of 1 m yr-1 and σ = ± 0.5 m and RMS ± 0.3 m. In the case of craters V3 and V5 the gains were greater than +20 m, dark green area, and the sedimentation rate rose to 1.5 m yr-1 (Fig. 8b). These two craters are the closest to V7 and the ice-tongue glacier, and may have been affected by movement of the upslope glacier ice, above all V5. Material losses occurred mainly along the higher rim, as in crater V3 with values of up to -17 m and a mean erosion rate of -0.2 m yr-1 and σ = ± 0.1 m, without the losses found in craters V1 and V6, unforeseen and partly justified by the lack of detail in the 1:25 000 CGE map (Fig. 8a). The map's contour lines do not show these smaller craters, and they are therefore not visible in the DEM either. We discarded these craters in the computation of rates (Fig. 8b). Table I shows some morphometric values of the craters from the 2006 GPS data, such as mean perimeter and mean height, for future studies.

Fig. 8 1992–2006 study of the 1970 volcanic craters area. a. Height differences, and b. erosion/sedimentation rate in m yr-1.
Table II shows the volumetric differences in the landscape of part of the 1970 volcanic crater area. The data given for the six craters shown in Fig. 8 covers only 1968, 1992 and 2006 because the information for 1970 is incomplete and the fill volume of V7 has already been calculated as 8.6 x 10⁻³ km3.The appearance of the craters in 1970 resulted in a loss of 2.9 x 10⁻³ km3, according to the numerical subtraction between 1968 and 1992. The increase in volume from then on is manifest. Up until 2006 the gain was estimated at 1.5 x 10⁻³ km3, due mainly to the accumulation of material on the crater floor and the ongoing filling process (Fig. 6) that also increased the surface smoothness and the 3D area of the crater's landscape (Table II).
Table II Balance of superficial and volumetric variations from 1968–2006 in the six craters at the 1970 volcanic craters area.

The volumetric differences are so significant that an attempt was made to find studies which would justify the values obtained. Research into volcanic erosion usually focuses on the erosion of old deposits from big eruptions. More specifically, data for erosion rate on active to dormant volcanoes (Rapprich et al. Reference Rapprich, Cajz, Košťák, Pécskay, Řídkošil, Raška and Radon2007) indicate a rate of up to 1 m kyr-1 depending on climate, a negligible value in comparison with that of over 1 m yr-1 for gains and losses in recent pyroclastic material in the area being studied. Lavigne (Reference Lavigne2004, p. 1050) quantified the erosion from small-scale volcanic eruptions in the volcanoes of Merapi and Seremu (Java, Indonesia), during the 1994 eruption, as a 60% loss of new material over the following six months. This is helpful insofar as it suggests a greater loss of material in the years following the erosion, although no data is available regarding exactly when. With regard to the influence of the climate, volcanic erosion is greater in humid climates than in any other climate (Karàtson et al. Reference Karàtson, Thouret, Moriya and Lomoschitz1999), but Deception Island's mean annual rainfall equivalent of 500 mm does not correspond to an extremely humid climate and we therefore do not consider climate an important factor. The wind force of up to 100 km h-1, mainly from the west (> 50% of winds, Smellie et al. Reference Smellie, López-Martinez, Headland, Hernández-Cifuentes, Maestro, Miller, Rey, Serrano, Somoza, Thomson and Thomson2002), recorded by the weather stations on the island is relevant and will have been the cause of some of the height variations found, but again we doubt that its erosion/accumulation factor will be anywhere near the detected sedimentation rate of over 1.5 m yr-1 between 1992 and 2006 (V3 and V5 crater floors) or the erosion rate of over -0.5 m yr-1 in the V3 rim (Fig. 8b). The results of Cooper et al. (Reference Cooper, Smellie and Maylin1998) with bathymetric records in Port Foster showed marine sedimentation rates significantly higher, exceeding 0.4 m yr-1 close to our study area and related to the local input of unconsolidated tephra enhanced by eruptive activity, thus supporting our high accumulation rates.
Conclusions
Dramatic morphological changes due to volcanic activity have been studied with 3D GIS methodologies applied to historical maps. The numerical modelling of landforms makes it possible to estimate volumetric changes related to external (erosion rates) and internal (volcanic eruptions) processes.
This study is focussed on the 1970 volcanic craters area, a part of the last active zone of the Deception Island volcano. The maps used are those of Brecher of 1968 and 1970, the current Spanish CGE map of 2003 and new GPS data acquired in 2006.
Our analysis revealed considerable landform modification processes mainly associated with landslide-induced accumulation and erosion due to thawing top ice and wind. During the nearly 40 years covered by the study, two cartographic inaccuracies have been detected (the missing hill in the 1970 Brecher map and the ignoring of craters V1 and V6 in the 2003 CGE map) but major height differences of over ± 25 m have been revealed. With regard to land shift and ice flow, we identified the most important process as the filling of crater V7 with glacial core material (8.6 x 10⁻³ km3) that slid into position within a few years of the eruption. The mean fill rate obtained for the six craters in 1992–2006 was 1 m yr-1 and the mean erosion rate -0.2 m yr-1. We believe the fill rate is important and, if extrapolated, may indicate the craters’ fill over the next 30–40 years, especially crater V5, where the maximum rim height is 75.4 m and the sedimentation rate on the crater floor is over 1.5 m yr-1.
This study has clearly revealed the need for a more up-to-date mapping of the island which will allow improved monitoring of its surface changes and help us to define and quantify the geomorphological processes taking place there.
Acknowledgements
This geodetic research has been carried out with the support of the Spanish Ministry of Education and Science as part of the National Antarctic Program: “Volcanotectonic activity on Deception Island: geodetic, geophysical research and remote sensing on Deception Island and its surrounding area (VOLTEDEC, CGL2005-07589-C03-01/ANT)”, “Geodetic Control of the volcanic activity on Deception Island (CONGEODEC, CGL2004-21547-E)”, “Geodetic monitoring of the volcanic activity on Deception Island (SEGAVDEC, CGL2007-28768-E/ANT)” and “Geodetic and geothermal research, time serial analysis and volcanic developments in Antarctica (South Shetland Islands and Antarctic Peninsula) (GEOTINANT, CTM2009-07251)”. We would also like to acknowledge the collaboration and cordiality of the Spanish CGE and its support for Spanish Antarctic research. Reviews by Paul Cooper and John Smellie were much appreciated.


