


Introduction
The geoid is a vertical reference system. It can be obtained by combining GPS and gravimetric observations with orthometric heights. The evaluation of the volcanic surface deformation parameters is made by analysing the horizontal and vertical deformation models obtained from GPS observations. However, the lack of physical meaning of the ellipsoidal height makes it necessary to establish a physical and mathematical reference framework, in this case the geoid, in order to calculate accurate vertical deformations. The geoid, together with digital elevation models, constitute the main reference system for designing models of lava flow to determine a hazard map and identify risk areas in advance.
The Spanish and Argentinean bases on Deception Island have contributed to research groups. These countries have systematically conducted monitoring of the volcanic and tectonic activities on Livingston and Deception islands (South Shetland Islands, Fig. 1). In 1988, the first stations of the Red Geodésica de Isla Decepción (REGID) geodetic network were established in order to study the geodynamic activity on the Deception volcano and its environment (Berrocoso et al. Reference Berrocoso, Fernández-Ros, Torrecillas, Enríquez De Salamanca, Ramírez, Pérez-Peña, González, Páez, Jiménez-Teja, García-García, Tárraga and García-García2006; Fig. 2). This monitoring detected two important volcanic crisis on active Deception Island in December and January 1991, and in January and February 1999.

Fig. 1 Maps showing a. the study area (red polygon) and b. Livingston and Deception islands. The red stars indicate the locations of the DECMAR and LIVMAR tidal gauge stations.

Fig. 2 The REGID network.
In 1992, a topographical map was produced of Deception Island establishing an initial geoid undulation (N) value of -13.00 m (CGE 1992). The first experimental geoid for Deception Island, included in the Multidisciplinary Scientific Information Support System (SIMAC) for Deception Island (Torrecillas et al. Reference Torrecillas, Berrocoso and Garcia2006, Berrocoso et al. Reference Berrocoso, Fernández-Ros, Ramírez, Enríquez De Salamanca, Torrecillas, Pérez-Peña, Páez, García-García, Jiménez-Teja, García-García, Soto, Gárate, Martín-Dávila, Sanchez-Alzola, De Gil, Fernández-Prada and Jigena2008), was calculated according to this elevation reference for the BARG geodetic benchmark (Fig. 3), providing a mean N value of -19.59 m in that area in 2008 (Berrocoso et al. Reference Berrocoso, Fernández-Ros, Ramírez, Enríquez De Salamanca, Torrecillas, Pérez-Peña, Páez, García-García, Jiménez-Teja, García-García, Soto, Gárate, Martín-Dávila, Sanchez-Alzola, De Gil, Fernández-Prada and Jigena2008, Reference Berrocoso, Torrecillas, Jigena and Fernández-Ros2012). This value differed from the 1992 value by 6.59 m.

Fig. 3 Relationship between the geoid, ellipsoid and topographical surface, according to variables of Eq. (2).
The first sea level observations at Deception Island were made by the Argentine Naval Hydrographic Survey (Servicio de Hidrografía Naval) in 1970. Tidal data were obtained over five days in summer, by means of a visual tide staff located close to the BARG geodetic benchmark at the Argentinean Deception Station. During the 2001–02 and 2002–03 Spanish Antarctic campaigns, the Red de Nivelación de Isla Decepción (RENID) levelling network was established determining the first vertical datum for Deception Island, taking the BARG geodetic benchmark as a fundamental levelling point, with an orthometric height value of 2.55 m above mean sea level (a.m.s.l.). This orthometric level was translated by geometric levelling to the LN00, the new fundamental levelling point of the RENID network, with a value of 5.43 m a.m.s.l. (Fig. 4). From this vertical datum, levelling elevations were given at all points of the RENID network (Berrocoso et al. Reference Berrocoso, Fernández-Ros, Ramírez, Enríquez De Salamanca, Torrecillas, Pérez-Peña, Páez, García-García, Jiménez-Teja, García-García, Soto, Gárate, Martín-Dávila, Sanchez-Alzola, De Gil, Fernández-Prada and Jigena2008). Gravimetric observations were carried out at these points and at other locations around Port Foster, with a total of 108 gravimetric points, in order to establish the Red Gravimétrica de Isla Decepción (REGRID) gravimetric network (Fig. 5). These were not the first gravimetric measures carried out on the Island, as previous readings were carried out in the summer of 1999/2000 (Carbó et al. Reference Carbó, Muñoz-Martín, Dávila, Catalán and García2001), as a response to the seismic crisis in 1999.

Fig. 4 The RENID levelling network.

Fig. 5 The REGRID network.
Since 2007, the Laboratory of Astronomy, Geodesy and Cartography of the University of Cádiz (LAGC-UCA) has been carrying out new geometric levelling, trigonometric linkages, GPS observations and observations of tidal data on Livingston and Deception islands. During the 2007–08 Spanish Antarctic campaign, two tidal gauges were installed in order to obtain the first tidal constituents and mean sea level for Livingston and Deception islands. The first, LIVMAR, was installed on Livingston Island at Johnsons Dock, near the BEJC geodetic point (Fig. 1), and the second, DECMAR, on Deception Island at Colatinas Point.
In 2011, the first results of direct observations of mean sea level were obtained (Vidal et al. Reference Vidal, Berrocoso and Fernández-Ros2012). Subsequently, better results have been obtained in the determination of the mean sea level in Livingston and Deception islands, making a new adjustment with a two-year time series and calculating a new control value of the orthometric height for LN00 geodetic benchmark of 6.20 m a.m.s.l. (Jigena et al. Reference Jigena, Vidal and Berrocoso2014). A suitable determination of the mean sea level significantly influences the determination of the geoid (Reyes et al. Reference Reyes, Nagai, Kamiya, Tipdecho and Ninsawat2015). For that reason, these data have been fundamental for the accurate determination of a new local geoid for Deception Island. GeoiDEC2014 is the result of the present work, which shows an improvement relative to the results obtained in 2008.
Regional setting
Deception and Livingston islands are part of the South Shetland Islands archipelago, the northernmost extremity of Antarctica (Fig. 1). Separating these islands from the Antarctic Peninsula is Bransfield Strait, which represents one of the most interesting geodynamic regions in Antarctica due to the convergence of several tectonic plates. The strait is c. 120 km wide and c. 500 km long running in a NE–SW direction between latitudes 60°S and 63°S. It is an active marginal basin occupied by six volcanic edifices aligned approximately along the main direction of the basin (Gracia et al. Reference Gracia, Canals, Farranz, Sorribas and Pallas1997). This strait is bounded to the south-east by a ridge and to the north-west by a former trench.
Deception Island is an active volcanic island younger than 0.75 Ma (Valencio et al. Reference Valencio, Mendía and Vilas1979). The volcanic sequence that built up Deception Island evolved from submarine pillow lavas to subaerial eruptions, mainly Strombolian and phreatomagmatic (Martí et al. Reference Martí, Vila and Rey1996, Smellie Reference Smellie2001, Smellie et al. Reference Smellie, López-Martínez, Thomson and Thomson2002, Maestro et al. Reference Maestro, Somoza, Rey, Martínez-Frías and López-Martínez2007). The island evolved through the collapse of a huge volcanic edifice under a regional stress. The present landscape shows a horseshoe-shaped island with a flooded, well-developed, collapsed caldera of 9–10 km diameter called Port Foster (Fig. 6). Port Foster opens onto Bransfield Strait through a shallow and narrow sill called Neptunes Bellows. Historic volcanism on Deception Island principally affected the inner rim of the volcanic caldera and was associated with fractures with regional orientations NNW–SSE and NE–SW (Martí et al. Reference Martí, Vila and Rey1996). The caldera boundary and the collapsed scarp have affected pre-caldera deposits and the location of post-caldera eruptive centres and cinder cones (Smellie Reference Smellie2001, Reference Smellie2002, Smellie et al. Reference Smellie, López-Martínez, Thomson and Thomson2002). Eruptions at high elevations were Strombolian with small magma volumes. The duration of these eruptions are unknown, with some small lava flows which flowed towards Port Foster. Eruptions at lower elevations were principally phreatomagmatic and produced tuff cones and maars. Historical eruptions took place in 1839, 1842, 1912, 1917, 1967, 1969 and 1970 (Smellie et al. Reference Smellie, López-Martínez, Thomson and Thomson2002; see Fig. 6).

Fig. 6 Map showing the simplified geology of Deception Island (after Smellie et al. Reference Smellie, López-Martínez, Thomson and Thomson2002) and the locations of historical eruptions.
Livingston Island is the second largest of the South Shetland Islands archipelago at c. 70 km long and varing from 4–32 km wide in an E–NE to W–SW direction. Livingston Island has no volcanic activity.
Methodology
The developed method consisted of the determination of the geoid undulation (N) from the difference between ellipsoidal height (h) directly obtained by means of GPS observations and orthometric height (H), obtained by geodesic levelling (geometric or trigonometric) and corrected with gravity measurements (Heiskanen & Moritz Reference Heiskanen and Moritz1967, Berrocoso et al. Reference Berrocoso, Gárate, Martín-Dávila, Fernández-Ros, Moreu and Jigena1996). This methodology was used because it is easy to implement computationally, is quite rigorous and demanding regarding input data, and also offers the best results in areas with a radius of<50 km (Leick Reference Leick2004). As opposed to other methodologies, such as the Remove-Restore method, provided there is sufficient data densification to guarantee the quantity and quality.
Using the geometrical relationship between the geoid undulation (N), the ellipsoidal height (h) and the orthometric height (H), obtained from geometric levelling and corrected for gravimetric effects, the geoid undulations are calculated by means of the well-established formula:
 $$h\,{\equals}\,H{\plus}N.$$
Viewing Fig. 3, considering that the study area is relatively small and starting from a point P i with a known orthometric height (H Pi ), the following point P j is considered to be sufficiently close so as to directly unite them by means of a single section of levelling; in short, to obtain the value of the orthometric height of a point P j (H Pj ) knowing the orthometric height at a point P i , the difference of level between both points, and the value of the gravity at these points, the following equation is used (Berrocoso et al. Reference Berrocoso, Gárate, Martín-Dávila, Fernández-Ros, Moreu and Jigena1996, p. 92–93):
 $$\eqalignno{&0.0424\,{\asterisk}\,10^{{{\minus}3}} H_{{P_{j} }}^{2} {\plus}\overrightarrow{{g_{{P_{i} }} }} H_{{P_{j} }} \cr &\quad{\minus}\left( {\overrightarrow{{g_{{P_{j} }} }} \Delta n_{{P_{{i,j}} }} {\plus}\overrightarrow{{g_{{P_{i} }} }} H_{{P_{i} }} {\plus}0.0424\,{\asterisk}\,10^{{{\minus}3}} H_{{P_{i} }}^{2} } \right)\,{\equals}\,0.$$
The orthometric height
 $H_{{P_{j} }} $
of the point P
j
can be calculated from the orthometric height
$H_{{P_{j} }} $
of the point P
j
can be calculated from the orthometric height
 $H_{{P_{i} }} $
of the reference point P
i
, the geometric level difference
$H_{{P_{i} }} $
of the reference point P
i
, the geometric level difference
 $$\Delta n_{{P_{{i,j}} }} $$
between P
i
and P
j
and the values of the absolute gravity,
$$\Delta n_{{P_{{i,j}} }} $$
between P
i
and P
j
and the values of the absolute gravity,
 $\overrightarrow{{g_{{P_{i} }} }} $
and
$\overrightarrow{{g_{{P_{i} }} }} $
and
 $$\overrightarrow{{g_{{P_{j} }} }} $$
, at these points.
$$\overrightarrow{{g_{{P_{j} }} }} $$
, at these points.
Equation (2) is of the second order and provides the orthometric height of P j . Although this equation has two solutions, only one will be a valid value, the other value will be mathematically unsound.
The following values were used in the calculation of the complete development performed to obtain Eq. (2):
 $$\gamma _{0}^{{45^{\circ}}} $$
=980629.388 mGal, the normal gravity value at sea level at a latitude of 45°, which is approximate for the WGS84 reference ellipsoid, k=6.67 × 10⁻¹¹ Nm2 kg-2 in SI units, k is the gravitational constant, and ρ=2670 kg m-3 the density of the crust.
$$\gamma _{0}^{{45^{\circ}}} $$
=980629.388 mGal, the normal gravity value at sea level at a latitude of 45°, which is approximate for the WGS84 reference ellipsoid, k=6.67 × 10⁻¹¹ Nm2 kg-2 in SI units, k is the gravitational constant, and ρ=2670 kg m-3 the density of the crust.
The value used for ρ corresponds to the average value of continental crustal that was used by Carbó et al. (Reference Carbó, Muñoz-Martín, Dávila, Catalán and García2001) for the correction of the gravimetric readings in the terrestrial part of Deception Island.
The associated errors at each point were obtained by applying the errors propagation law to the method for geoid determination, where the variance of N is equal to the sum of the variances of h and H. Thus, the total error becomes:
 $$\sigma _{N} \,{\equals}\,{\left[ {\sigma _{h}^{2} \,{\plus} \,\sigma _{H}^{2} } \right]}^{1\,/\,2} ,$$
where the ellipsoidal height error is obtained from the GPS data processing and the orthometric height error is calculated by means of the following expression:
 $$\ealign{{\left \sigma _{{H_{{P_{j} }} }} {\equals}\displaystyle{1 \over {R_{{i,j}} }}{\Bigg[{\left( {{{R_{{i,j}} {\minus}\overrightarrow{{g_{{P_{j} }} }} {\plus}0.848\, \cdot \,10^{{{\minus}4}} \Delta n_{{P_{{i,j}} }} } \over {0.848\, \cdot \,10^{{{\minus}4}} }}\sigma _{{g_{P} _{{_{j} }} }} } \right)}^2}}} \atop\displaystyle\quad{\plus}{\left( {\overrightarrow{{g_{{P_{j} }} }} \cdot \sigma _{{\Delta n}} _{{_{P_{i,j}} _{{_{} }} }} } \right)}^2 {\plus}{\left( {H_{{P_{i} }} \, \cdot \,\sigma _{{g_{P_{i}} _{{_ }} }} } \right)}^2 \atop\displaystyle\ \ \ \ \ \quad{\plus}{\left( {\left( {\overrightarrow{{g_{{P_{i} }} }} \,{\plus} \, 0.848\, \cdot \,10^{{{\minus}4}} } \right)\sigma _{{H_{{P_{i} }} }} } \right)}^2 \Bigg]^{1/2}, } \right}\eqno {\vskip 40pt (4)}$$
with P i being the reference point and known orthometric height and P j the computation point. The value of R i,j is equal to:
 $$\eqalignno{ {\left {{R_{{i,j}} \,{\equals}\,\Big[{\left( {\overrightarrow{{g_{{P_{j} }} }} } \right)}^2 {\plus}1.696\, \cdot \,10^{{{\minus}4}}\Big({\left( {\overrightarrow{{g_{{P_{j} }} }} } \right)}^2 \, \cdot \,\Delta n_{{P_{{i,j}} }} {\plus}g_{{P_{i} }} \atop \qquad \qquad \qquad\cdot \ H_{{P_{i} }} {\plus}0.424\, \cdot \,10^{{{\minus}4}} H_{{P_{i} }}^{2}\Big)\Big]^{1/2}. \ \qquad \qquad (5)$$
In the calculation of errors, the error obtained in the determination of the mean sea level at both tide gauge stations was taken as follows. At Deception Island, taking into account COLA geodetic benchmark, for which the error was±0.051 m from DECMAR Station. This error was added to the levelling error between COLA and LN00, obtaining an initial error of 0.088 m for the benchmark LN00. All of the points of the RENID network were propagated from this vertex. In the case of Livingston Island, the error at BEJC was±0.084 m from LIVMAR tidal station and propagated to the other two points on this island, BEJ1 and TOJO.
Equipment, data acquisition and data processing
In order to determine the experimental geoid, it was necessary to have a complete set of data consisting of GPS observations, levelling data and gravimetric measurements. The data used pertain to the LAGC-UCA taken during the 1989–90 to 2012–13 Spanish Antarctic campaigns. The global navigation satellite system (GNSS)-GPS gravimetric and levelling data were acquired for geodesic and geophysical purposes for the establishment of geodetic, levelling and gravimetric networks in the Antarctic, and mainly for the Deception and Livingston islands (Berrocoso et al. Reference Berrocoso, Fernández-Ros, Ramírez, Enríquez De Salamanca, Torrecillas, Pérez-Peña, Páez, García-García, Jiménez-Teja, García-García, Soto, Gárate, Martín-Dávila, Sanchez-Alzola, De Gil, Fernández-Prada and Jigena2008). From the 2007–08 until the 2012–13 campaign, the geodetic networks were updated and extended, weather and tidal data were obtained for the determination of the mean sea level, the geodesic reference framework was updated and new cartography obtained (Torrecillas et al. Reference Torrecillas, Berrocoso, Perez-Lopez and Torrecillas2011, Berrocoso et al. Reference Berrocoso, Torrecillas, Jigena and Fernández-Ros2012, Vidal et al. Reference Vidal, Berrocoso and Fernández-Ros2012, Jigena et al. Reference Jigena, Vidal and Berrocoso2014).
The specific data that is used in the calculation of the geoid of Deception Island must comply with the technical and geodesic specifications that guarantee the quality of such, in particular: i) A geodesic and/or gravimetric network must include all of the geodesic points that were designed and established with this intention and whose data have been collected, processed and adapted under geodesic standards. This is the case for the REGID, RENID and REGRID networks (Figs 2, 4 & 5). ii) Co-ordinates must be referenced to a unique reference system with respect to International GNSS Service (IGS) stations. In our case, GPS solutions were used in ITRF2000.0 co-ordinates (Altamimi et al. Reference Altamimi, Sillard and Boucher2002) for all geodetic points of the REGID, RENID and REGRID network processing with respect to the BEGC fundamental geodetic point at Deception Island. The ITRF2000.00 co-ordinates for the BEJC geodetic point were obtained with respect to the IGS Antarctic reference stations OHI2 and PALM. iii) Orthometric height differences between the points of each network must be obtained. In our case, geometric levelling measurements were made between the stations of the REGID network, the benchmarks of the RENID network and the set of auxiliary gravimetric points of the REGRID network, taking the levelling benchmark LN00 as the reference point. iv) Relative gravimetric values must also be obtained. For Deception Island, relative gravimetric measurements were obtained for the REGID network stations, the benchmarks of the RENID network and the secondary points set. The gravimetric base was GRAV (Fig. 5).
The datasets must be filtered and processed, and the equipment used in this work must be compliant with geodetic specifications, which are briefly described below.
The REGID geodetic network
The REGID geodetic network is formed by 12 stations distributed all around the island (Fig. 2), COLA at Colatinas Point, GEOD in the surroundings of Soto Crater, BEGC near the Spanish Gabriel de Castilla Base, BARG at the Argentinian Deception Station, FUMA at Fumaroles Bay, UCA1 at Obsidian Hill, TELE and BOMB flanking Telephon Bay, CR70 in the area of the craters of 1970, PEND at Pendulum Cove, GLAN in the surroundings of the Black Glacier and BALL at Whalers Bay. The LN00 geodetic benchmark was also included as an elevation reference station for the network (Berrocoso et al. Reference Berrocoso, Fernández-Ros, Torrecillas, Enríquez De Salamanca, Ramírez, Pérez-Peña, González, Páez, Jiménez-Teja, García-García, Tárraga and García-García2006, Reference Berrocoso, Fernández-Ros, Ramírez, Enríquez De Salamanca, Torrecillas, Pérez-Peña, Páez, García-García, Jiménez-Teja, García-García, Soto, Gárate, Martín-Dávila, Sanchez-Alzola, De Gil, Fernández-Prada and Jigena2008). The design and establishment of the network were planned according to Seeber (Reference Seeber2003) and the special characteristics of Deception Island because the topographical conditions restrict the building of stations to areas near the coast.
The REGID geodetic network has been surveyed since 1988 in successive Antarctic campaigns. It has been used for the study of models of horizontal deformation due to the volcanic and tectonic activity on the island (Berrocoso et al. Reference Berrocoso, Fernández-Ros, Ramírez, Enríquez De Salamanca, Torrecillas, Pérez-Peña, Páez, García-García, Jiménez-Teja, García-García, Soto, Gárate, Martín-Dávila, Sanchez-Alzola, De Gil, Fernández-Prada and Jigena2008, Prates et al. Reference Prates, Berrocoso, Fernández-Ros and García2013). The data used to obtain the ellipsoidal heights were obtained between November 2002 and February 2003 (Berrocoso et al. Reference Berrocoso, Fernández-Ros, Torrecillas, Enríquez De Salamanca, Ramírez, Pérez-Peña, González, Páez, Jiménez-Teja, García-García, Tárraga and García-García2006, Reference Berrocoso, Fernández-Ros, Ramírez, Enríquez De Salamanca, Torrecillas, Pérez-Peña, Páez, García-García, Jiménez-Teja, García-García, Soto, Gárate, Martín-Dávila, Sanchez-Alzola, De Gil, Fernández-Prada and Jigena2008).
The GPS data for positioning of benchmarks and stations were taken from Berrocoso et al. (Reference Berrocoso, Fernández-Ros, Ramírez, Enríquez De Salamanca, Torrecillas, Pérez-Peña, Páez, García-García, Jiménez-Teja, García-García, Soto, Gárate, Martín-Dávila, Sanchez-Alzola, De Gil, Fernández-Prada and Jigena2008). The geodetic stations have absolute co-ordinates in X, Y, Z, and latitude (φ), longitude (λ) and ellipsoidal height (h) relative to ITRF2000.00 with millimetre accuracy (Altamimi et al. Reference Altamimi, Sillard and Boucher2002).
Leica GX1230 and TRIMBLE 5700 receivers were employed with an accuracy (RMS) equal to 5 mm+0.5 ppm in horizontal and 10 mm+0.5 ppm in vertical for static surveying (phase) in post-processing and standard antenna. In the first campaign (1989–90) there were 28 days of observation which has since increased to an average of 41 days of observation per campaign.
In order to obtain precision in millimetres, the GNSS-GPS observations were made by the static positioning method with specifications for geodetic surveying according to Seeber (Reference Seeber2003, p. 358–362). For this type of surveying it is necessary to have at least one reference station with known precise absolute co-ordinates. The IGS stations OHI2, located at the Chilean O’Higgins Station (Antarctic Peninsula), and PALM, located at the American Palmer Station (Anvers Island), were used as references in a first step. From these stations the absolute geocentric co-ordinates were obtained for BEGC station on Deception Island and BEJC on Livingston Island. The second step was the processing and adjustment of the co-ordinates of the remaining stations on Deception Island, made with respect to BEGC and BEJC (Berrocoso et al. Reference Berrocoso, Fernández-Ros, Ramírez, Enríquez De Salamanca, Torrecillas, Pérez-Peña, Páez, García-García, Jiménez-Teja, García-García, Soto, Gárate, Martín-Dávila, Sanchez-Alzola, De Gil, Fernández-Prada and Jigena2008). Observation sessions of at least 24 hours were programmed, data were registered with a 1 second sampling rate and the elevation mask was set to 10°. For processing and network adjustment, BERNESE version 5.0 GPS Software (Hungentobler et al. Reference Hungentobler, Schaer and Fridez2001) was used to obtain a relative position of the network, with respect to the BEGC and BEJC reference stations. In data processing IGS precise orbits and pole files were used for the entire procedure. Baselines were processed using the methodology suggested for GPS data processing in Antarctic regions by Bouin & Vigny (Reference Bouin and Vigny2000). The adjusted co-ordinates of the REGID geodetic network are shown in Table S1 (found at http://dx.doi.org/10.1017/S0954102015000681).
The geodetic benchmarks were constructed with concrete, well-rooted in the permafrost with steel bars and a low height above the ground. A 0.05 m stainless steel screw for the benchmark materialization was fixed in the concrete. Moreover, to ensure the correct and known position of the GNSS-GPS antenna centre with respect to the benchmark at each campaign, a laboratory measured prolongation of nearly 0.13 m was applied to attach the antenna, for more details see the scheme presented for REGID points in Prates et al. (Reference Prates, Berrocoso, Fernández-Ros and García2013, fig. 2b).
The RENID levelling network
The RENID levelling network consists of 60 benchmarks and it is divided into six independent levelling lines. The fundamental benchmark is LN00, situated near the Gabriel de Castilla Station. The orthometric height of LN00 was determined by a geometric levelling from the COLA geodetic benchmark, with the orthometric height provided from the works carried out by Vidal et al. (Reference Vidal, Berrocoso and Fernández-Ros2012) and Jigena et al. (Reference Jigena, Vidal and Berrocoso2014). Every line is connected to one of the geodetic stations of the REGID network except levelling line 4, which is connected to the fundamental benchmark LN00. Figure 4 shows the levelling lines and the REGID network which are linked.
Levelling surveys of the RENID networks were carried out during the 2001–02 and 2002–03 campaigns. The geometric levelling was undertaken using a Leica optical level model NA2 with an accuracy of ±0.7 mm km-1 double run levelling. A Leica TPS 403 Total Station was used in the trigonometric levelling and geodetic linkages. The Leica TPS 403 Total Station has a 1'' resolution in angular reading with a standard deviation of 3'' for horizontal and vertical angles, and 2 mm+2 ppm precision in distances over the 3500 m maximum distance with a Leica GPR1 prism. Corrections due to sphericity and refraction effects were applied to the data. The fundamental geodetic benchmarks have the height above mean sea level reference, relative to the COLA geodetic vertex and LN00 benchmark on Deception Island, and relative to the BEJC geodetic vertex on Livingston Island, all of which are referred according to the results obtained by Jigena et al. (Reference Jigena, Vidal and Berrocoso2014). On Deception Island, the orthometric height obtained for COLA was translated to LN00 by geometric levelling, obtaining a closing error of 13.0 mm for 7.209 km over the total levelling distance, within the second order geodetic levelling. The LN00 point has been defined as the fundamental geodetic benchmark of the REGID levelling network in Berrocoso et al. (Reference Berrocoso, Fernández-Ros, Ramírez, Enríquez De Salamanca, Torrecillas, Pérez-Peña, Páez, García-García, Jiménez-Teja, García-García, Soto, Gárate, Martín-Dávila, Sanchez-Alzola, De Gil, Fernández-Prada and Jigena2008). Table S2 shows the obtained levelling data as well as their associated errors (found at http://dx.doi.org/10.1017/S0954102015000681).
The levelling lines are independent and the elevation of the benchmarks, belonging to each line, were obtained by geometric levelling. However, the linkages between the levelling lines were performed by a trigonometric levelling method, taking measurements with a Leica Total Station model TPS-403, except for the linkage between COLA and LN00 which was performed by geometric levelling. The locations of the linkages are shown in Fig. 8 and the results obtained for the different linkages are shown in Table S3 (found at http://dx.doi.org/10.1017/S0954102015000681).
The 48 benchmarks of the RENID network were placed over concrete blocks on volcanic rock. The points over the concrete blocks were made according to a scheme presented for REGID points, with a block size of 0.30×0.30 m. Benchmarks placed on volcanic rock were constructed with a block of epoxy resin with a 0.12 m base and a height of 0.14 m. The resin block was fixed to the rock by a variable height stainless steel screw and the physical materialization of the geodetic reference point on the benchmark is the top of the screw. Figure S1 (found at http://dx.doi.org/10.1017/S0954102015000681) shows the levelling marks of the RENID network fixed on volcanic rocks.
The REGRID gravimetric network
The REGRID gravimetric network was established in 2002–03 using 12 geodetic stations of the REGID network, 50 levelling benchmarks of the RENID network and 46 auxiliary gravimetric points with a total of 108 gravimetric points on Deception Island (Fig. 5). The fundamental gravimetric point on Deception Island was set up to be GRAV (Berrocoso et al. Reference Berrocoso, Fernández-Ros, Ramírez, Enríquez De Salamanca, Torrecillas, Pérez-Peña, Páez, García-García, Jiménez-Teja, García-García, Soto, Gárate, Martín-Dávila, Sanchez-Alzola, De Gil, Fernández-Prada and Jigena2008). Another gravimetric point at Deception Island was TOCO, which is the tidal gauge benchmark (TGBM) for control of the DECMAR tidal station.
The gravimetric points on Livingston Island (BEJC, BEJ1 and TOJO) were also included in the network. BEJC is the fundamental gravimetric point on Livingston Island, BEJ1 is the new geodetic vertex and TOJO is the tide gauge auxiliary benchmarks (TGABs) for the LIVMAR tidal station. The three points on Livingston Island are situated in the surroundings of the Spanish Juan Carlos I Base (Fig. 8).
The gravimetric connection between the South American continent and the South Shetland Islands was conducted in 2002–03. The gravimetric base APPA, located at Punta Arenas (Chile) and pertaining to the Chilean Gravimetric Network, was used as the fundamental gravimetric base. The gravity value taken at APPA was 981320.81 mGal. The connection was made from APPA to BEJC (Livingston Island) and GRAV (Deception Island) geodetic stations (Berrocoso et al. Reference Berrocoso, Fernández-Ros, Ramírez, Enríquez De Salamanca, Torrecillas, Pérez-Peña, Páez, García-García, Jiménez-Teja, García-García, Soto, Gárate, Martín-Dávila, Sanchez-Alzola, De Gil, Fernández-Prada and Jigena2008). The closing of the gravimetric survey was made on the return to South America. The gravity values are shown in Table I.
Table I Gravity values obtained for the link between the South American continent and the gravimetric bases of Livingston and Deception islands.
The fundamental gravimetric point on Deception Island was set up to be GRAV. We included one gravimetric reference point (BEJC) in the network on Livingston Island. Gravimetric measurements were obtained with a Lacoste & Romberg D-203 relative gravimeter, which has a reading precision of±0.01 mGal and a static drift of<1 mGal per month (Berrocoso et al. Reference Berrocoso, Fernández-Ros, Ramírez, Enríquez De Salamanca, Torrecillas, Pérez-Peña, Páez, García-García, Jiménez-Teja, García-García, Soto, Gárate, Martín-Dávila, Sanchez-Alzola, De Gil, Fernández-Prada and Jigena2008). Tides, height and drift corrections were applied to the whole set of gravimetric data. The correction for tides was calculated for an average latitude of Deception Island (γ=62°57'30"), constructing a daily correction curve which was applied with its sign to each reading of the gravimeter. The derived correction was controlled by means of the readings made in the base or reference station at the beginning and end of each circuit, assuming that it is linear given that the time between each circuit was generally less than six hours. The correction was distributed proportionally on each circuit, according to the hour of measurement at the station throughout the circuit, obtained with the sign to apply. The correction for tide and drift was made according to Martín-Furones (Reference Martín-Furones2000). The correction for altitude, due to the variation in the height above mean sea level between the reference point and the measurement station, the Free-Air correction and the Bouguer correction were applied according to that specified by Heiskanen & Moritz (Reference Heiskanen and Moritz1967). Gravimetric values and the estimated errors are displayed in Table II.
Table II REGRID network. Gravimetric measurements and estimated errors (sigma).

The orthometric heights (H) were calculated from the ellipsoid height (h), obtained from the GPS measurements, absolute gravity measurements (g) and the geometric levelling differences (Δn), according to Heiskanen & Moritz (Reference Heiskanen and Moritz1967) and Berrocoso et al. (Reference Berrocoso, Gárate, Martín-Dávila, Fernández-Ros, Moreu and Jigena1996, Reference Berrocoso, Fernández-Ros, Ramírez, Enríquez De Salamanca, Torrecillas, Pérez-Peña, Páez, García-García, Jiménez-Teja, García-García, Soto, Gárate, Martín-Dávila, Sanchez-Alzola, De Gil, Fernández-Prada and Jigena2008).
Sea level measurements were linked to fixed onshore benchmarks by comparing simultaneous readings of the gauges against a previously levelled shore-based tidal staff. Using precise geodetic levelling, the heights of TGBMs were calculated relative to the heights of nearby geodetic stations, COLA and LN00 on Deception Island and BEJC geodetic vertex on Livingston Island, calculating the new values of orthometric height according to the results obtained by Jigena et al. (Reference Jigena, Vidal and Berrocoso2014). The TGBMs TOCO (Deception Island) and TOJO (Livingston Island) were used as benchmarks from which the orthometric levels of nearby geodetic stations, COLA and LN00 at Deception Island and BEJC at Livingston Island, were obtained. The final values of gravimetric measurements on Deception Island are shown in Table II.
Complementary observations
Complementary measurements were carried out on the Deception Island networks in order to use all the stations and benchmarks.
In addition to the GPS observations, levelling and gravimetric measurements, the stations of the REGID network were linked to the RENID network by geometric or trigonometric levelling (see Fig. 7). These stations are thus provided with levelling measurements and the new values were adjusted with respect to the fundamental benchmark LN00 (see Table S2). Similarly, every levelling benchmark is provided with geodetic co-ordinates obtained by static positioning with BEGC as the reference station. Further, every benchmark in the REGRID network is provided with geodetic co-ordinates obtained by GPS, an absolute gravity value and levelling measurements.
The adverse geographical conditions of Deception Island, with glaciers near the shore and the inaccessible outer coast, forced the REGID, RENID and REGRID networks to be developed around the inner bay, not further than 1 km from the coast line (as shown in Fig. 7). In order to spread the observations to the outer area and to make the measurement set more dense, 46 secondary points were also established (Fig. 5) and GPS observations, levelling and gravimetric measurements were obtained for these marks, as shown in Table S4 (found at http://dx.doi.org/10.1017/S0954102015000681).
Every point was positioned in fast-static mode, using a TRIMBLE 5700 dual frequency receiver, while levelling tasks were carried out using a Leica TPS-403 Total Station, as seen for the REGID, RENID and REGRID networks.
Measurements on Livingston Island
On Livingston Island, a new and more accurate orthometric height is provided for the geodetic vertex BEJC, pertaining to the Red Geodésica Antártica Española (RGAE) network and the REGID network. Other geodetic benchmarks on the island are BEJ1 and TOJO. These two points have served to determine the levelling height relative to mean sea level, with respect to BEJC, and to later determine the geoid undulation (N) in the area surrounding the Juan Carlos I Base. Installed in 1987–88, the BEJC geodetic station is the fundamental geodetic point on Livingston Island and pertaining to the RGAE network. A new BEJ1 geodetic vertex was installed to replace the previous one which was affected by the construction of the Juan Carlos I Base. The TOJO geodetic benchmark, which is the TGAB point of control of the LIVMAR tidal station at Johnsons Dock, was also used. For more details of the locations of the geodetic marks see Figs 1 & 8.
In order to establish these three geodetic points, the following specifications were considered: i) The ITRF 2000.00 co-ordinates of the BEJC geodetic point were obtained with respect to the OHI2 and PALM IGS stations. The GPS solutions to be given in ITRF2000.00 co-ordinates for all stations. ii) The co-ordinates for all geodetic points on Livingston Island were processed with respect to the BEJC geodetic vertex and the BEGC fundamental geodetic point at Deception Island. iii) Geometric levelling for BEJ1 and TOJO were taken with respect to the levelling benchmark BEJC as reference point. iv) Relative gravimetric measurements at the stations were set relative to the BEJC gravimetric base.
Tide gauge benchmark control points
The TGBMs for control of tide gauge stations were also used for the geoid calculation. These geodetic benchmarks are COLA and LN00 on Deception Island and BEJC on Livingston Island. The levelling heights relative to mean sea level for COLA, LN00 and BEJC were provided using the TGABs TOCO, located at Colatinas Point (Deception Island), and TOJO, located at Johnsons Dock (Livingston Island). For a more detailed explanation see Vidal et al. (Reference Vidal, Berrocoso and Fernández-Ros2012, fig. 2), Jigena et al. (Reference Jigena, Vidal and Berrocoso2014) and Figs 1 & 8.
The mean sea level results obtained for the geodetic reference stations were 12.42 m a.m.s.l. for BEJC and 29.05 m a.m.s.l. for COLA, and the associated errors were±0.08 m and±0.05 m, respectively (Jigena et al. Reference Jigena, Vidal and Berrocoso2014). The fundamental benchmark on Deception Island was LN00, the orthometric height value of which was 6.20 m a.m.s.l. with an error±0.088 m. These values were taken as fundamentals for the new height calculation and adjustment of the REGID, RENID and REGRID networks, improving their precision. These new values were also used in the calculations and determination of the experimental geoid for Deception Island, GeoiDEC14.
Results
A precise geoid, GeoiDEC14, was obtained for Deception Island, as well as three geodetic benchmarks providing values of geoid undulation (N) for the area around the Juan Carlos I Base and Johnsons Dock. The mean geoid undulations and the estimated errors for GeoiDEC14 and Livingston Island are shown in Tables III & IV, respectively.
Table III Mean geoid undulation (N) and corresponding errors (standard deviation) for GeoiDEC14.

Table IV Mean geoid undulation (N) and corresponding errors (standard deviation) for Livingston Island.
Figure 9 shows the geoid undulation (N) of the experimental geoid GeoiDEC14 at Deception Island.
Figure 10 shows a contour map produced by interpolating these data, as well as the errors, for the whole island using the Spline Tension method, which controls the stiffness of the surface according to the character of the modelled phenomenon creating a less smooth surface with values more closely constrained by the sample data range.
The estimation of errors was made by applying Eqs (3, 4 & 5) and the law of errors propagation. Thus the levelling errors have been added to the error obtained for the determination of mean sea level, which is 0.051 m for the COLA benchmark. The error map (Fig. 10) only shows the error propagation without taking into account errors due to the interpolation technique. The errors in GeoiDEC14, estimated according to Eq. (3), do not exceed 0.19 m and can be grouped into three areas (Table V). Note that the greatest errors were obtained at CR70, Pendulum Cove and Collins Point, while a trend change was observed at Whalers Bay that can be attributed to a better fit network due to mixed linkage (geometric and trigonometric levelling) between the COLA geodetic vertex and the LN604 and BR01 geodetic benchmarks placed near BALL (Whalers Bay; see Fig. 7).
Table V Estimated GeoiDEC14 errors grouped by area of interest.
Furthermore, three points fitted with geoid undulation (N), elevation and GNSS absolute co-ordinates were obtained for the areas surrounding the Juan Carlos I Base and Johnsons Dock. As the points are very close the solution is not relevant for cartographic representation and not sufficient for the determination of a local geoid in this area. The error estimated in the elevation determination regarding mean sea level for BEJC was 0.088 m. This error was extrapolated to all points, adding it to the errors obtained in the geometric levelling. Table IV shows the results of these observations on Livingston Island and the locations of the stations are shown in Fig. 8b.
Discussion
The importance of this work lies in it being the first model of a precise local geoid obtained for the volcanically active Deception Island. The geoid will enable technical and scientific work to be undertaken and to produce results with a high level of precision at the island. The geoid can be used for the calibration of global geopotential models, as well as for the direct determination of orthometric heights, combining the model with GPS observations. Furthermore, the data will be helpful in volcanic deformation models for designing lava flow models to determine hazard maps and identifying or defining risk areas, in oceanography for the control of sea levels, and in direct surveying with GPS and geophysical applications.
For the determination of the geoid of Deception Island, gravity observations were made on the vertices of the REGRID network, which includes all the points of the REGID geodesic network and the RENID levelling network, all with ITRF2000.00 co-ordinates and orthometric heights. To obtain the precise local geoid model, GeoiDEC14, a GPS/levelling/gravity methodology was used, with a total of 108 points available on Deception Island distributed homogenously in the interior part of the island around Port Foster. These points have an average value in geoid undulation (N) of 18.83 m, with a maximum of 19.49 m and minimum of 18.05 m.
Three further points were measured on Livingston Island with an average of 18.87 m, similar to that of Deception Island, giving validity to the results.
The geoid heights were obtained from several global geopotential models in order to present and analyse the differences with respect to the experimental geoid GeoiDEC14. The EGM96 (Lemoine et al. Reference Lemoine, Kenyon, Factor, Trimmer, Pavlis, Chinn, Cox, Klosko, Luthcke, Torrence, Wang, Williamson, Pavlis, Rapp and Olson1998), EGM2008 (Pavlis et al. Reference Pavlis, Holmes, Kenyon and Factor2012), AUIB-GRACE03s (Pail et al. Reference Pail, Goiginger, Schuh, Höck, Brockmann, Fecher, Gruber, Mayer-Gürr, Kusche, Jäggi and Rieser2010, Fecher et al. Reference Fecher, Pail and Gruber2015), ITSG-Grace2014s (Mayer-Guerr et al. Reference Mayer-Guerr, Zehentner, Klinger and Kvas2014) and a local experimental geoid of Deception Island obtained in 2007, DEC2007 (Berrocoso et al. Reference Berrocoso, Fernández-Ros, Torrecillas, Enríquez De Salamanca, Ramírez, Pérez-Peña, González, Páez, Jiménez-Teja, García-García, Tárraga and García-García2006) were selected. Figure 11 shows the comparisons according to interpolated data obtained from a grid of 0.001° using the tools of the Calculation Service of the International Centre for Global Earth Models (ICGEM). GeoiDEC14 has been introduced in Fig. 11c & f to show its influence in the EGM08 and ITSG-Grace2014s geoids. GeoiDEC14 reduces the undulation value of the geoid in some areas to values of 18 m (dark pink colour in Fig. 11), a value not reached in any of the studied global geoids.
Specifically, this comparison shows a maximum difference of the minimum N value, determined at the observed points, of c. 2.50 m with respect to the previous global models EGM96, EGM08 and AUIB-Grace03s (Fig. 11a, b & d) and 1.90 m with respect to the most modern DEC2007 and ITSG-Grace2014s (Fig. 11e), see Table VI. The maximum values also differ between both groups, with the maximum value in our geoid between 0.81 m and 1.12 m lower with respect to EGM96, AUIB-Grace03s and EGM08, and increasing to±0.32 m with respect to ITSG-Grace2014s and DEC2007.
Table VI Statistical summary of N, in metres, for global geopotential models and DEC2007 versus GeoiDEC14. ES_Max and ES_Average is the result of effect size (ES) analysis.
GeoiDEC14 generally presents lower N values compared to the other geoids, and in all cases the maximum value of GeoiDEC14 is lower than the mean for the other geoids (Table VI). Furthermore, the difference relative to GeoiDEC14 for the global models ranged from -1.81 m to -0.82 m, showing a better fit for GeoiDEC14 with the latter two models. The standard deviations remain very similar in all of the global models.
The relatively small difference (0.82 m in Table VI) with respect to the DEC2007 experimental model may be due to the use of the same methodology in this model but with fewer data; DEC2007 also lacked a vertical reference level (mean sea level). The new data presented here were obtained with greater precision. With respect to the closeness of GeoiDEC14 to ITSG-Grace2014s, this could be due to the higher resolution of this model (200 order). The comparison shows a significant level of improvement in the accuracy of our model with respect to the global models and the previous experimental model in the local area.
When the global models are compared to the EIGEN6C4 geoid, the latest geoid offered by the German Research Centre for Geoscience (GFZ), the difference does not exceed 0.15 m for EGM08 (160 order), 0.30 m in the worst case for ITSG-Grace2014s (200 order) and 0.05 m for AIUG-Grace03s (160 order). The reference data, which GFZ offers with respect to 12 224 GPS-levelling points (from Canada, the USA, Europe, Japan and Australia), present an RMS of 0.43 m, 0.66 m, 0.24 m and 1.05 m for EGM96, AIUG-Grace03s, EGM2008 and ITSG-Grace2014s, respectively. These RMSs are lower than the differences shown in Table VI for the different models, so there is another reason for these values. The best adjustment with ITSG-Grace2014s is due to the high resolution of this geopotential model, which is the last one made available to the scientific community and has GRACE data of more than 10 years for its determination. The model also includes data on the atmosphere and the oceanic mass. Therefore, a higher resolution global model could reduce the difference.
An effect size (ES) analysis (Ledesma et al. Reference Ledesma, Macbeth and Cortada2008) was carried out on the comparisons made for the different models. The estimation of ES is considered a necessary complementary test of a hypothesis between a model whose validity needs to be proved (M0), in this case our GeoiDEC14 model, and the reference models (M1). The maximum for each of the models, which would be the worst case scenario, and the mean, which would be the most representative value in each model, were taken as study parameters. The models where the ES is smallest would be those that more closely approach our model pattern. For our case, the results indicate that the smallest values correspond to ITSG-Grace2014 and DEC2007, again marking this separation between models and confirming that these are the models with the greater precision and resolution among those compared. They validate the hypothesis that the local geoid model GeoiDEC14 is the most precise geoid model obtained to date for Deception Island.
The comparison of the distribution of the N values in GeoiDEC14, shows that some of the anomalies coincide with hot spots on the island. The minimum values shown in Fumarole Bay and Whalers Bay, which are areas with active fumaroles, or the maximum values found in the remains of lava at Colatinas, Black Glacier or Murature Point are some examples (Fig. 9). These anomalies may be due to the properties of the crust and the density of the ground in the area (Crescentini & Amoruso Reference Crescentini and Amoruso2007).
Finally, a new and more accurate orthometric height and geoid undulation (N) are provided for geodetic stations BEJC and BEJ1, and the tide gauge control station TOJO on Livingston Island. The values are similar to the those obtained for Deception Island. Livingston Island has no volcanic activity, offering very similar N values between the three points, and therefore no anomaly. Although these three values do not allow a geoid to be determined in the area, they do serve as a comparison for values obtained on Deception Island. The results suggest that the crustal structure and mass distribution are broadly comparable on both islands.
Conclusions
A precise geoid model for Deception Island has been derived by means of a direct GPS-levelling technique from a combination of GPS, levelling and gravimetric data in order to obtain geoid undulation data with a greater precision than that obtained previously, including existing global models. The new local model, GeoiDEC14, through greater precision, allows the orthometric heights to be determined directly. Thus, it can be used in geophysical, topographical and oceanographic applications throughout our area of study, mainly in the interior area of the island around Port Foster.
The results of the studies on the mean sea level obtained at the tide gauge stations of LIVMAR (Livingston Island) and DECMAR (Deception Island) have been introduced in the new calculation and adjustment of the REGID, RENID and REGRID, and in the calculation of the new precision geoid of Deception Island, GeoiDEC14. These were the first vertical reference levels obtained on the basis of real mean sea level data taken in situ. The introduction of these new data has provided a highly precise geoid model (maximum error of 0.2 m) and has noticeably improved the precision previously obtained by similar models in the area (DEC2007), as well as on that of global models.
Comparing our experimental model with global geoid models, the geopotential model ITSG-Grace2014s presents a best fit with respect to our model. Furthermore, the results are improved compared to the experimental model DEC2007. In terms of comparing the level of adjustment of different geoid models with that obtained in this work, we conclude that the ITSG-Grace2014s geopotential model shows good agreement with the experimental geoid GeoiDEC14, with a difference in average values of -1.06 m, whereas with the other global models the difference is>-1.58 m. The agreement with ITSG-Grace2014s is probably due to the high resolution of this geopotential model.
Data were calculated for three geodesic stations on Livingston Island providing the geoid undulation, in addition to the corresponding geodetic data. These three values do not allow the determination of a geoid in the area, nevertheless they serve as a comparison to the Deception Island data. It can be concluded that the mean geoid undulation values are similar to those obtained for Deception Island, which validate our local geoid model, GeoiDEC14.
It must be acknowledged that this experimental geoid, GeoiDEC14, could be improved by i) adding data from the outer area of the island, since the geoid height for the outer coast was obtained by extrapolating the values taken near the inner bay, and ii) the addition of marine gravimetric measurements. Furthermore, it is advisable to conduct a new levelling survey in order to correct the altimetric reference framework errors defined in 2003, to redefine a new framework with an improved accuracy. The possibility of adding radar altimeter data for instantaneous sea level measures should also be considered.

Fig. 7 Linkages between levelling lines of the RENID network.

Fig. 8a Location of tidal gauge stations on Livingston and Deception islands. Detailed maps showing the tidal gauge stations and their related tidal gauge benchmarks on b. Livingston Island and c. Deception Island.

Fig. 9 Experimental geoid, GeoiDEC14, at Deception Island.

Fig. 10 Estimated GeoiDEC14 errors of N. The contour map was obtained using ArcGIS 9.3 software from Esri (2008).
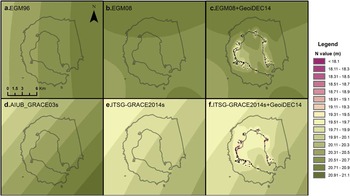
Fig. 11 Undulation values (N) according to a. EGM96, b. EGM08, d. AIUB_GRACE03s and e. ITSG-Grace2014s. c. and f. show the insertion of GeoiDEC14 within EGM08 and ITSG-Grace2014s.
Acknowledgements
This work was made possible by the support of the following projects, funded by the Spanish Ministry of Science and Technology through the National Programme of Antarctic Research and Natural Resources REN2000-0551-C03-01/ANT, REN2002-1383/ANT, CGL2004-21547-E/ANT, CGL2007-28768-E/ANT, CTM2008-03113-E/ANT and CTM2009-07251/ANT, as well as the Research Group RNM314 Geodesia y Geofísica Cádiz, pertaining to the Junta de Andalucía, Spain. The authors thank the crew of the Oceanographic Research Vessel BIO Las Palmas and the members of the Spanish Antarctic stations Gabriel de Castilla and Juan Carlos I for their collaboration during the surveying campaigns. We also thank Dr Jorge Gárate for comments and suggestions in the production of this paper. The authors thank the editors, Professor Smellie, Professor Zanutta and an anonymous reviewer for their comments which greatly improved the manuscript.
Author contributions
Research design: MBD, BJA, CTL, AFR and JVP. Data collection (participating in the Spanish Antarctic campaigns 1989–2013): MBD, BJA, CTL, JVP, AFR and IBG. Data processing and manuscript preparation: BJA, CTL, MBD, IBG, AFR and JVP. Manuscript final editing: BJA, CTL, MBD, AFR, IBG and JVP.
Supplementary Material
Supplemental tables and a figure will be found at http://dx.doi.org/10.1017/S0954102015000681.


