


Introduction
Ground ice and its evolution in permafrost plays a central role in landscape development. The high elevations of the McMurdo Dry Valleys (MDV), known as the stable upland or ultraxerous zone (e.g. Marchant & Head III Reference Marchant and Head III2007) are thought to have remained frozen under a hyper-arid polar climate since c. 13.8 Ma (e.g. Valletta et al. Reference Valletta, Willenbring, Lewis, Ashworth and Caffee2015). Early numerical modelling suggested that the uppermost tens of metres of permafrost soils in the upper MDV should be largely deprived of ground ice due to its sublimation under a hyper-arid climate (e.g. McKay et al. Reference McKay, Mellon and Friedmann1998). However, recent investigations of the depth of the interface between dry and icy permafrost (i.e. the ice table) found that 90% of the surveyed sites in the stable uplands had ice-table depths of < 80 cm (e.g. Marinova et al. Reference Marinova, McKay, Pollard, Heldmann, Davila and Andersen2013, Fisher et al. Reference Fisher, Lacelle, Pollard, Davila and McKay2016). Numerous shallow cores (< 6 m) in 100 000 to several million year-old permafrost soils also indicate that ground ice is present, and often above pore saturation, known as excess ice (e.g. Dickinson & Rosen Reference Dickinson and Rosen2003, Lacelle et al. Reference Lacelle, Davila, Fisher, Pollard, DeWitt and Heldmann2013, Lapalme et al. Reference Lapalme, Lacelle, Pollard, Fisher, Davila and McKay2017). In addition to the burial of glacier ice (e.g. Lacelle et al. Reference Lacelle, Davila, Pollard, Andersen, Heldmann, Marinova and McKay2011, Swanger Reference Swanger2017), different hypotheses have been advanced to explain the emplacement of ground ice in the icy permafrost of the upper MDV. For example, in places where ground temperatures remain < 0°C, ground ice was probably emplaced by vapour diffusion, whereas in places where ground surface temperatures rise to > 0°C, it was probably emplaced by a combination of vapour diffusion and freezing of evaporated snowmelt (e.g. Dickinson & Rosen Reference Dickinson and Rosen2003, Lacelle et al. Reference Lacelle, Davila, Fisher, Pollard, DeWitt and Heldmann2013, Lapalme et al. Reference Lapalme, Lacelle, Pollard, Fisher, Davila and McKay2017). Therefore, ground-ice conditions in the stable uplands can provide information about past environmental conditions, specifically whether persistent cold and hyper-arid conditions prevailed or whether these climate conditions were interrupted sporadically with the infiltration of liquid water in the dry soil lag and its subsequent freezing in icy permafrost soils.
The Friis Hills inselberg located at ~1500 m above sea level (a.s.l.) in the upper MDV contains a 50 m-thick sequence of stacked glacial drifts interbedded with silty fluvial and lacustrine sediments (Lewis & Ashworth Reference Lewis and Ashworth2015). The lower drift deposit was dated at 19.7 Ma from a tephra layer, whereas the top of the upper sediments is correlated with an erosional phase at 13.6–12.4 Ma, as observed in other areas in the MDV (Lewis & Ashworth Reference Lewis and Ashworth2015). The period of sediment deposition corresponds to the Miocene Climatic Optimum (MCO; 17–15 Ma) and the progressive cooling of the middle Miocene climate transition (MMCT), which initiated the transition to cold hyper-arid conditions (15–13 Ma; e.g. Flower & Kennett Reference Flower and Kennett1994). During the MCO, global mean annual air temperatures (MAATs) were ~3–5°C warmer than present due to elevated atmospheric carbon dioxide levels of ~600 ppm and consequential changes in deep-ocean circulation and associated meridional heat transfer (e.g. Flower & Kennett Reference Flower and Kennett1994, Herold et al. Reference Herold, Huber, Müller and Seton2012). The diverse fossil assemblages preserved in the lacustrine units, including Nothofagus (southern beech) wood and leaves, are now absent from Antarctica, suggesting that the warmer climate allowed tundra-like ecosystems to occupy the region until c. 14 Ma during the final stage of the MMCT (e.g. Lewis & Ashworth Reference Lewis and Ashworth2015). The MMCT marked the initial step of a progressive cooling in Antarctica and a switch to hyper-arid polar conditions in the upper MDV. Based on a study of meteoric 10Be, it was suggested that no meteoric water has not infiltrated the permafrost sediments for at least the past 14 Myr (Valletta et al. Reference Valletta, Willenbring, Lewis, Ashworth and Caffee2015).
Considering that the Friis Hills contain a sediment sequence deposited at a time when Earth experienced a major change in climate conditions, the Friis Hills Drilling Project (FHDP) was undertaken in 2016–17 to recover the complete ~50 m-deep mid-Miocene sediment sequence. The sedimentological and stratigraphic description of the cores, including palaeomagnetic measurements, 40Ar/39Ar dating and palaeoenvironmental indicators such as macrofossils, diatoms and pollens, are reported in Chorley et al. (unpublished). The objective of this study is to understand the origin and evolution of ground ice in a ~50 m permafrost column over c. 15 Myr. This objective is accomplished by investigating the cryostratigraphy of the permafrost sediments, including characterizing the cryostructures and determining the ground ice content, major soluble ions and δD-δ18O composition of the ground ice. This permafrost sequence from the upper MDV provides a unique opportunity to investigate the ground ice conditions of arguably the oldest permafrost on Earth and offers insights into the dynamics of ground ice processes in relation to climate change since the MMCT and the transition to a cold and hyper-arid climate.
Study area
Friis Hills (77°45′S, 161°30′E) is a 12 km-wide inselberg situated at the head of Taylor Valley at 1200–1500 m a.s.l. and ~50 km from the Ross Sea coast (Fig. 1). The local geology of Friis Hills consists of an assemblage of Ordovician and Jurassic age intrusive igneous rocks and Devonian sedimentary rocks of the Beacon Supergroup (Lewis & Ashworth Reference Lewis and Ashworth2015). The multiple advances and retreats of a local alpine glacial system connected to the East Antarctic Ice Sheet deposited a ~50 m-thick sequence of glacial drifts interbedded with lacustrine sediments (Lewis & Ashworth Reference Lewis and Ashworth2015, Chorley et al. in preparation). The five FHDP cores consist of a succession of sedimentary facies ranging from subglacial (e.g. diamictites) to fluvial-deltaic (e.g. interstratified, graded or cross-stratified sandstones and/or mudstones) to ice-distal lacustrine environments (e.g. massive mudstones). The 40Ar/39Ar dating of tephras found at the base of core FHDP2C (5.15 m) and at 27.2 m depth in core FHDP3A indicates that the sequence dates between 15 and 14 Ma (Hemming & Cox, personal communication 2020), which is in the upper range of the ages reported by Lewis & Ashworth (Reference Lewis and Ashworth2015) and corresponds to the Friis II drift.

Fig. 1. a. Map showing the location of Friis Hills (FH) in the McMurdo Dry Valleys (contour lines at 200 m intervals) and b. topographical map of FH (contour lines at 50 m intervals) with sampling and drilling sites (background LIDAR imagery from Fountain et al. Reference Fountain, Fernandez-Diaz, Obryk, Levy, Gooseff and van Horn2017).
Friis Hills is currently located within the stable upland micro-climatic zone where maximum air temperatures remain < 0°C, resulting in little or no melting of snow and/or ice (Marchant & Head III Reference Marchant and Head III2007). Dry permafrost extends from the surface to a depth of ~30–35 cm, and the depth of the ice table is largely controlled by ground surface temperature and relative humidity conditions (Fisher et al. Reference Fisher, Lacelle, Pollard, Davila and McKay2016). A 5 year (2011–15) climate record collected from an automated weather station in Friis Hills (77°44′50.64″S, 161°30′58.32″E, 1591 m a.s.l.) reported a MAAT of -22.7 ± 1.3°C and a mean annual relative humidity of 61.8 ± 5.4% (Doran & Fountain Reference Doran and Fountain2019). Measurements on ground temperatures are lacking but based on the absence of a surface offset in the upper MDV (Lacelle et al. Reference Lacelle, Lapalme, Davila, Pollard, Marinova, Heldmann and McKay2016), the mean annual ground surface temperature should approximate the MAAT.
The sediments at Friis Hills have experienced c. 15 Myr of climate change and associated effects on ground thermal and stress regime. Global palaeotemperature reconstructions since the MMCT suggest a general cooling trend until the Holocene punctuated with warm intervals such as the mid-Pliocene (c. 3 Ma), when temperatures were ~2–3°C warmer than today (e.g. McKay et al. Reference McKay, Naish, Carter, Riesselman, Dunbar and Sjunneskog2012). Since the mid-Pleistocene climate transition (c. 1.0–0.8 Ma), Antarctic ice sheets have kept their present cold polar state and sea ice remained permanent in the Ross Embayment, even during warm intervals such as Marine Isotope Stage 5e (MIS5e; c. 130–115 ka; Naish et al. Reference Naish, Wolff, Carter, McKay and Powell2010). Reconstructions of the palaeogeography of the site since the mid-Miocene remain poorly constrained. Early estimates in uplift rates suggest that the Friis Hills region was near sea level during the period of sediment deposition (~100 m Myr-1 uplift rate; Fitzgerald Reference Fitzgerald1992); conversely, the latest large-scale palaeotopographical reconstructions based on 3D flexural modelling suggest that the region experienced < 300 m uplift since the Miocene (e.g. Paxman et al. Reference Paxman, Jamieson, Hochmuth, Gohl, Bentley, Leitchenkov and Ferraccioli2019). Recent models also estimate that sea level increased by ~30–36 m during the mid-Miocene (Gasson et al. Reference Gasson, DeConto, Pollard and Levy2016) and, assuming minimal uplift, the distance from the Ross Sea coast could have still been reduced to < 20 km. Cores drilled at the mouth of Taylor Valley (DVDP 10 and 11) contained marine deposits, suggesting fjord-like conditions in lower Taylor Valley during the warmer periods of the late Miocene and/or early Pliocene (Porter & Beget Reference Porter and Beget1981) and that similar conditions could have prevailed during the MCO.
Methods
Field sampling
The FHDP cores were collected during the summer of 2016–17 with the objective of recovering the complete 50 m-deep stratigraphic sequence. During coring, sediments in some sections of cores were too dry (unconsolidated by ice) and could not be recovered as a continuous core; the 50 m stratigraphic sequence was recovered by coring in nearby locations. Overall, five cores were combined to provide a stratigraphic sequence from the top of the ice table to 50.48 m depth: FHDP1A (0.86–7.24 and 15.15–33.60 m), FHDP1B (14.59–16.33 m), FHDP2A (0.61–7.05 and 10.40–17.83 m), FHDP2C (0.35–5.18 m) and FHDP3A (15.02–50.48 m). In addition, 12 samples from the surficial dry permafrost at sites FHDP1 and FHDP2 were collected at 1–3 cm intervals. All cores and samples were shipped frozen in thermally insulated boxes to the GNS Ice Core Facility (Wellington, New Zealand), where they were kept frozen at -28°C until being processed for analyses.
Cryostratigraphy and ground-ice content
The sampling of the permafrost cores was based on the sedimentological facies. The lacustrine and glaciofluvial deposits were sampled at high resolution (<1 m intervals), whereas the diamict sections were sampled at 1 m intervals. When present, ice-rich layers were also sampled. The near-surface core FHDP2C was selected for detailed analyses because of its high ground ice content, and it was sampled at 2–5 cm intervals. The cores were sliced using a tile cutter with a 2.2 mm blade and placed into polyethylene bags. All samples were thawed, transferred into pre-weighted and well-sealed graduated polypropylene tubes and, once the sediment settled, the volume of supernatant water and the volume of sediment were recorded. The tubes were then centrifuged to extract the water within the sediment for geochemical analyses. Despite the 273 samples, only 33 samples contained sufficient meltwater for geochemical analyses; 28 samples were from the uppermost 2 m of cores FHFP1A, 2A and 2C and five samples were retrieved from 35–45 m depths in FHDP3A. Once the water was extracted, the sediments were dried at 85°C for 48 h and the mass of the dried sample recorded. Ground ice content was assessed by determining the excess ice, gravimetric water content (GWC) and volumetric ice content (VIC) using equations from Van Everdingen (Reference Van Everdingen1998).
Major soluble ion contents
Melted ground ice samples were analysed for major cations (Ca2+, Mg2+, Na+, K+) and anions (Cl-, SO42-, NO3-) at the Geochemistry Laboratory, University of Ottawa. The cation samples were first acidified with ultra-pure HNO3 acid to pH = 2 and analysed using a Varian Vista-Pro inductively coupled plasma atomic emission spectrometer (ICP-AES). The anions were analysed unacidified by ion chromatography using a Dionex-100 device. Analytical reproducibility was ± 5%. To compare samples with different ice contents, the measured concentrations were normalized to the mass of dry soils (mg g-1). The median charge balance for the near-surface samples was of -3.5%, and it was +8.26% for the deeper samples, suggesting that dissolved inorganic carbon, such as HCO3- and CO32-, were not major missing ions.
Stable water isotopes
The stable water isotopes (δ18O and δD) of the melted ground ice samples were analysed with a Los Gatos Research (LGR) Triple Isotope Water Analyzer (TIWA-45-EP) coupled to a CTC LC-PAL autosampler for simultaneous 18O/16O and D/H ratio measurements and verified for spectral interference contamination. The results are presented using the δ notation (δ18O and δD), where δ represents the parts per thousand differences for 18O/16O or D/H in a sample with respect to Vienna Standard Mean Ocean Water (VSMOW). Analytical reproducibility values for δ18O and δD were ± 0.3‰ and ± 1‰, respectively. The D-excess was calculated using the equation of Dansgaard (Reference Dansgaard1964): D-excess = δD - 8 × δ18O.
The REGO model
The evolution of an initial ground-ice profile in the 50 m sediment sequence was assessed using the REGO model and its WATERREGO subroutine (Fisher et al. Reference Fisher, Lacelle and Pollard2020a, Reference Fisher, Lacelle, Pollard and Faucher2020b). The model allows for evolving residual unfrozen water, including its chemistry and its freezing-point temperature, under changing soil temperature and water-ice phase changes, and the unfrozen water can migrate in the icy soils by diffusive and advective transport driven by stress fields over diurnal and seasonal temperature cycles. The modelling also includes the effect of Van der Waals (VdW) forces that are effective at moving unfrozen water in the uppermost 1 m. The model uses a modified Rempel-type equation to determine the fraction of residual volume of water in freezing soils; however, during the freezing of water at a given temperature decrement, ions are concentrated in the residual water and the new ionic concentration can produce a freezing-point temperature that may be lower than the surrounding soil temperature. This produces an instability in the equation that would force the ground ice to completely melt, but REGO limits the amount of ground ice that can melt based on a heat energy exchange (see eq. (12) in Fisher et al. Reference Fisher, Lacelle and Pollard2020a). The model then combines the results of many possible values of parameters related to soil types, thermal properties and temperature cycles and makes ensemble averages of bulk water speeds, their derivatives with depth and the unfrozen water content at different time steps. The model was intended to produce ensemble average profiles that could be compared to the average profiles of a large suite of boreholes in permafrost in varying terrain (10 or more). In the case of Friis Hills, the number of boreholes is small and they are close together, but the modelling results are nonetheless informative. The model inputs are listed in Table I and are representative of the environmental conditions at Friis Hills.
Table I. Values of parameters used in REGO ensemble modelling (n = 36).

Note: For further explanation of the variables and methods, see Fisher et al. (2019).
VdW = Van der Waals.
Results
Sedimentological description of cores
The five FHDP cores provided a 50 m sediment sequence ranging from 0.2–13.3 m-thick layers of massive/stratified diamicts with clasts (subglacial deposits) to 0.1–4.2 m-thick layers of interstratified, graded or cross-stratified sands and/or muds (glaciofluvial deposits) and 0.1–1.5 m-thick layers of massive muds (lacustrine deposits) (Fig. 2a). The 5.15 m-long FHDP2C core that was analysed in detail for cryostratigraphy contained seven stratigraphic units that included 0.02–0.20 m-thick fluvial-deltaic deposits (stratigraphic units 1, 2 and 3), 0.24–1.95 m thick subglacial deposits (stratigraphic units 4 and 6) and 0.62–1.47 m thick lacustrine deposits (stratigraphic units 5 and 7; Fig. 3a). The Munsell colours of the sediments were all within the 2.5Y hue group, alternating mostly between light grey (2.5Y 7/2) and light yellowish brown (2.5Y 6/3) (Fig. 3a). Tephra layers found near the base of core FHDP2C and at 27.2 m depth in core FHDP3A provided preliminary 40Ar/39Ar ages from volcanic glass between 15 and 14 Ma (Fig. 2a).

Fig. 2. a. General stratigraphy of Friis Hills Drilling Project (FHDP) cores FHDP1A, 2A and 3A with tephra ages provided by Hemming S. Cox (personal communication 2020). b.–d. Gravimetric water content (GWC), volumetric ice content (VIC) and excess ice content, respectively in the five FHDP cores. e. Relation between VIC and clay + silt content in FHDP2C. f. Boxplots of the VIC for the various stratigraphic units in FHDP2C.

Fig. 3. Sedimentary, ground ice, δ18O and D-excess and major ion profiles in core FHDP2C. a. Lithological facies (described in text and pictured in Fig. S1) including Munsell colours of each unit. b. Ground ice content (volumetric ice content (VIC), gravimetric water content (GWC) and excess ice content). c. δ18O composition of ground ice. d. D-excess composition of ground ice. e. Dissolved anions (Cl-, SO42+, NO3-). f. Dissolved cations (Ca2+, Na+, K+, Mg2+). Note, analyses of stable water isotopes and soluble ions was only possible in the uppermost 1.25 m, where sufficient meltwater could be recovered. VSMOW = Vienna Standard Mean Ocean Water.
Cryostratigraphy, major ions and δD-δ18O of ground ice
The moisture content in the dry permafrost was lowest at the surface (3%vol.) and increased towards the ice table (30 cm depth), where it reached 10%vol. Below the ice table, the ground ice content in the icy permafrost was consistent between the five cores and showed a general decrease with depth (Fig. 2b–d). The ground-ice content was highest in the uppermost 1 m, where it averaged 29%vol., classifying this interval as ice-rich sediments; ice lenses 0.2–3.0 cm thick were also observed in this interval (Fig. 4a–e). The VIC progressively decreased between 1 and 5 m (from ~23 to 10%vol.) and the cryofacies changed to ice-poor sediment (Figs 2b–d & 3b). Between 5 and 20 m, the VIC was lowest and had values comparable to the surface layer of dry permafrost (2–10%vol.). Below 20 m, the average VIC ranged from 13 to 21%vol., increasing slightly compared to the overlying material. Two ice lenses (2 and 15 cm thick) were found in the massive diamicts of FHDP3A at 37 and 43 m depths, respectively (Figs 2b–d & 4f). Ground ice was found in all sedimentological facies, with a small positive correlation between ice content and clay-silt content in core FHDP2C (Fig. 2e & f).

Fig. 4. Examples of lenticular cryostructures in Friis Hills sediments. a.–e. Within the upper 1 m of icy permafrost in core FHDP2C. f. At 43 m depth in core FHDP3A (section of the 15 cm-thick ice lens).
The uppermost 1 m of the FHDP cores had a NaCl geochemical facies, and the sum of ions ranged from 3.9 to 14.3 mg g-1 dry soil, averaging 8.8 ± 2.5 mg g-1 dry soil. The concentrations of individual anions varied between 258 and 6031 mg kg-1 dry soil, with Cl- > SO42- > NO3- (Fig. 3e). The concentrations of the individual cations varied between 13 and 2998 mg kg-1 dry soil, with Na+ > Mg2+ > Ca2+ > K+ (Fig. 3f). In the near surface, the ion content generally increased with depth, with maximum contents at 60 and 110 cm depths (Fig. 3e & f). The molar ratios Na/Cl, Ca/Cl, Mg/Cl, SO4/Cl and NO3/Cl averaged 0.74 ± 0.11, 0.07 ± 0.02, 0.19 ± 0.01, 0.13 ± 0.08 and 0.14 ± 0.02, respectively. All molar ratios showed a general decrease with depth, except for Mg/Cl and NO3/Cl, which increased with depth. In FHDP3A (15.02–50.48 m), samples from ground ice at < 30 m had a CaSO4 geochemical facies and statistically lower total ionic concentration (P < 0.05) than in the uppermost 1.5 m; the sum of ions ranged from 0.3 to 0.5 mg g-1 dry soil, averaging 0.3 ± 0.1 mg g-1 dry soil. Concentrations of anions varied between 0.6 and 171.2 mg kg-1 dry soil, with SO42- > Cl- > NO3-. Concentrations of the major cations varied between 2.9 and 71.6 mg kg-1 dry soil, with Ca2+ > Na+ > Mg2+ > K+. The molar ratios at < 30 m depth were all significantly higher (P < 0.05) than in the uppermost 1.5 m, except for NO3/Cl, which was near 0 due to the low content of NO3.
The δ18O values of the ice lenses found within the uppermost 1 m ranged between -19.8‰ and -12.8‰ (average = -16.2 ± 1.8‰) and showed a general decrease with depth (Fig. 3c). The samples were distributed along a regression slope of 6.1 (r 2 = 0.89) and plotted below the MDV local meteoric water line (LMWL) of 7.9 (Fig. 5a). The D-excess values ranged between -73.0‰ and -52.9‰ (average = -65.6 ± 4.3‰; Fig. 3d). Due to low ice content in the 1–30 m intervals of the cores, no samples could be retrieved for δD-δ18O analysis. The ice lenses at < 30 m in core FHDP3A had the lowest δ18O values, ranging between -35.8‰ and -32.6‰ (average = -34.6 ± 1.2‰; Fig. 5a). These samples were distributed along the LMWL with D-excess values between 2.4‰ and 8.7‰ (average = 6.9 ± 2.6‰).

Fig. 5. a. δD-δ18O scatter plot of ground ice in the various cores at Friis Hills. b. δD-δ18O of ground ice in core FHDP2C compared with other sites in the McMurdo Dry Valleys: Table Mountain (1945 m above sea level (a.s.l.); Dickinson & Rosen Reference Dickinson and Rosen2003), Victoria Valley (450 m a.s.l.; Hagedorn et al. Reference Hagedorn, Sletten, Hallet, McTigue and Steig2010) and University Valley (1600–1800 m a.s.l.; Lapalme et al. Reference Lapalme, Lacelle, Pollard, Fisher, Davila and McKay2017). The local meteoric water line (LMWL) is shown for comparison purposes (LMWL: δD = 7.9 δ18O + 0.8; Lacelle et al. Reference Lacelle, Davila, Pollard, Andersen, Heldmann, Marinova and McKay2011). VSMOW = Vienna Standard Mean Ocean Water.
Discussion
The Friis Hills cores showed four cryostratigraphic units that were independent of sediment types: 1) surficial dry permafrost (0–30 cm), 2) ice-rich to ice-poor permafrost (0.3–5.0 m), 3) near-dry permafrost (5–20 m), and 4) ice-poor to ice-rich permafrost with distinct thin ice layers (20–50 m). The geochemistry and δD-δ18O also showed contrasting values between the uppermost ice-rich permafrost and the two ice lenses at < 30 m depth. The ground ice in the uppermost 1 m was characterized by NaCl geochemical facies, high solute load (3.9–14.3 mg g-1 dry soil) and δ18O values (-19.8‰ to –12.8‰) and a δD-δ18O regression slope of 6.1, which is lower than the LMWL. The 2 and 15 cm-thick ice lenses at < 30 m were characterized by CaSO4 geochemical facies, lower solutes load (0.3–0.5 mg g-1 dry soil) and δ18O values (-35.8‰ to -32.6‰) and a δD-δ18O distributed along the LMWL. Below, we discuss the cryostratigraphy of the Friis Hills cores by comparing the results to those from other sites in the stable uplands zone. To elucidate dominant processes that shaped ground-ice conditions at Friis Hills, we modelled the evolution of ground ice content using the REGO model.
Origin of ground ice in the upper 1 m
Most studies on ground ice in the MDV have been restricted to shallow (< 6 m) permafrost cores (e.g. Dickinson & Rosen Reference Dickinson and Rosen2003, Hagedorn et al. Reference Hagedorn, Sletten, Hallet, McTigue and Steig2010, Lacelle et al. Reference Lacelle, Davila, Fisher, Pollard, DeWitt and Heldmann2013, Lapalme et al. Reference Lapalme, Lacelle, Pollard, Fisher, Davila and McKay2017, Swanger Reference Swanger2017). Excluding the burial of glacier ice, two origins for this ground ice have been proposed: 1) vapour-deposited ice, and 2) ice formed from the freezing of evaporated snowmelt (e.g. Dickinson & Rosen Reference Dickinson and Rosen2003, Hagedorn et al. Reference Hagedorn, Sletten, Hallet, McTigue and Steig2010, Lacelle et al. Reference Lacelle, Davila, Fisher, Pollard, DeWitt and Heldmann2013, Lapalme et al. Reference Lapalme, Lacelle, Pollard, Fisher, Davila and McKay2017). Vapour-deposited ground ice is typically characterized by: 1) a maximum ice content at the ice table that subsequently gradually decreases with depth, 2) δ18O and D-excess profiles that both decrease with depth, and 3) δD-δ18O slope values similar to the LMWL but shifted below it due to low D-excess (in the -48‰ to -27‰ range). By contrast, the freezing of evaporated snowmelt is generally characterized by: 1) variable ground ice content profiles, 2) decreasing δ18O but increasing D-excess profiles with depth and 3) δD-δ18O slopes lower than the LMWL with very low D-excess (mostly in the -83‰ to -46‰ range).
The ground ice samples in the uppermost 1 m of Friis Hills had δD-δ18O and D-excess compositions that are consistent with the freezing of evaporated snowmelt. The δD-δ18O and D-excess of ground ice in the uppermost 1 m were enriched in δ18O by ~10‰ with D-excess being ~60–70‰ lower compared to the isotopic composition of snow and glacial ice in Taylor Valley glacier and snow (e.g. Gooseff et al. Reference Gooseff, Lyons, McKnight, Vaughn, Fountain and Dowling2006). However, the δD-δ18O and D-excess of ground ice was in the range of ground ice from Table Mountain (1945 m a.s.l.) and Victoria Valley (450 m a.s.l.; Fig. 5b). Ground ice in the seasonally cryotic zone of University Valley (1600–1800 m a.s.l.) has slightly lower δD-δ18O values, but the D-excess and δD-δ18O slope values are in the same range as those in Friis Hills (Fig. 5b & Fig. S2). Therefore, similar to Table Mountain, Victoria Valley and University Valley, the isotopic composition of ground ice in the uppermost 1 m at Friis Hills was probably affected by two distinct processes: 1) infiltration and partial evaporation of snowmelt through the surficial dry permafrost and 2) its subsequent freezing at the ice table and underlying icy permafrost soils.
The composition of δ18O and D-excess in the uppermost 1 m at Friis Hills was modelled using the Craig et al. (Reference Craig, Gordon and Horibe1963) and Craig (Reference Craig and Tongiorgi1965) models for isotopic exchange of evaporating water with ambient soil moisture and the isotope salt effect correction of Sofer & Gat (Reference Sofer and Gat1975). The model predicts the evolution of evaporating meteoric water in the dry sandy soils during the summer season when the dry soil temperature is at or above the eutectic of the pore water (Table II). At FHDP2, the ice-table depth is 35 cm and, according to the ice-table depth and ground surface humidity relation (Fisher et al. Reference Fisher, Lacelle, Pollard, Davila and McKay2016), the ground surface humidity is estimated at 93% and the soil relative humidity ranged from 90% to 95%. The initial δ18O composition of snow was set at -35‰ (although it does not significantly influence the steady-state isotopic value) and that of soil water vapour was assumed to be in the -26‰ to -30‰ range (similar to those used for University Valley; Lapalme et al. Reference Lapalme, Lacelle, Pollard, Fisher, Davila and McKay2017). The initial soluble ion concentration was set at 10% of seawater salinity, as measured just under the ice table (even if the average in the uppermost 1 m of icy permafrost is 47% of seawater salinity). In the modelling scenarios, the δ18O of soil water approached a steady-state value that was dependent on the δ18O of soil vapour and humidity (Fig. 6). The modelled δ18O composition of infiltrating snowmelt required in order to match the range of δ18O values measured near the ice table (-13.4‰) was reached by using a soil relative humidity of 90–95% and a δ18O soil vapour of -26‰ to -28‰ after > 10% of the water had evaporated, after which δ18O residual water reached a steady-state value (Fig. 6). The evaporated snowmelt in the dry soil lag with δ18O composition that evolved from -35‰ to -13‰ then set the initial δ18O composition of water that will begin to freeze at and below the ice table to develop the icy permafrost. Freezing of the partially evaporated snowmelt at the ice table and deeper in the icy permafrost imparts a progressive depletion in δ18O in the residual water (and enrichment in D-excess) due to the preferential incorporation of the heavier isotopes in the ice following a Rayleigh-type isotope fractionation, with the extent of fractionation being dependent on the freezing rate and thickness of the boundary layer (Lacelle et al. Reference Lacelle, Davila, Pollard, Andersen, Heldmann, Marinova and McKay2011). Considering that the δD-δ18O composition of the ground ice at Friis Hills and its profile in the uppermost 1 m is very similar to other sites in the stable upland zone where ground ice formed from the infiltration and freezing of evaporated snowmelt (Fig. 5b), this suggests that the environmental conditions between the sites are similar and that the ground ice in the near-surface permafrost is dynamic and responding to changes in environmental conditions. This challenges the assumption that Friis Hills has remained ‘frozen’ since 13.8 Myr with no infiltration of meteoric water in the sediments (Valletta et al. Reference Valletta, Willenbring, Lewis, Ashworth and Caffee2015). However, similarly to the other locations in the stable uplands, there probably have been short periods when the ground surface temperatures rose above freezing, even for just a few hours, and with appropriate snow cover, sufficient snowmelt was able to infiltrate the dry sediments and reach the ice table at Friis Hills (e.g. Dickinson et al. Reference Dickinson, Schiller, Ditchburn, Graham and Zondervan2012, Lacelle et al. Reference Lacelle, Lapalme, Davila, Pollard, Marinova, Heldmann and McKay2016).

Fig. 6. Evolution of (a. & c.) δ18O and (b. & d.) D-excess for two scenarios of relative humidity (RH) (a. & b.) of 90% and (c. & d.) 95% for a range of soil water vapour values using a combination of the Craig et al. (Reference Craig, Gordon and Horibe1963) and Craig (Reference Craig and Tongiorgi1965) models for isotope exchange of evaporating water with ambient soil moisture and the isotope salt effect correction of Sofer & Gat (Reference Sofer and Gat1975). e. At the end of the evaporative evolution, the liquid water δ18O and δD are used to determine the first formed ice isotopic composition at the ice table. Note, for example, the liquid water's δ18O at the ice table is ~-15‰, so the first ice formed at the ice table would be ~-12‰ and would progressively decrease with depth following the freezing of the residual water. LMWL = local meteoric water line.
Table II. Input parameters for the evaporation isotope model that calculates the stable isotopes of hydrogen and oxygen for snowmelt seeping downwards in summer through salty soil above the ice table. Based on Sofer & Gat (Reference Sofer and Gat1975), Craig et al. (Reference Craig, Gordon and Horibe1963) and Craig (Reference Craig and Tongiorgi1965).
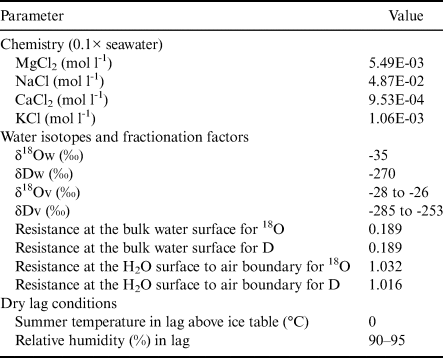
Note: Equilibrium fractionation factor (α) used for temperature (T = Tlag).
For water equilibrium, T ≥ surface ice set at -25°C in this example.
α18O = EXP((1137/T2) - (0.4156/T) - 0.0020667) (T in kelvin).
αD = EXP((24 844/T2) - (76.248/T) + 0.052612) (T in kelvin).
For ice equilibrium, T < surface ice, 25°C in this example, T in kelvin.
α18O = EXP(11.839/T - 0.028224) (T in kelvin).
αD = EXP(129.667/T - 0.351366) (T in kelvin).
Origin of ground ice at 35–50 m depth
At Friis Hills, the 2 and 15 cm-thick ice lenses found at 37 and 43 m depths, respectively, in FHDP3A had lower solute loads (average = 0.3 ± 0.1 mg g-1) and were characterized by a CaSO4 geochemical facies, a eutectic point of -0.02°C, δ18O values of -34.6 ± 1.2‰ and a δD-δ18O regression slope value similar to the LMWL. With the exception of a solute load that was ~ 400 times greater than in precipitation (assuming a 0.74 mg kg-1 baseline; Taylor Glacier fresh snow 500 m a.s.l.; Lyons et al. Reference Lyons, Welch, Fountain, Dana, Vaughn and McKnight2003), the δ18O composition, δD-δ18O slope value and geochemical facies of the deep ground ice are comparable to those of snow and glacial ice located ~20–30 km towards the Ross Sea in the mixed intermediate zone (e.g. lower Taylor Glacier and Canada Glacier; Gooseff et al. Reference Gooseff, Lyons, McKnight, Vaughn, Fountain and Dowling2006). Based on these characteristics, it is tempting to associate the deep ice lenses with a buried glacier or snow deposited during the mid-Miocene. However, this origin would not explain the solute load in the ice nor the lenticular cryostructure, which are two characteristics generally associated with intra-sedimental ice (i.e. segregated, injection, intrusive ice; e.g. Coulombe et al. Reference Coulombe, Fortier, Lacelle, Kanevskiy and Shur2019 and references therein).
In theory, intra-sedimental ice should have a δD-δ18O slope value lower than the LMWL, but there are some instances where the δD-δ18O measurements of this type of ice show a meteoric origin. For example, seasonal ice layers in a pingo near Tuktuyaktuk (Mackay Reference Mackay1990) and reticulate ice in marine clays in the Eureka lowlands (Roy Reference Roy2019) had δD-δ18O slope values near the global meteoric water line (GMWL). The reason as to why the intra-sedimental ice had a δD-δ18O slope near the GMWL, which is similar the FHDP3A ice lenses, relates to sampling and melting the entire ice layer, thus preserving the isotopic mass balance and removing the effect of freezing on δD and δ18O within the ice lens. Considering that the ice lenses preserved a GMWL signature, this suggests that the water from which the deep ice layers formed did not experience evaporation, which would have enriched the δD and δ18O composition prior to freezing and shifted their δD-δ18O composition below the LMWL. This implies that the site probably had an active layer with near-saturated soils, as commonly found today in high Arctic permafrost regions, and not a dry permafrost lag. Therefore, we suggest that the FHDP3A ice lenses originated from the freezing of meteoric water following the deposition of the sediments c. 15.0 Ma and probably consist of segregated ice. However, without dating the ice lenses directly, we cannot infer whether the ice is synchronous to the time of sediment deposition c. 14–15 Ma, when a tundra ecosystem occupied the region, or during the colder MMCT.
Mid-Miocene palaeotemperature reconstruction
Ice wedges, and more recently pore ice, with δ18O compositions that preserve a meteoric signature are sometimes used as palaeotemperature proxies (e.g. Porter & Opel Reference Porter and Opel2020). In a similar fashion, we can compare the average δ18O composition of the deep ice lenses (-34.6 ± 1.2‰), which probably formed from the freezing of meteoric water, to the 150 000 year record at Taylor Dome (2365 m a.s.l. and 80 km inland) in order to constrain air temperatures during the MCO-MMCT. The δ18O of the ice lenses is 2–3‰ higher than recorded during warm intervals over the past 150 000 years (i.e. early Holocene and MIS5e, which were 1–3°C warmer than today in Antarctica; Grootes et al. Reference Grootes, Steig, Stuiver, Waddington, Morse and Nadeau2001, Jouzel et al. Reference Jouzel, Masson-Delmotte, Cattani, Dreyfus, Falourd and Hoffmann2007), which, based on the δ18O-temperature relation (dT/d δ18O = 2.1 ± 0.2K/‰), would imply that temperatures at Friis Hills were 5–9°C warmer during the mid-Miocene. However, comparison of late Quaternary climate to that of the mid-Miocene must account for different environmental factors, such as changes in δ18O of seawater, the seasonality of precipitation, distance from coast, site elevation and δ18O-temperature relation. Based on the δ18O of benthic foraminifera, the δ18O of the Southern Ocean during the mid-Miocene was ~1‰ lower than today (Billups & Schrag Reference Billups and Schrag2002). In the MDV, the δ18O composition of shallow ice cores on glaciers decrease as a function of distance from the coast, and the data fit the following equation: y = -0.1528x - 28.38 (r 2 = 0.89; Gooseff et al. Reference Gooseff, Lyons, McKnight, Vaughn, Fountain and Dowling2006). The modern δ18O-elevation relation in Antarctica fits a slope of -0.68‰ per 100 m (Wang et al. Reference Wang, Hou, Masson-Delmotte and Jouzel2009); however, the relation is largely temperature dependent, as shown in Greenland, where the δ18O-elevation relation decreases to -0.62 ± 0.03‰ per 100 m (Dahl-Jensen et al. Reference Dahl-Jensen, Albert, Aldahan, Azuma, Balslev-Clausen, Baumgartner and Berggren2013). If we correct the δ18O of ice layers for changes in δ18O of seawater (-1‰) and the latest palaeogeographical conditions of Friis Hills (~30 km closer to the coast due to higher sea level, present-day location of Lake Bonney, +4.5‰ distance from coast; Lyons et al. (Reference Lyons, Welch, Snyder, Olesik, Graham, Marion and Poreda2005) with little elevation change since the mid-Miocene (0‰), the δ18O composition of the ice would increase by ~3‰ and suggest that the MAAT during the late stage of the mid-Miocene was ~7°C warmer than today. If we keep the same corrections for both δ18O of seawater and distance from coast, but apply 300 m of uplift since the late Miocene (~2‰ uplift; e.g. Wilch et al. Reference Wilch, Lux, Denton and McIntosh1993), the δ18O composition of the ice would increase by ~5‰ and suggest that the MAAT during the late stage of the mid-Miocene was ~11°C warmer than today, corresponding to a MAAT of between -16°C and -11°C (in the range of that in present-day high Arctic Canada). However, this comparison must be taken with caution, as the various δ18O empirical relations cannot be directly transferred to other climate periods because their calibration assumes similar distributions of precipitation, moisture source and trajectory (i.e. unchanged atmospheric circulation; Sturm et al. Reference Sturm, Zhang and Noone2010). The MCO and MMCT were periods characterized by changes in deep-ocean circulation and associated meridional heat transfer, therefore most probably affecting moisture source and precipitation (e.g. Herold et al. Reference Herold, Huber, Müller and Seton2012).
A model for ground ice content evolution since the mid-Miocene
The Friis Hills cores showed four cryostratigraphic units: 1) surficial dry permafrost (0–30 cm), 2) ice-rich to ice-poor permafrost (0.3–5.0 m), 3) near-dry permafrost (5–20 m), and 4) ice-poor to ice-rich permafrost with distinct thin ice layers (20–50 m). We have shown that the ground ice in the near-surface is derived from the freezing of evaporated snowmelt and its migration into the icy permafrost, whereas the ground ice in the deep icy permafrost is interpreted to be derived from the freezing of meteoric water. However, the presence of near-dry permafrost across the 5–20 m depth is enigmatic, as both freezing of evaporated snowmelt and vapour diffusion are expected to incorporate ice in accumulating dry sediment (e.g. Fisher et al. Reference Fisher, Lacelle, Pollard, Davila and McKay2016). For example, even if we ignore the infiltration, migration and freezing of evaporated snowmelt, the slow process of vapour-deposited ice is expected to fill the pore space of sediments with ice within a few hundred years (e.g. Lacelle et al. Reference Lacelle, Davila, Fisher, Pollard, DeWitt and Heldmann2013). Through the c. 14 Myr of exposure time at Friis Hills, it is possible that the superimposed ice, which refers to the initial emplacement of ice, evolved to inherited ice, which developed from subsequent variations in the initial structure caused by the thermal and stress fields in the icy permafrost. Such redistribution was inferred by Fisher et al. (Reference Fisher, Lacelle and Pollard2020a), where the ground ice content profile was predicted to evolve over the Holocene due to the migration of residual unfrozen water in the permafrost under thermal and stress fields. This process results in the development of ice-rich and ice-poor zones at distinct depths determined by the thermal diffusivity of the icy permafrost, with the change in ice content determined by evolved time.
Here, we use the REGO model with the WATERREGO subroutine to assess how an initial ground-ice profile in a 60 m icy permafrost column would evolve over time under diurnal and seasonal thermal variations using values of input parameters that are representative of the environmental conditions at Friis Hills (Table I). The modelling indicates that the diurnal stress cycles affect the uppermost 30–50 cm and the seasonal stress cycles extends to a depth of ~22 m. This is slightly below the depth of zero thermal amplitude, because stress in a rigid frozen soil can propagate further than the temperature waves that cause them. The diurnal and seasonal thermal regime and associated VdW and rheological forces on the transport of residual water lead to the evolution of ice-rich zones near the surface of permafrost and at 3 and 5 m, as observed in the Friis Hills measurements (Fig. 7). Because of the effectiveness of VdW forces at moving unfrozen water, the uppermost 1 m of icy permafrost is a fast-responding zone, and this could explain why the results from different sites in the MDV have similar ground ice and δ18O profiles, as they can quickly respond to changing environmental conditions (Fig. S2). From ~5 to 15 m depths, the seasonal cycles and rheological forces remove ice (wet removal process), with the unfrozen water being transported and frozen above or below these depths. This matches fairly well the observed near-dry permafrost at 5–20 m, and the depth difference can be attributed to the simplified stratigraphy in the model (single sediment type and not multi-layered), which would affect the values of the thermal diffusivity. Below the effects of the stresses caused by decaying thermal amplitude (~22 m), the wet removal process has no effect, and the emplaced ground ice is only very slowly modified by upward migration of unfrozen water along the geothermal gradient. The two ice lenses at 37 and 45 m depths occur below the depth of zero thermal and stress amplitudes and would not be modified by the seasonal temperature and stress fields that induce the downwards migration of unfrozen water.

Fig. 7. Comparison of ground ice content profile at Friis Hills with the REGO model. a. The depth derivative of the REGO forces residual water speeds plotted in relation to volumetric ice content (VIC) with depth in Friis Hills cores (grey line). Note that because of the enhanced effect of Van der Waals (VdW) forces in the upper 1 m, the depth derivative of the REGO forces within the top 1 m is shown by the red curve and that below is shown by the black curve (both with their separate x-axes). b. The depth derivative of the VdW forces for different grain sizes. c. The ensemble annual average water speed caused by stresses in the icy soils (WS REGO) and by d. the VdW forces (WS VdW), respectively. The soil used was the Fujinomori soil (Watanabe & Mizoguchi Reference Watanabe and Mizoguchi2002) and the migrating water started as 1/10th strength seawater (Table I). Fujinomori soil has a clay, silt and sand composition similar to the Friis Hills cores.
Conclusions
Based on the results presented in this study, the following conclusions can be drawn regarding the cryostratigraphy of Friis Hills and the origin of the ground ice:
• The Friis Hills cores showed four cryostratigraphic units that are independent of sediment types: 1) surficial dry permafrost (0–30 cm), 2) ice-rich to ice-poor permafrost (0.3–5.0 m), 3) near-dry permafrost (5–20 m) and 4) ice-poor to ice-rich permafrost with distinct thin ice layers (20–50 m).
• The ground ice in the uppermost 1 m is characterized by NaCl geochemical facies, high solute loads (3.9–14.3 mg g-1 dry soil) and δ18O values (-19.8‰ to -12.8‰) and a δD-δ18O regression slope of 6.1, plotting below the LMWL. This indicates that the near-surface ground ice in the ice-rich to ice-poor permafrost (0.3–5.0 m) formed from the freezing of evaporated snowmelt. This process occurs on a regional scale in the MDV (Table Mountain, 1945 m a.sl., Victoria Valley, 450 m a.s.l. and University Valley, 1600–1800 m a.s.l.).
• The near-dry permafrost across 5–20 m depths originates from the redistribution of unfrozen water through rheological forces driven by seasonal thermal and stress fields. This allows for the ground ice content to be slowly removed across that depth over 14 Myr.
• The ground ice at < 30 m is characterized by CaSO4 geochemical facies, lower solute loads (0.3–0.5 mg g-1 dry soil) and δ18O values (-35.8‰ to -32.6‰) and δD-δ18O distributed along the LMWL. These ice lenses probably formed from the freezing of meteoric groundwater, as shown by their lenticular structure and high salt load in comparison to snow and glacial ice, although a buried snow/ice origin remains a possibility.
• The deep ice lenses and their meteoric signatures suggest a near-saturated active layer following sediment depositions during the mid-Miocene, similar to modern high Arctic sites, where evaporation in the active layer is limited. Temperature reconstruction based on the corrected δ18O value of the deep ground ice and changes in palaeogeography suggest that the MAAT during the mid-Miocene was ~7–11°C warmer at Friis Hills.
Supplemental materials
Two supplemental figures and eight supplemental tables can be found at https://doi.org/10.1017/S0954102020000619.
Acknowledgements
We would like to thank A. Pyne, R. Pyne and Webster Drilling (T. Kingan and A. Rutten) for retrieving and logging the cores. Special thanks are given to N. Bertler for allowing us to use the GNS Ice Core Facility to store and sample the permafrost cores and A. Philips for welcoming us to use the GNS Science Stable Isotope Laboratory as a transition facility. Laboratory work was made possible with the help of the technical staff at the Sedimentology and Water Quality Laboratory at the Victoria University of Wellington (J. Chewings), the Geography Laboratory at the University of Ottawa (J. Bjornson) and the Geochemistry Laboratory at the University of Ottawa (N. De Silva and S. Mohanty). We would also like to thank the two reviewers for their constructive comments.
Author contributions
MV, WD and DL designed this project. DL and DF created the WATERREGO and REGO models and generated model outputs. MV, WD, DL, KN and DF contributed to data analysis/interpretation and writing the manuscript. RL and TN developed the Friis Hills Drilling Project. Along with HC, they also retrieved the cores and described the sedimentology of the cores. All authors edited the whole manuscript.
Financial support
The Friis Hills Drilling Project (summer 2016–17) was funded by the Past Antarctic Climate Programme. Funding support was provided by the New Zealand Ministry of Business, Innovation and Employment through contracts C05X1001 and ANTA1801. Fieldwork was made possible with the logistical support of Antarctica New Zealand.


