


Introduction
Glacial ecosystems are extensive and biogeochemically active environments that influence downstream ecosystem function including local, regional and global nutrient and hydrologic cycles (Hood et al. Reference Hood, Fellman, Spencer, Hernes, Edwards, D’Amore and Scott2009, Scott et al. Reference Scott, Hood and Nassry2011). Yet, there are relatively few studies describing supraglacial streams and the majority of these have focused on Arctic rather than Antarctic systems (Fortner et al. Reference Fortner, Tranter, Fountain, Lyons and Welch2005 and references therein).
There is the potential for supraglacial streams to occur across the Antarctic continent, but the majority of research has focused on supraglacial streams in the McMurdo Dry Valleys. Supraglacial streams are characterized by unique features, which distinguish them from other stream systems (Scott et al. Reference Scott, Hood and Nassry2011). These defining characteristics are their rapid rate of incision and change during the ablation season, and the presence and influence of shifting moulins and glacial geomorphology in defining stream structure and flow (Knighton Reference Knighton1981). Melting and flow is predominately controlled by physical factors, such as solar radiation and air temperature, with net shortwave radiation accounting for 60–80% of the melt, while sensible and latent heat account for the remainder (Röthlisberger & Lang Reference Röthlisberger and Lang1987, Hodson et al. Reference Hodson, Anesio, Tranter, Fountain, Osborn, Priscu, Laybourn-Parry and Sattler2008).
Supraglacial streams that form each year are classified as annual, whereas those that occupy an established channel are perennial (Ewing Reference Ewing1970). However, Knighton (Reference Knighton1981) suggests that the degree to which supraglacial streams are contained is limited because of the downstream movement of ice and continuous incision necessary to maintain a channel. This instability is an important characteristic of supraglacial systems and may prevent the accumulation of long-term colonization by algal communities (Scott et al. Reference Scott, Hood and Nassry2011).
The presence and accumulation of sediment on glacial surfaces is important to the formation and functioning of supraglacial stream systems, as well as to the geochemical evolution of supraglacial stream chemistry (Fortner et al. Reference Fortner, Tranter, Fountain, Lyons and Welch2005). Sediment deposition on the McMurdo Dry Valleys is largely controlled by wind speed and direction (Lancaster Reference Lancaster2002), supraglacial stream channels are effective at capturing aeolian sediments and preventing their further redistribution (Fortner et al. Reference Fortner, Tranter, Fountain, Lyons and Welch2005). Furthermore, it has been proposed that the accumulation of sediment leads to surface roughening, which serves as a feedback mechanism by allowing rougher surfaces to capture more sediment (Hodson et al. Reference Hodson, Anesio, Tranter, Fountain, Osborn, Priscu, Laybourn-Parry and Sattler2008).
While supraglacial systems are less stable and have less of a legacy than terrestrial streams, organic matter (OM) and microbial populations are still present in these supraglacial environments. Allochthonous sources of OM in supraglacial settings are primarily from windblown material, while autochthonous production is by microbial populations in snow, cryoconites, sediments and meltwater (Barker et al. Reference Barker, Sharp, Fitzsimons and Turner2006, Foreman et al. Reference Foreman, Sattler, Mikucki, Porazinska and Priscu2007, Smith et al. Reference Smith, Schmit, Foster, Littman, Kuypers and Foreman2016). Supraglacial streams tend to have extensive reaches that are devoid of rocks and sediment, the substrates where biofilms typically form. The lack of these substrates reduces contact with benthic microbial communities and the potential for nutrient and carbon retention; thus OM retention and larger microbial communities tend to occur in low gradient areas with sediment deposits. Additionally, low gradient areas may favour OM production by planktonic microbes (Scott et al. Reference Scott, Hood and Nassry2011).
Stream systems within the McMurdo Dry Valleys are highly variable on a seasonal, interseasonal and daily basis (House et al. Reference House, McKnight and von Guerard1995, Welch et al. Reference Welch, Lyons, Whisner, Gardner, Gooseff, McKnight and Priscu2010). Fortner et al. (Reference Fortner, Tranter, Fountain, Lyons and Welch2005) found that during the extremely warm summer of 2001–02, Canada Glacier in the Taylor Valley, Antarctica, underwent a shift to mass loss dominated by meltwater, whereas ablation had dominated during the previous 10 years. Large increases in glacial meltwater during the 2001–02 summer led to total annual flows in the Onyx River that were >40 times higher than during the cold and dry summer of the previous year. An investigation of the drivers of the flood by Doran et al. (Reference Doran, McKay, Fountain, Nylen, McKnight, Jaros and Barrett2008) found the flood year to be associated with significant increases in mean summer temperature and degree days above freezing, although it is recognized that solar radiation is the primary drive of melt in these systems (MacDonell et al. Reference MacDonnel and Sean2012, Hoffman et al. Reference Hoffman, Fountain and Liston2014).
The Cotton Glacier stream represents a unique system unlike others previously studied in Antarctica, differing dramatically in size, hydrologic functioning and geomorphology. For instance, Fortner et al. (Reference Fortner, Tranter, Fountain, Lyons and Welch2005) focuses on supraglacial streams with channels <3 km in length fed by meltwater from cryconite holes. The Cotton Glacier stream is a much larger system, c. 16 km in length, fed by large shallow areas of meltwater with distinctive annual hydrologic regimes that we hypothesize are controlled by downstream moulins. Here we describe these basic hydrologic and geomorphological controls on the supraglacial stream system located on the Cotton Glacier and their relationship to some simple measures of biological activity and chemical properties. We use the Onyx River flow records coupled with data from the supraglacial Cotton Glacier stream to discuss the functioning of supraglacial systems during high and low flow summers in Antarctica.
Site descriptions
The McMurdo Dry Valleys region of Antarctica comprises the largest ice-free area of the Antarctic continent, c. 4800 km2. The McMurdo Dry Valleys are classified as polar deserts where <10 cm of precipitation falls per year (only as dry snow) and mean annual temperatures range between -15 to -30°C (Doran et al. Reference Doran, McKay, Clow, Dana, Fountain, Nylen and Lyons2002, Barrett et al. Reference Barrett, Virginia, Lyons, McKnight, Priscu, Doran, Fountain, Wall and Moorhead2007). The region experiences katabatic winds, which are important in controlling local climate, physical weathering and material transport (Green et al. Reference Green, Angle and Chave1988, Nylen et al. Reference Nylen, Fountain and Doran2004). The combination of cold temperatures and extremely arid conditions results in a unique ecosystem where streamflow occurs for only 4–10 weeks per year (McKnight et al. Reference McKnight, Niyogi, Alger, Bomblies, Conovitz and Tate1999).
Cotton Glacier and Cotton Glacier stream
The Cotton Glacier (Figs 1 & 2) (77°07'S, 161°40'E) was discovered during the British Antarctic Expedition of 1910–13 by Griffith Taylor of the Western Geological Party (Wright & Priestly Reference Wright and Priestley1922). The Cotton Glacier is located within the Transantarctic Mountains, north of Victoria Valley between Sperm Bluff and Queer Mountain. The supraglacial stream is c. 16 km long and flows eastward before disappearing into a series of moulins and ultimately draining into McMurdo Sound (Foreman et al. Reference Foreman, Cory, Morris, SanClements, Smith, Lisle, Miller, Chin and McKnight2013). Over the course of its length the stream flows through sections of ice, moulins and large sediment deposits of unknown origin (i.e. possibly fluvial, windblown or glacial).
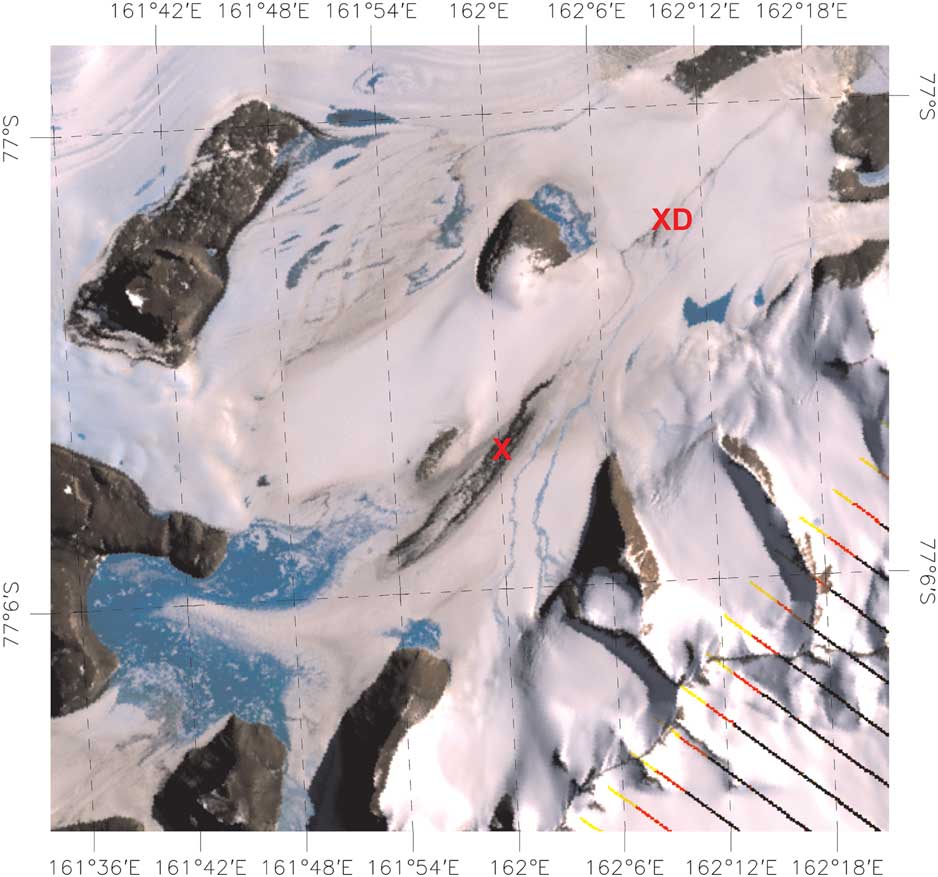
Fig. 1 Composite image of the Cotton Glacier and Cotton Glacier stream system on 21 December 2010. The red ‘X’ denotes the location of sampling during the 2010–11 summer. The red ‘XD’ is the location of the grab sample collected from below the moulins in 2011. The direction of stream flow is from ‘X’ toward ‘XD’ in this image.
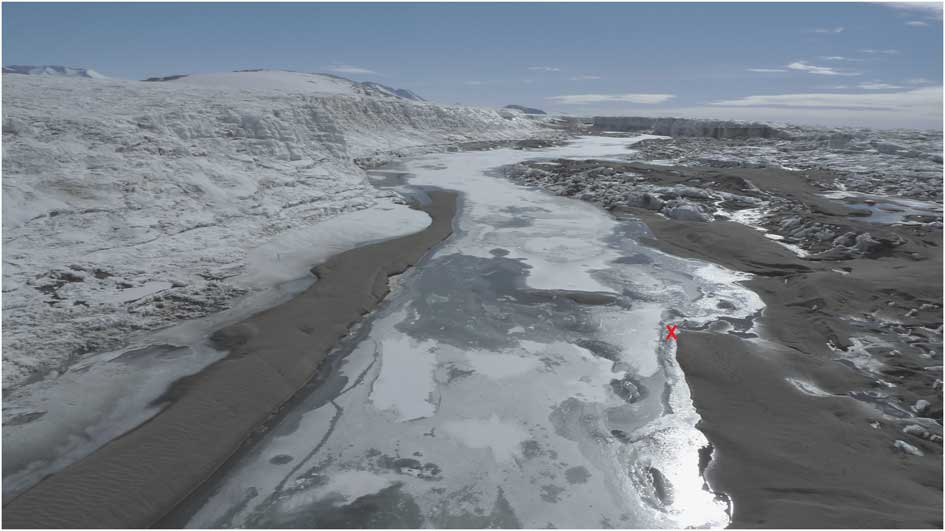
Fig. 2 Aerial drone image of the Cotton Glacier stream system showing the large sediment deposits occurring on the glacier surface and the deeply incised channel. The red ‘X’ represents the main sampling site for the 2010–11 summer. The direction of stream flow is from the bottom toward the top of the image.
The satellite imagery and aerial photographs shown in Figs 1 & 2 provide an overview of the Cotton Glacier stream system. In the lower left-hand corner of Fig. 1 areas of open blue ice and meltwater accumulation can be seen on the surface of the glacier with streams converging toward the sampling location (denoted by a red ‘X’ in Fig. 1). Figure 3 shows the maps of the spectral unmixing coefficients for water in the case of the LANDSAT data acquired on 19 November 2011 (Fig. 3a) and 21 December 2011 (Fig. 3b). In Fig. 3, blue to green values indicate those areas when the near-infrared (NIR) reflectance acquired in December is lower than that acquired in November. The opposite is true for the colours ranging from red to yellow. Large positive increases (yellow) occur mostly over snow or glacier areas. This may be due to the presence of new accumulation, which tends to increase the NIR reflectance of the snowpack. On the other hand, the largest negative changes (dark blue) correspond to the presence, extension or insurgence of water bodies.
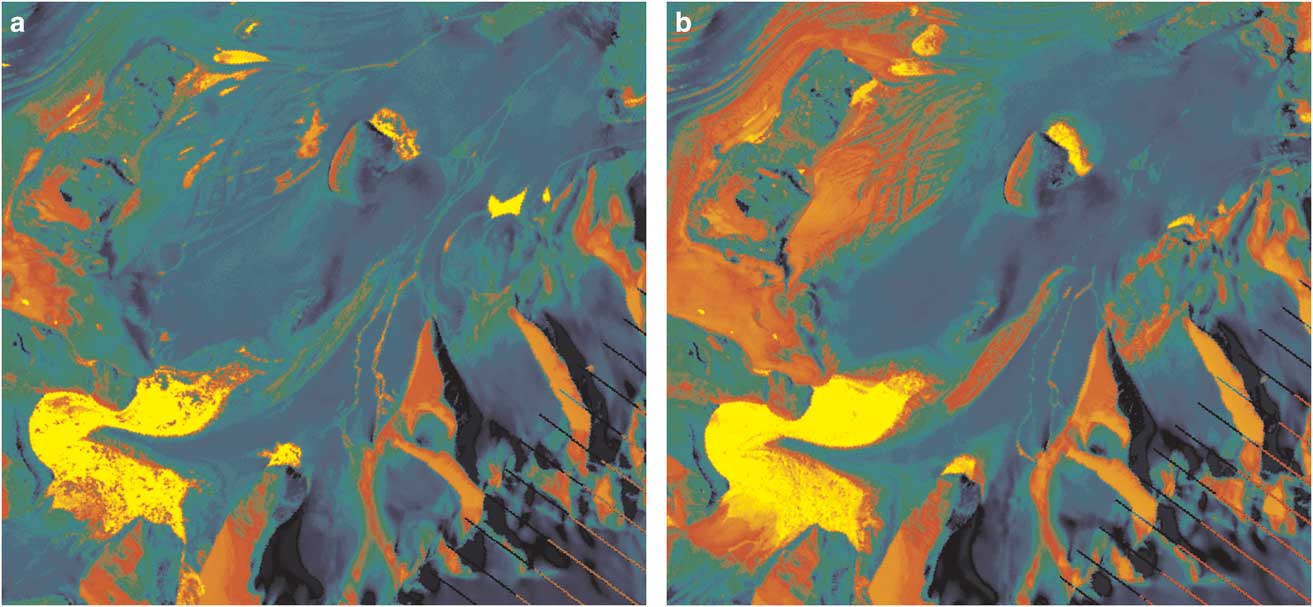
Fig. 3 Spectral unmixing coefficients for water for a. 19 November and b. 21 December 2010. Blue to green values indicate cases when the near-infrared (NIR) reflectance acquired in December is lower than the one acquired in November, and the opposite is true for red to yellow. Large positive increases (yellow) occur mostly over snow or glacier areas. Dark blue represents the largest negative changes and correspond to the presence, extension or insurgence of water bodies.
Onyx River
Located in Wright Valley in the McMurdo Dry Valleys, the Onyx River is Antarctica’s longest river at c. 30 km in length, c. 10 m in width and c. 0.5 m in depth (McKnight et al. Reference McKnight, Niyogi, Alger, Bomblies, Conovitz and Tate1999). The Onyx River flows inland over bedrock channels, alluvial flats, moraine complexes and boulder pavement from Lower Wright Lower Glacier into Lake Vanda. The river receives overflow from Lake Brownworth and different sources of inflow from numerous tributary streams along the way, which drain from surrounding glaciers. Due to its location, the Onyx River may be affected by climatic conditions in McMurdo Sound along with those in the Wright Valley (McKnight et al. Reference McKnight, Niyogi, Alger, Bomblies, Conovitz and Tate1999, Green et al. Reference Green, Stage, Preston, Wagers, Shacat and Newell2005). Higher flows in the Onyx River indicate greater losses of glacial mass as meltwater, and increased supraglacial stream activity and thawing of cryoconites (Foreman et al. Reference Foreman, Sattler, Mikucki, Porazinska and Priscu2007). Extensive data is publically available for the Onyx River as it is part of the McMurdo Dry Valley’s Long-Term Ecological Research (MCM LTER) programme and has been monitored for the last 46 years (www.mcmlter.org). The Onyx River is located in a similar geographical location to the Cotton Glacier stream making it well suited for comparisons between the two systems.
Data collection
Cotton Glacier meteorological station
We established a meteorological (MET) station on the surface of Cotton Glacier during the 2010–11 summer. The station was located at 77°04'273''S, 162°01'653''E and was active between 24 November 2010 and 29 December 2010. The station was installed 1.5 m above the ice surface using two 2.3 m poles and a cross-arm with Nu-rail fittings. Data were collected using a Campbell Scientific CR10XT-XT datalogger (Campbell Scientific, Shepshed) powered by a 10 W solar panel with a 32 amp hour battery housed in a weather resistant 12×14'' Campbell Scientific enclosure. This MET station was configured to measure air temperature using a Campbell Scientific 107 temperature probe and relative humidity with a Vaisala HMP45C relative humidity/temperature probe shielded by a Campbell Scientific solar radiation shield. Additionally, incoming and outgoing solar radiation were measured using a Li-Cor LI-200x pyronanometer (Li-Cor, Lincoln, NE) across the wavelengths 400–1100 nm. Wind speed and direction were measured with a RM Young 5103 wind monitor (RM Young, Traverse City, MI). Wind speed was sampled every 4 sec and averaged at 15 min intervals; all other parameters were measured every 30 sec and averaged at 15 min intervals.
Cotton Glacier stream hydrology
A Valeport Model 106 current meter (Valeport, Totnes) was deployed in the Cotton Glacier stream on 24 November 2010 with the intent of monitoring flow data throughout the season. However, extremely high waters and shifting ice damaged the meter and made repair and redeployment impossible. Measurement of stream flow by manual methods was delayed until the 29 January 2011 by weather and equipment availability. Water depth was monitored using a HOBO U20 water level datalogger (Onset, Bourne, MA). The data presented are not corrected for barometric pressure as barometric pressure measurements were not available in the area. On the 29 November 2011 stream flow was measured using a FlowTracker handheld acoustic doppler velocimeter (Sontek, San Diego, CA) with CPU firmware version 3.7 and software version 2.3. Stream channel width was measured manually at 18.2 m. Data was recorded at 31 individual measuring stations across the stream channel and used to calculate stream flow and velocity.
Onyx River stream flow data
The Onyx River has been monitored since 1968 when the New Zealand Ministry of Works established a weir near the inlet to Lake Vanda and continues to be monitored at the time of this work (2010) as part of the MCM LTER programme. An additional site was established in the Lower Wright Valley in 1972. Both sites employed CR10 dataloggers (Campbell Scientific), pressure transducers (Paroscientific, Redmond, WA) and Accubars (Sutron, Sterling, VA) to measure river stage. Measurements are recorded every 15 min throughout the active season (http://www.mcmlter.org/index.html).
Water chemistry analyses
All Cotton Glacier stream water samples were processed following the protocols of the MCM LTER programme (Priscu & Wolf Reference Priscu and Wolf2000). Samples for non-purgeable dissolved organic carbon (DOC) and total organic nitrogen (TON; not presented here) were analysed on either a Shimadzu TOC-V or TNM-1 analyzer (Shimadzu, Kyoto). Samples for the above analyses were filtered in the dark through 25 mm pre-combusted GF/F filters and stored in pre-combusted amber vials prior to analysis. The filters from DOC/TON were used for chl a analysis and preserved until extraction. Extraction of chl a was completed in a 1:1 solution of 90% acetone and DMSO for 12 h under dark conditions at -20°C. Following extraction, samples were analysed using a Turner 10AU fluorometer (Turner Designs, San Jose, CA). Pigment concentrations were based on scans from visible wavelengths (400–750 nm), and chl a concentrations were calculated using the trichromatic equations described by Jeffrey & Humphrey (Reference Jeffrey and Humphrey1975). Dissolved inorganic carbon (DIC) was measured using an infrared gas analyzer on chloroform acidified samples. Water was filtered through 25 mm pre-combusted GF/F filters for macronutrient analysis and frozen prior to analysis on a Lachat flow injection analyser (Lachat, Loveland, CO). Samples for anion and cation analysis were filtered through 0.4 µm 47 mm Nucleopore filters and the filtrate was analysed on a Dionex DX-120 ion chromatography system. Samples for particulate organic carbon (POC) and particulate organic nitrogen (PON) were filtered through 25 mm pre-combusted GF/F filters, allowed to air dry at room temperature for 12 h and frozen prior to analysis. A Flash EA 112 elemental analyzer (ThermoQuest, Waltham, MA) was used to analyse POC/PON samples.
Spectroscopy
Streamwater samples were collected for analysis by UV-Vis and fluorescence spectroscopy in pre-combusted 125 ml amber glass bottles, placed in coolers for transport to the laboratory and filtered through pre-combusted GF/F filters into acid washed pre-combusted amber bottles prior to analysis.
Samples were analysed for UV-absorbance using an Agilent 8453 UV-spectrophotometer (Agilent, Santa Clara, CA) in a 1 cm quartz cuvette. Samples were scanned from 190 nm to 1100 nm. Samples with absorbance >0.3 at 254 nm (A254) were diluted with Milli-Q water until within the range of 0.2 to 0.1 to prevent inner-filter effects during collection of excitation emission matrices (EEMs) (Miller & McKnight Reference Miller and McKnight2010, Miller et al. Reference Miller, Simone, McKnight, Cory, Williams and Boyer2010). The EEMs were collected using a Fluoromax-3 fluorometer (Horiba Jobin Yvon, Paris) over an excitation range of 240–450 nm, in 10 nm increments while emission was monitored from 300–600 nm and 300–560 nm in 2 nm increments. All scans were corrected for instrument specific bias using manufacturer supplied correction factors for both excitation and emission wavelengths, normalized to the area under the raman curve at emission 350 nm, corrected for inner-filter effects using UV-Vis absorbance scans and blank subtracted using corrected EEMs of daily Milli-Q blanks analysed over the same wavelengths as the samples (McKnight et al. Reference McKnight, Boyer, Westerhoff, Doran, Kulbe and Andersen2001, Cory & McKnight Reference Cory and McKnight2005, Cory et al. Reference Cory, Miller, McKnight, Guerard and Miller2010, Miller et al. Reference Miller, Simone, McKnight, Cory, Williams and Boyer2010).
Sediment extracts
Sediment samples were collected at the Cotton Glacier stream during the summers of 2009–10 and 2010–11. Samples were collected along transects originating in the centre of the stream (when possible) and running perpendicular to the stream channel, terminating in dry sediment deposits upslope of the previous season’s water line. Samples were collected using an acid washed stainless steel spatula and placed in Whirl-pak bags for transport to the lab. Sediments were oven dried in a forced hot air oven at 65°C, sieved through a 2 mm sieve, and extracted using a water-to-sediment ratio of 10:1 on an orbital shaker for 1 h. After shaking, extracts were decanted and filtered through pre-combusted (450°C for 12 h) 47 mm Whatman GF/F filters and measured for DOC and spectroscopy as described above.
Imagery
Red, Green, Blue (RGB) composites were obtained from LANDSAT data acquired on 19 November and 21 December 2010. LANDSAT data is provided as digital numbers and are converted into reflectance values accounting for several factors (such as solar angle, day of the year, latitude and longitude, etc.) The image was acquired during optimal illumination conditions (solar zenith angle c. 27° and no cloud cover); although shadowing effects can still be seen because of the topography of the region.
Beside visible data, LANDSAT also acquires data in the NIR region. In the NIR region, soil is brighter than in the visible one and the opposite happens to water, which is practically black in the NIR region. The presence of water over one area of a pixel can therefore be identified by the reduction of the values in the NIR.
A different approach called ‘spectral unmixing’ was used to identify the individual constituent materials present in the mixture, as well as the proportions in which they appear. In spectral unmixing the measured spectrum of a mixed pixel is decomposed into a collection of constituent spectra, or endmembers, and a set of corresponding fractions, or abundances or spectral unmixing coefficients, that indicate the proportion of each endmember present in the pixel. Thus, the measured spectrum of each pixel is decomposed as a linear combination of the endmembers spectra. The coefficients relating the measured and theoretical spectra represent the unmixing coefficients. These are not strictly the percentage of the pixel occupied by the endmember, but they are proportional to their abundance in that pixel. In this way, we produced maps of spectral unmixing coefficients depicting the abundance of a material (e.g. water) in that pixel.
Images of Cotton Glacier were also collected with an unmanned aerial vehicle (UAV). The UAV uses a unique six-rotor design and is operated with a handheld controller (http://www.draganfly.com/uav-helicopter/draganflyer-x6/features/controller.php) while viewing what the helicopter sees through video glasses or a computer mobile stand. Flight parameters (e.g. GPS positioning, elevation, and tilt and orientation) are saved continuously on a log file on a micro SD card in the remote control. The camera zoom and angle can be controlled by the operator so that specific objects or targets can be selected.
Time-lapse images were captured throughout the day using two Wingscapes weatherproof digital time-lapse plant cameras (Wingscapes, Calera, AL). One camera was mounted on the MET station and captured four images per day. Another was mounted on a steel pole at a height of 1.5 m adjacent to the stream channel and captured hourly images.
Statistical analysis
Two-tailed t-tests on 15 min averages were used to compare air temperature data collected at Lake Hoare during the 2009–10 and 2010–11 summers. The Cotton Glacier stream chl a and DOC concentrations from the 2009–10 and 2010–1l summers were compared using two-tailed t-tests. All statistical tests were evaluated at a significance level of P=0.05. Statistical analyses were conducted in R version 3.2.4.
Results
Climate, geomorphology and hydrology
The hydrology of the Cotton Glacier stream varied remarkably between the two summers during which we sampled. These changes are reflective of the flow patterns seen in the Onyx River during the same two years where flow was 0.85×10⁶m3 and 8.55×10⁶m3 in the 2009–10 and 2010–11 seasons, respectively (Fig. 4). The 2010–11 Onyx River flow was the sixth highest flow on record, 39.4% of the volume recorded during the 2001–02 flood year, and 225.0% greater than the mean annual volume of 3.80×10⁶m3. During 2009–10, the year with lower Onyx River discharge, the Cotton Glacier stream never exceeded 0.60 m depth on our four sampling dates. Similarly, stream flow results from 29 January 2011 revealed stream temperature and velocity of -0.05°C and 0.3 m s-1, with an average depth of 0.17 m. Using 31 individual measuring stations across the stream the flow was determined to be 0.11 m3s-1. This measurement reflects the relatively stable flow and stream depth before and after the peak in water depth (see Fig. 5). While baseline flows had slightly greater water depth in 2009–10 there was no evidence of the dramatic pooling and subsequent rapid draining that occurred in 2010–11 (the year of greater Onyx River flow) where water depths of 3.5 m were measured (Figs 4 & 5).
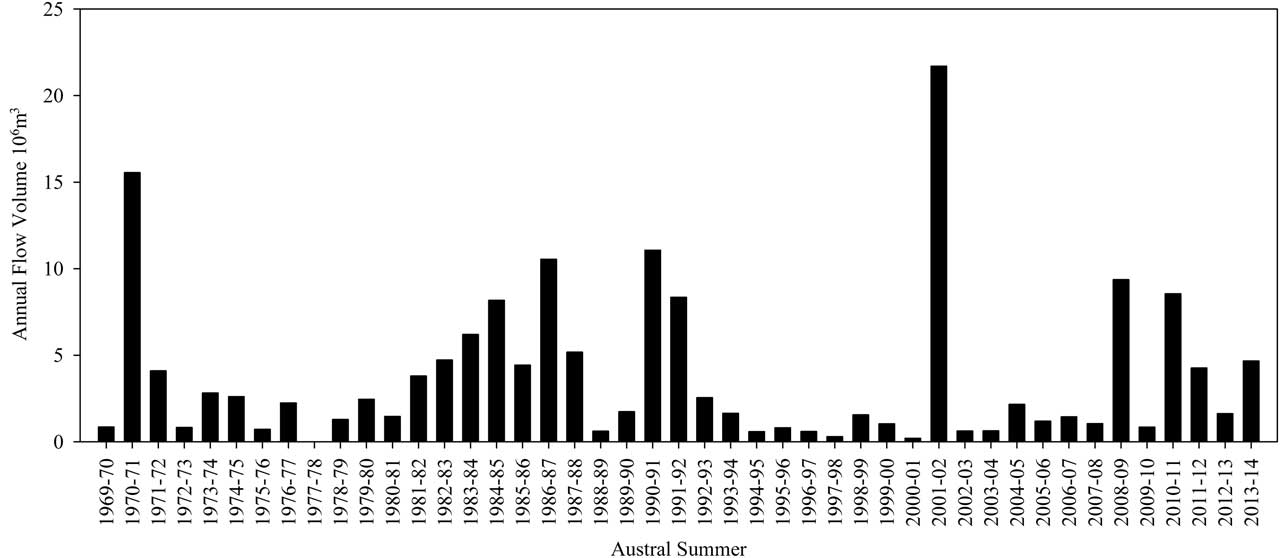
Fig. 4 Records of total annual flow volume for the Onyx River from 1969–2014. Measurements are recorded every 15 min throughout the active season (http://www.mcmlter.org/index.html).
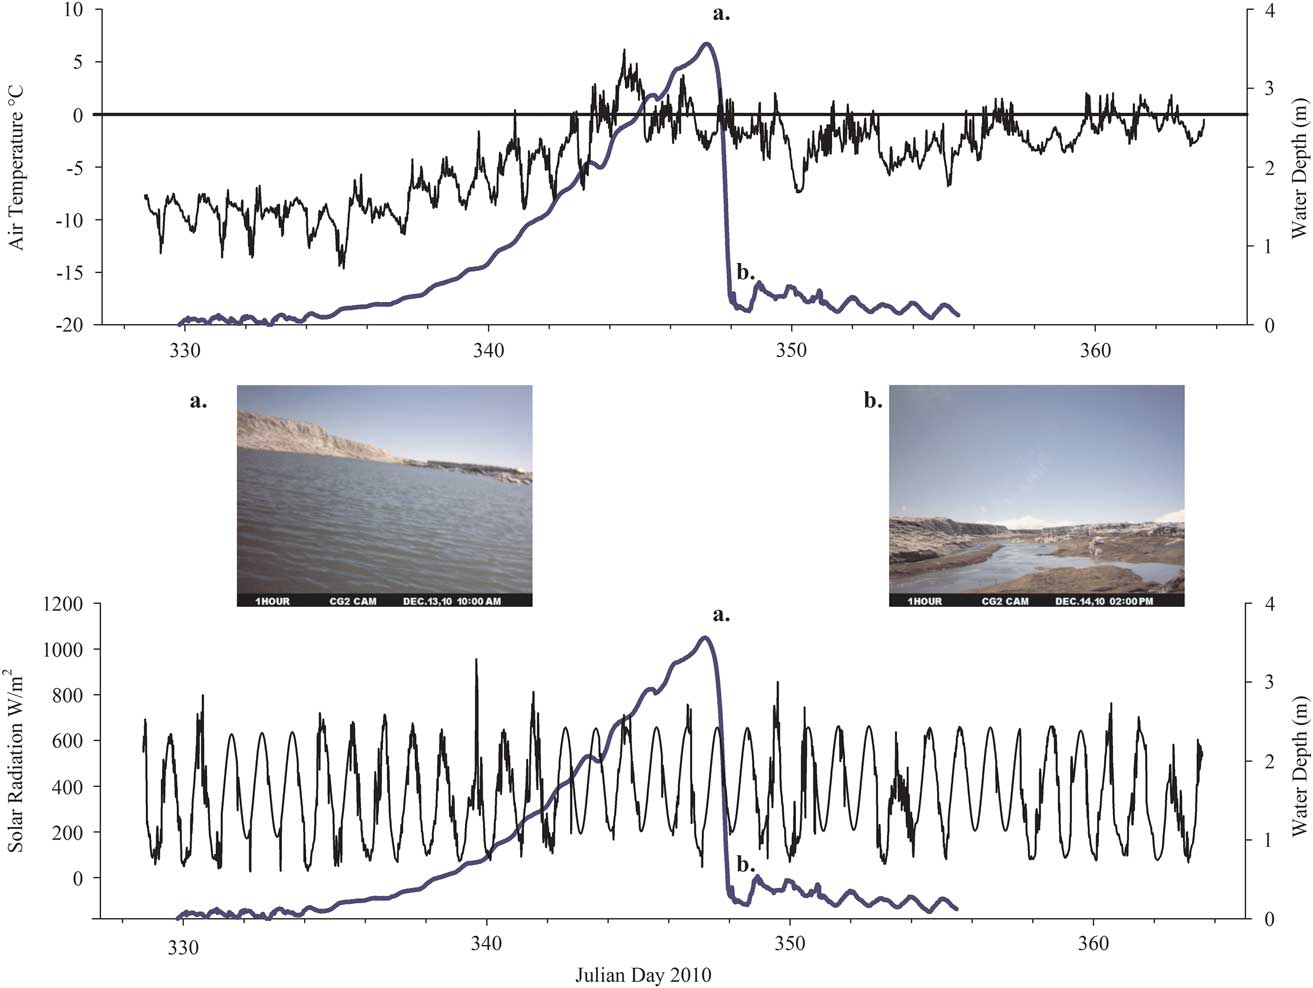
Fig. 5 Air temperature, incoming radiation and stream depth for the Cotton Glacier stream system during the 2010–11 summer. a. Peak stream depth and b. the stream immediately following the rapid draining event that occurred on 13–14 December 2010.
The Cotton Glacier stream channel width was measured by hand on 24 November 2010 prior to large increases in water depth and significant pooling. Five measurements were taken c. 10 m apart along the stream channel in the main sampling area. There was considerable variability in the stream channel width with measurements of 17.6 m, 25.9 m, 24.4 m, 16.4 m and 17.7 m (mean 18.2 m).
Figure 5 displays air temperature, incoming solar radiation and stream depth for the Cotton Glacier stream during November and December 2010. Mean air temperature between 24 November 2010 and 29 December 2010 at the Cotton Glacier stream was -4.2°C (range -14.7–+6.2°C). Despite 24 hours of sunlight, incoming radiation displayed distinctly diurnal patterns. Mean incoming radiation was 367.7 Wm-2 (range 26.7–956.0 W m-2) while mean outgoing radiation (not shown) was 158.7 W m-2 (range 11.0–475.0 W m-2).
Wind direction on Cotton Glacier was predominately from the north-east blowing up the glacier from McMurdo Sound. However, the greatest wind speeds occurred when the winds were blowing from the south-west down-glacier. The average wind speed on the Cotton Glacier was 1.03 m sec-1 (range 13.3–0 m sec-1).
Stream chemistry and dissolved organic matter characterization
During both summer seasons the Cotton Glacier stream pH was circumneutral and the concentrations of all measured parameters were low (Table I). Despite the significant changes in hydrology the Cotton Glacier stream demonstrated little variation across seasons and water chemistry values remained low during both years of sampling. Average DOC values for the 2009–10 and 2010–11 seasons were 0.70 mg C l-1 and 1.14 mg C l-1, respectively. There was no significant difference between years (P>0.05). For both field seasons, chl a concentrations varied throughout the summer sampling times. The mean chl a concentrations were 0.27 µgl-1 and 0.12 µgl-1 for the 2009–10 and 2010–11 field seasons, respectively. The difference in mean chl a concentration between the two field seasons was not significant (P>0.05).
Table I Cotton Glacier stream chemistry for the 2009–10 and 2010–11 field seasons.

DIC = dissolved inorganic carbon, DOC = dissolved organic carbon.
Analysis of DOM by fluorescence spectroscopy during the 2009–10 and 2010–11 seasons revealed humic-free waters Ex:320-360 Em:420-460 and Ex:260 Em:400-460 (Fig. 6), an extreme rarity in natural systems seen only in a grab sample collected from the Cotton Glacier stream in 2004–05. Despite this repeat observation, this system did demonstrate subtle shifts in DOM fluorescence signature both spatially and temporally during our two years of sampling.
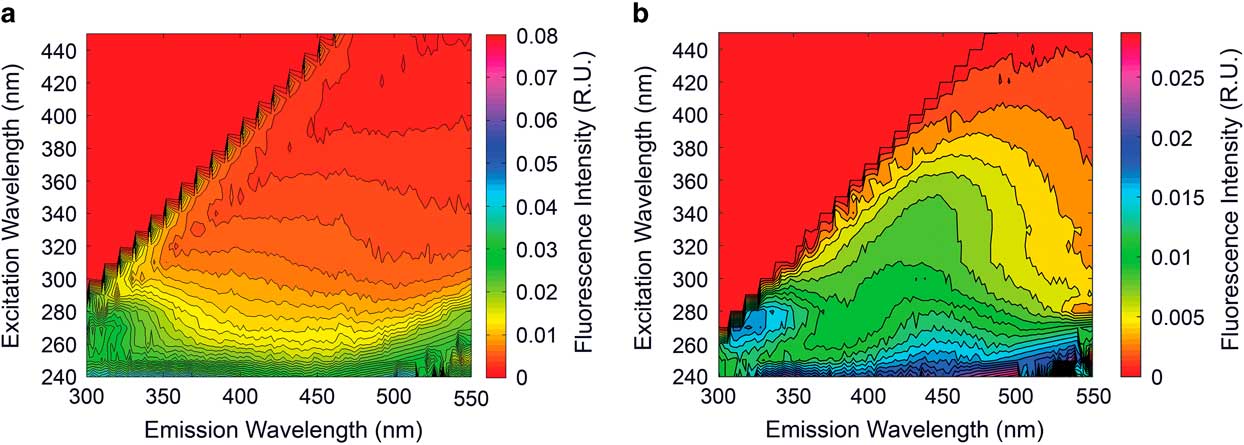
Fig. 6 Excitation emission matrices (EEMs) from a. the Cotton Glacier stream and b. the Canada Glacier stream in the McMurdo Dry Valleys. Note the absence of a humic signature in the Cotton Glacier EEM (i.e. peak Ex:320-360 Em:420-460 and Ex:260 Em:400-460 regions).
During the initial flushing and contact with stream water at the onset of flow during the summer of 2009–10, fluorescence spectroscopy revealed the presence of a red-shifted fluorescence signature Ex:280-300 Em:380-400, which was also found in leachates of a dry sediment sample collected near the stream (Fig. 7). However, this pulse was transient and following the initial flush from sediments the waters of the Cotton Glacier stream returned to a humic-free state as depicted in Fig. 6 and remained as such in all samples collected throughout the 2009–10 and 2010–11 sampling seasons. Dry sediments collected during the 2010–11 field season show a similar fluorescence signature as those extracts from dry stream sediments in 2009–10.
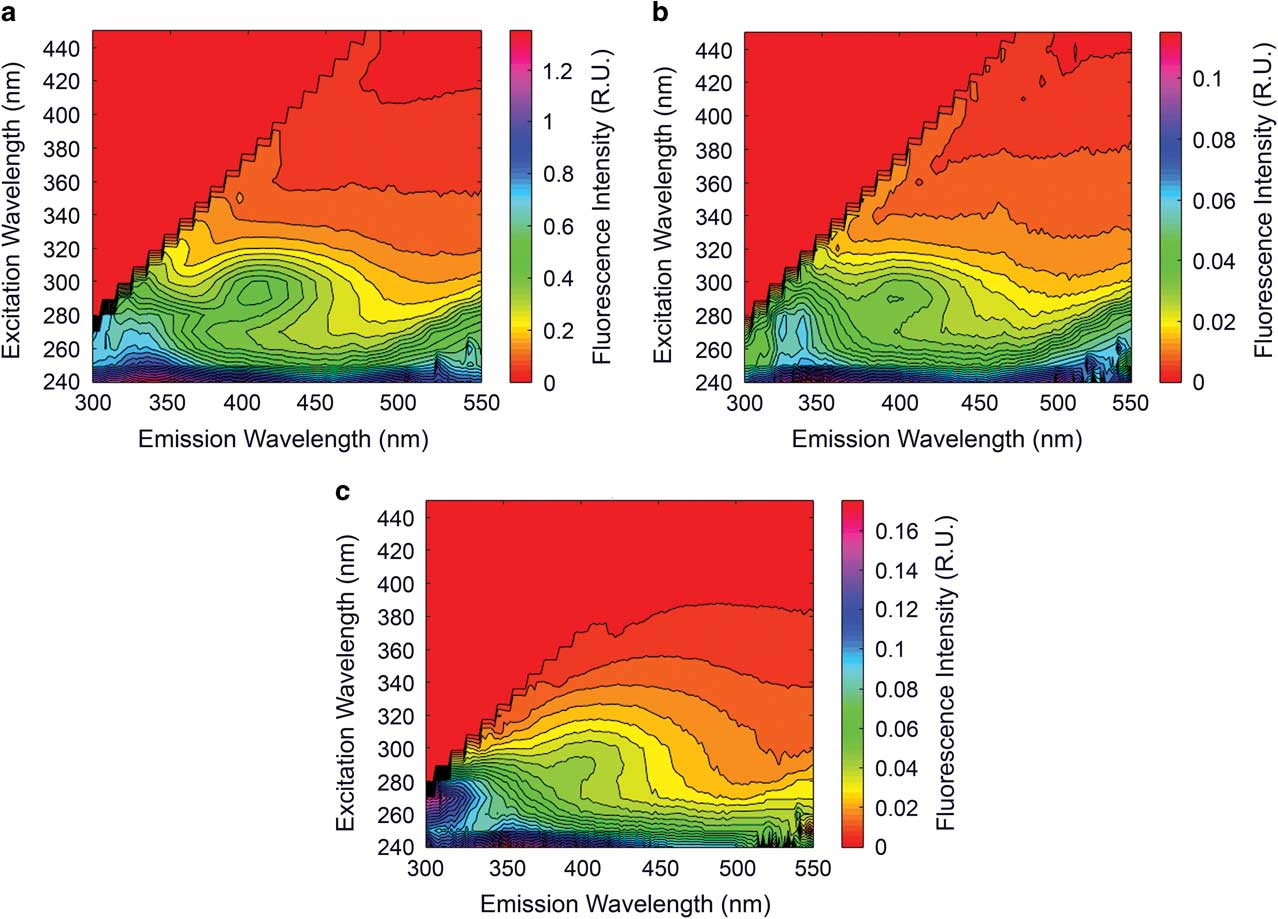
Fig. 7 Excitation emission matrices (EEMs) from sediment extracts and water collected from the Cotton Glacier stream a. above the water line prior to submergence during the 2009–10 summer, b. during the initial pulse of water as the stream began to flow in 2009, and c. above the water line during the 2010–11 summer. The stream water sample collected early in the 2009–10 summer demonstrates the same fluorescence signature as the leachates suggesting that dilute glacial meltwaters flush dry sediment resulting in a pulse of dissolved organic matter.
A stream water DOM sample collected from the lower reach, after emerging from the series of moulins on the Cotton Glacier stream on 12 January 2011 revealed a similar, but slightly red-shifted (with respect to upstream), humic-free fluorescence signature (Fig. 8).
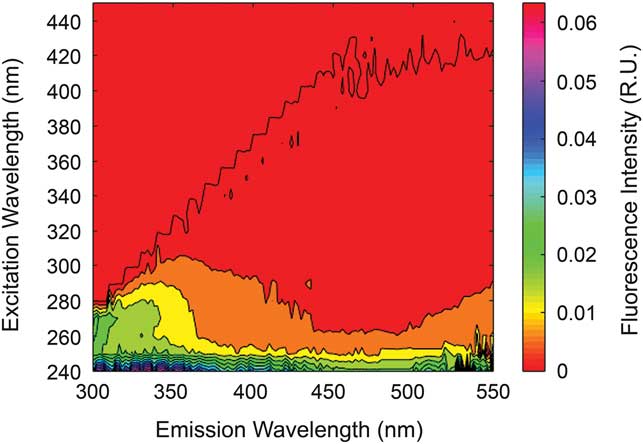
Fig. 8 Excitation emission matrix (EEM) from below the Cotton Glacier moulins.
Discussion
Climate, geomorphology and hydrologic function
The Cotton Glacier stream exhibits characteristics of both annual and perennial supraglacial streams along its c. 16 km reach. The headwaters of the stream flow across a broad area of the glacier before entering a large series of annually persistent channels (Fig. 1). The fluvial system that has formed on the Cotton Glacier is probably driven by deposition of sediments from the Transantarctic Mountains to the glacier surface. Sediment deposition would result in decreased albedo and increased runoff and extent of melt, a theory supported by the MET station data and satellite imagery collected during the 2010–11 summer. The MET station data revealed that the maximum measured wind speeds occurred in the downstream direction. Winds blowing sediment in the downstream direction would be consistent with the theory of sediment deposits from upstream mountains being deposited on the glacier surface and facilitating rapid melting and formation of the supraglacial stream features found on the Cotton Glacier. It may be important to note that the overall low wind speeds (maximum 13.3 ms-1) may have been influenced by the location of the MET tower within the canyon-like feature at the sampling point. Had the MET station been placed higher on the glacier surface it is possible that both mean and maximum wind speed values would have been greater; however, the glacier surface was not easily reachable due to steep and unstable walls.
Hydrologic drivers and relationship to the Onyx River flow
The geomorphology, climate and hydrologic characteristics of the Cotton Glacier stream result in an extremely dynamic system capable of vastly different flow regimes that appear to be driven by interactions between radiation, temperature and channel geomorphology.
Previous work has demonstrated that solar radiation dominates melt in these systems, but that mean summer temperatures are also important (Doran et al. Reference Doran, McKay, Fountain, Nylen, McKnight, Jaros and Barrett2008, MacDonell et al. Reference MacDonnel and Sean2012, Hoffman et al. Reference Hoffman, Fountain and Liston2014). A comparison of Lake Hoare temperatures between 1 November 2009 and 1 January 2010 (-4.2°C) and 1 November 2010 and 1 January 2011 (-3.9°C), while significantly different (P>0.05, two-tailed t-test on 15 min averages) are both still below freezing, highlighting the role of solar radiation in driving the large differences in Onyx River flows of 0.85×10⁶m3 in 2009–10 vs 8.55×10⁶m3 in 2010–11 (Fig. 4). Maximum summer temperatures may play an important role as well. Summer maximum temperatures in 2009–10 and 2010–11 at Lake Hoare were 5.56°C and 8.90°C, respectively, and may have been a contributing factor to the ten fold increase in flow. The same comparison could not be made for the ice-free (i.e. non-glacial) MET station located at Lake Brownworth as the data record was missing for much of the 2010 summer.
With only one season (2010–11) of temperature and radiation data from the Cotton Glacier we cannot be certain that temperature patterns at Lake Hoare in the McMurdo Dry Valleys are representative of those at the Cotton Glacier. However, the preliminary data we captured suggests the Onyx River may be a good correlate for the Cotton Glacier stream and other supraglacial systems in the Transantarctic Mountains. This notion is supported by the work of Cozzetto (Reference Cozzetto2009), who found significant correlations between broad climate phenomena (e.g. the Antarctic Oscillation), regional air temperatures and the flow of the Onyx River and other streams across the McMurdo Dry Valleys.
The depth data and time-lapse imagery collected during the 2010–11 summer (Fig. 5) suggest that downstream ice dynamics also play a central role in the hydrologic functioning of this system by creating ice dams, which drive meltwater flow in this supraglacial stream. The steady increase in water depth followed by a rapid decrease seen in Fig. 5 suggests the formation, limited persistence and rapid removal of an ice dam, a phenomenon not seen in 2009–10. Such shifts in hydrology appear to have a direct effect on the chemistry and microbiology of this system.
Influence on biogeochemical and microbial properties
The Cotton Glacier stream is chemically dilute (Table I) and lacks all but the most transient red shifted signature; seen in only one sample during the 2009–10 and 2010–11 field seasons (Fig. 7). A humic signature was not found in the limited samples collected during an exploratory visit in 2004 either (Foreman et al. Reference Foreman, Cory, Morris, SanClements, Smith, Lisle, Miller, Chin and McKnight2013). Climate and the lack of higher vegetation alone are not sufficient to explain this unique humic-free signature as a humic signature is readily detectable in terrestrial streams of the McMurdo Dry Valleys (Fig. 7). We propose that physical drivers such as shifting ice and the pooling, flushing and scouring of this supraglacial system exert a strong influence on biotic and chemical characteristics within the stream and its sediments. Most notably, the extreme conditions result in the lack of annually persistent algal mats or microbial communities, such as those found in terrestrial streams of the McMurdo Dry Valleys (Alger et al. Reference Alger, McKnight, Spaulding, Tate, Shupe, Welch, Edwards, Andrews and House1997, Foreman et al. Reference Foreman, Cory, Morris, SanClements, Smith, Lisle, Miller, Chin and McKnight2013). While appearing dilute and humic-free relative to other ecosystems, this supraglacial stream does exhibit subtle and fleeting shifts in DOM signature, which seem to be a function of physical processes (i.e. sediment flushing and in-stream biological processing). For example, the similar and transient fluorescence signatures (Ex:280-300 Em:380-400, see Fig. 7) found briefly in Cotton Glacier stream water and sediment leachates suggest that physical flushing mechanisms drive pulses of different quality DOM at varying points in the summer depending upon flow paths. Furthermore, subtle differences in fluorescence signature above and below the series of moulins in this stream (Fig. 8) point toward the possibility of DOM processing mechanisms within the moulin. However, with only one sample from this area it is difficult to be certain. Further research is needed to fully understand the microbial populations and DOM processing occurring in the lower reaches of this system.
Consistent with the previous Cotton Glacier stream study there were detectible concentrations of chl a, which indicates the presence of an autotrophic algal community, capable of surviving the harsh conditions of an Antarctic supraglacial stream. The presence of an autotrophic community with the capability of fixing carbon, serves as a potential source of DOM into the stream ecosystem. A previous, single sample investigation of the Cotton Glacier stream explored the microbial diversity present within the stream and found that the stream was dominated by Proteobacteria and Bacteroidetes lineages (Foreman et al. Reference Foreman, Cory, Morris, SanClements, Smith, Lisle, Miller, Chin and McKnight2013). Both of the dominant lineages found in the stream, which are classified as heterotrophic organisms, are capable of metabolizing complex organic substances. Organisms belonging to the Bacteroidetes lineages have been previously shown to be involved in the uptake of DOM of varying molecular weights and lability (Kirchman Reference Kirchman, Meon, Ducklow, Carlson, Hansell and Steward2001). These preliminary findings suggest the capacity for an internal microbial carbon cycle, beginning with the release of newly fixed carbon compounds by autotrophic community members and a successive uptake and microbial processing by heterotrophic organisms within the Cotton Glacier stream.
Our results suggest that 1±0.2 mg C l-1 may represent a reasonable estimate for DOC concentrations in water draining glaciers of the Transantarctic Mountains; a value similar to the mean DOC concentration of 1.2 mg C l-1 in eleven proglacial streams draining Alaskan maritime glaciers (Hood et al. Reference Hood, Fellman, Spencer, Hernes, Edwards, D’Amore and Scott2009). Despite similar concentrations of DOC, these streams export DOM of significantly different ages. Our data suggests that DOM from the Cotton Glacier stream is very young with just a one year legacy due to extreme scouring and flushing of the stream channel; unlike the ancient (c. 3900 years in age) DOM-draining Alaskan glaciers (Hood et al. Reference Hood, Fellman, Spencer, Hernes, Edwards, D’Amore and Scott2009).
Conclusions
These observations provide some initial insights into the linked hydrologic, chemical and biological functioning of large supraglacial streams in this remote part of the Transantarctic Mountains. Initial characterization of these systems indicates that the physical characteristics, particularly geomorphology, are a critical driver of hydrology and subsequently the microbial community structure and biogeochemical cycling. The transient and sometimes subtle linkages and relationships between these compartments, particularly their influence on DOM properties, illustrate the need for further studies examining supraglacial streams at the system level. This work suggests that future studies addressing carbon cycling and microbial population dynamics in these systems should include geomorphological and hydrologic stream characterization data.
Acknowledgements
We would like to thank Petroleum Helicopters and Raytheon Polar Services for logistical field support. The MCM LTER Stream team provided Onyx River discharge data and Lake Hoare meteorological data. Thomas Nylen assisted in construction of the MET station. We are grateful to the reviewers who took the time to help us improve this manuscript. Funding for this project came from NSF OPP-0338260 to YPC, OPP-0338299 to DMM, and OPP-0338342 and ANT 114978 to CMF. Any opinions, findings or conclusions expressed in this material are those of the authors and do not necessarily reflect the views of the National Science Foundation.
Author contributions
MDS led the writing of this paper as well as much of the data collection and laboratory analysis. HJS assisted with reviewing and editing this work, contributed to writing the sections focused on microbial populations and led the laboratory effort surrounding microbial analyses. CMF led this work as PI of the grant funding this work, assisted with reviewing, editing and developing the overall structure of this paper, contributed to lab and field work, and the writing of sections focused on microbial ecology. MT contributed the remote and satellite imagery, wrote the associated text and assisted in reviewing this work. YPC was a Co-PI on the proposal funding this work and assisted in experimental design, interpretation of results, and the overarching theme and content of this work. CJ assisted in collection of field data, and analysis and text surrounding the MCM LTER data used in this manuscript. DMM was a Co-PI on the proposal funding this work and contributed greatly to the overall structure and themes within this manuscript and assisted in writing the introduction, and provided critical assistance in data interpretation and the design of this field work.


