1. Introduction
In this paper, we identify the maternal cost risk factors of out-of-hospital services covered through Medicare, the government-funded universal health insurance scheme in Australia, with a focus on women who experience adverse birth outcomes. All Australian residents and some categories of non-residents are entitled to Medicare benefits (Medicare Australia, 2016). The subsidies (or “rebates”) provided for each out-of-hospital service covered under Medicare is detailed in the Medicare Benefits Schedule (MBS) Book (Medicare Australia, 2016). Medicare also covers public and private in-hospital services, but these are excluded in this analysis as we focus on out-of-hospital services only. The latest figures that break-down expenditure in maternity services by types of service showed that 7% of the expenditure is for out-of-hospital services (Bryant, Reference Bryant2008) and the remainder is largely attributed to hospital services.
Australia has a complex mixed public and privately funded maternal health care system but we consider the cost in this study purely from the perspective of costs to the government (i.e. publicly funded services) so that the results can be used to inform public policy in the area. Specifically, the definition of cost for this study is the rebate that is paid by the government through Medicare for each eligible out-of-hospital service utilised by a woman in the perinatal period, as this is the cost paid by the government for the service provided. While this rebate is the key cost underpinning the study, some background on how services and reimbursements are provided more generally are useful. Services eligible for rebates under Medicare are provided by numerous service providers in diverse settings including, for example, specialist obstetricians and general practitioners (GPs) for antenatal and postnatal care. Service providers (such as obstetricians) will charge the patient a fee for service at the time of service provision and patients may separately claim rebates through Medicare for this service. Note, however, that some service providers may claim the rebate on behalf of the patient at the time of service provision and only directly charge the patient the “gap”; that is, the difference between the fee charged and the government rebate available. Regardless of how reimbursements are implemented, the patient should only ultimately pay the difference between the fee charged and the rebate, and this is referred to as the “out-of-pocket” cost. Service providers may also choose to set their fees so that there is no gap (or out-of-pocket cost) for the patient. We emphasise, however, that the cost we are studying specifically excludes out-of-pocket costs and private health insurance costs that individuals face; and it also excludes the cost of services provided through outpatient clinics that are not covered by Medicare as we are focussed on the costs from the perspective of government only.
In addition to the intricacies described above, all individuals also have access to private health insurance. Thus, while some women may exclusively rely on Medicare coverage alone, other women may choose to use both Medicare and private health insurance. During the perinatal period, the benefits of private health insurance are mainly for hospital services, and many out-of-hospital services (such as services provided through obstetricians) are generally not covered under private health insurance arrangements, particularly if they are otherwise covered under Medicare. However, specialist antenatal and postnatal obstetric out-of-hospital services are more likely to be utilised by women who have private health insurance so they can deliver their babies as private patients in hospital (which is covered by private health insurance), and Medicare rebates are generally available for these specialist out-of-hospital services. This is the typical care pathway for private patients and ensures more continuity of care for these women from the antenatal through to the postnatal period. Conversely, those without private health insurance tend to choose a care pathway that does not include specialist services and deliver their babies as public patients (as they will need to self-fund any hospitalisations as private patients) which is the typical care pathway for public patients. In both cases, patients are entitled to claim rebates through Medicare in the same way as this universal government system operates independently of private health insurance status, notwithstanding that the differential care pathways often result in differences in services used and subsequent rebates claimed.
There have been some important developments in the provision of out-of-hospital services in Australia over the study period. The Strengthening Medicare package (Centre for Health Economics Research and Evaluation, 2011) introduced in 2004 included a number of changes that impacted the area of perinatal health care. The immediate implication of these policy changes was an increase in rebates provided to women due to a number of new obstetric items becoming available to claim through the MBS. However, due to increasing cost pressures, the government placed caps on these rebates in January 2010. The Extended Medicare Safety Net was also an important part of this package which provided significant additional benefits to high-volume users of Medicare services. The other major impact of these reforms was a transfer of services from in-hospital to out-of-hospital (Centre for Health Economics Research and Evaluation, 2009) and this is particularly pertinent for some high-cost obstetric items. We will also consider these systemic changes in our analysis.
This paper expands on the hospital costing study of William et al. (Reference William, Chojenta, Martin and Loxton2017), which examines the maternal hospital cost risk factors of public patients in Australia (hereafter referred to as the “hospital study”) and uses administrative data linked with survey data from the Australian Longitudinal Study for Women’s Health (ALSWH). The limited previous research in the area focussed on mean maternal per patient hospital costs of adverse births and found that these costs were considerably higher compared to those under no-adverse births (Chollet et al., Reference Chollet, Newman and Sumner1996; Luke et al., Reference Luke, Bigger, Leurgans and Sietsema1996; Gilbert et al., Reference Gilbert, Nesbitt and Danielsen2003; Ringborg et al., Reference Ringborg, Berg, Norman, Westgren and Jonsson2006). There are, however, two previous studies, Mistry et al. (Reference Mistry, Heazell, Vincent and Roberts2013) and Chollet et al. (Reference Chollet, Newman and Sumner1996), that considered out-of-hospital costs. The former considered maternal costs associated with stillbirths only (without a cost comparison to women who do not experience stillbirths); and the latter did not split the costs by infant and mother for most of the analysis, focussing instead on the combined costs. These papers also do not consider cost risk factors in depth, or within a multivariate regression framework. Therefore, our study will be the first time maternal out-of-hospital costs are examined in the literature and in a fully multivariate context. Our research expands on these previous studies by considering over one hundred covariates from survey and administrative data and other categories of adverse births over the complete perinatal period to provide a comprehensive study of the risk factors of maternal out-of-hospital costs. We adopt the same actuarial methodology as in the hospital study when modelling cost to achieve this aim.
The definition for adverse births is taken from the survey data, so it is based on maternal self-reports for premature births, low birth weight and stillbirths. The questions are framed in terms of whether the woman experienced the outcome and there are no specific definitions given thereof, with the exception of low birth weight for which a birth weight of <2,500 g or 5.5 lb is specified in the survey question. Despite the potential for variation in answers depending on the interpretation of what the other outcome measures mean, Gresham et al. (Reference Gresham, Forder, Chojenta, Byles, Loxton and Hure2015) have found that a high confidence can be placed on self-reported perinatal outcomes from this survey when compared with administrative data. Adverse birth outcomes are considered here not only because of the paucity of research in terms of understanding the maternal costs associated with them but also because the rates of premature births (the most prevalent adverse birth outcome) have been on the rise in most countries and reflect the leading cause of death for newborns, accounting for 35% of all neonatal deaths (Howson et al., Reference Howson, Kinney and Lawn2012). We observe similar trends in Australia, with little or no improvements in the rates of low birth weight, premature births and stillbirths over the last 20 years (Measey et al., Reference Measey, Charles, d’Espaignet, Harrison, Deklerk and Douglass2007; O’Leary et al., Reference O’Leary, Bower, Knuiman and Stanley2007).
2. Data and Methods
2.1. Data
The data used for this study are drawn from the ALSWH and Medicare Data that are linked with the survey data. The ALSWH is a national longitudinal survey of over 57,000 women in four age cohorts (born 1989–1995, 1973–1978, 1946–1951 and 1921–1926) and is a largely representative sample of the population (Brown et al., Reference Brown, Dobson, Bryson and Byles1999; Powers & Loxton, Reference Powers and Loxton2010). Participants have been completing self-report surveys on physical and mental health, socio-demographic and lifestyle measures, and utilisation of health services on a 3-yearly basis since 1996. For this study, we use birth data from Survey 6 of the 1973–1978 cohort as they represent the group of women who have the most recent births; and adverse birth information is most comprehensively covered in Survey 6 (N=5836). We use all other surveys to identify the attributes of each women at the time closest to each birth.
In order to determine the government rebate paid for each service claimed by women in the perinatal period, Medicare Data (from 1997 to 2010) are linked with ALSWH data for those who have consented to this linkage on an opt-out basis. Medicare Data also contain information on the item number of the service, so we can assess what types of services are claimed. As discussed in the hospital study (William et al., Reference William, Chojenta, Martin and Loxton2017), the unit of analysis is a baby, as this choice reflects a good representation of the underlying measure of risk of the maternal cost during the perinatal period. Therefore, the response variable of interest is the “maternal cost per baby” and the data set is aggregated to one record per baby to facilitate capture and subsequent modelling of the response variable. In terms of linkage, Medicare records are linked to ALSWH records based on the unique identifier of the woman. Data are removed for multiple births, for cases for which the ALSWH survey date is more than 4 years from the date of birth of the baby, and for cases with incomplete antenatal and postnatal periods.
We undertake a number of segmentations to the data to ensure we model costs appropriately. First, the data are segmented to the three distinct parts of the perinatal period; the antenatal, delivery and postnatal period, as the cost risk factors of each sub-period are likely to be different. The definitions used for the delivery and postnatal sub-periods are the 10 days leading up to the date of birth (to include labour) and the first year following the date of birth, respectively. We also consider the development of costs over the postnatal period as this part of the perinatal period is significant proportionately to out-of-hospital costs. There is no information on gestational age in the data sets available, so the antenatal period is estimated as commencing on the baby’s date of birth less than 300 days and concluding at the start of the delivery period. This approximation allows for pregnancies that may exceed the typical 40-week gestation period. Second, we consider large costs separately from the smaller, underlying costs as the drivers of large cost events are likely to be different to those for the underlying costs. We decide on how to differentiate large costs within the exploratory analysis. Finally, we also consider “private” and “public” cases separately, whereby a woman is defined as private if she has private health insurance for hospital cover, otherwise she is public. The final resultant data set contains 4,546 babies (from 2,520 women) over the baby’s years of birth 1997–2009.
We have over one hundred factors available from ALSWH to be included as covariates in the multivariate cost models (Medicare Data is only used for the response cost variable). These covariates are broadly grouped into six categories: health service use, obstetric factors, reproductive factors, demographic factors, health behaviours and psychosocial, and physical health factors and key factors of interest from each category are shown in Table 1, noting that this is not an exhaustive list of all factors used in the first phase of modelling.
Table 1 Key factors of interest from Australian Longitudinal Study for Women’s Health.

2.2. Methods
We adopt a two-phase modelling methodology as previously developed in the hospital study (William et al., Reference William, Chojenta, Martin and Loxton2017). The two phases comprise an exploratory analysis followed by a formal parametric modelling phase. The purpose of the exploratory analysis is to deal with the vast number of covariates available for analysis by ensuring a robust initial selection of factors for testing in the formal parametric phase through the use of classification and regression trees (CART) and lessons from a qualitative literature review. Generalised linear models (GLM) are considered in the second phase and provide a formal modelling setting within which the statistical significance of selected covariates can be assessed. The use of these techniques and similarities to insurance and health cost modelling were summarised in William et al. (Reference William, Chojenta, Martin and Loxton2017) and discussed in depth in various articles (Brockman & Wright, Reference Brockman and Wright1992; Haberman & Renshaw, Reference Haberman and Renshaw1996; de Jong & Heller, Reference de Jong and Heller2008; Johar et al., Reference Johar, Jones and Savage2012; Ellis et al., Reference Ellis, Fiebig, Johar, Jones and Savage2013; Frees et al., Reference Frees, Jin and Lin2013). In particular, we draw upon the common practices within insurance applications of modelling costs separately by frequency and severity, separation of large versus underlying costs, consideration of skewness in cost distributions and of inflationary effects in the cost data. We also emphasise the importance of considering numerous potential risk factors to identify the key drivers of the cost and understand the true impact they each have through a multivariate regression modelling framework, an analysis that has not been previously conducted in this area.
As the cost data are expressed in historic monetary terms, inflation is applied to the 31 December 2015 so that the data are expressed in real terms as at this date. The inflation rates are for Medicare medical services fees charged, available in Australian Institute of Health and Welfare Health Expenditure reports (Australian Institute of Health and Welfare, 2007, 2016) and shown in Table 2. A rate of 1.1% is selected for 2016 based on the 2015 rate but this choice is also consistent with a 3-year and 5-year average inflation rate.
Table 2 Inflation index.

3. Results
The following sections describe the results of the exploratory analysis phase (section 3.1) as well as the formal parametric modelling phase (section 3.2).
3.1. Phase 1: exploratory analysis
Table 3 summarises the data by adverse births and related out-of-hospital costs.
Table 3 Average maternal out-of-hospital costs by perinatal sub-period (31 December 2015 $AUD values).

Note:
* Cost differential relates to average cost of adverse birth versus no-adverse birth.
Table 3 indicates that overall average maternal out-of-hospital costs are 20% higher when there is an adverse birth, compared to when there is no-adverse birth (without taking account of other covariates). As expected, 98% of the cost lies in the antenatal and postnatal periods, with only 2% in the delivery period, the period during which most of the hospital cost is incurred. Private cases also represent ~70% of the total cost which is likely due to the higher rebates available on the more expensive specialist services these cases typically use, and Table 3 shows the total average cost of private cases to be considerably higher than that of public cases plausibly based on this different service usage too. The cost differentials across all sub-periods are also higher for private cases compared with public cases with the exception of the postnatal period. The average costs for all cases are summarised by year in Figure 1.

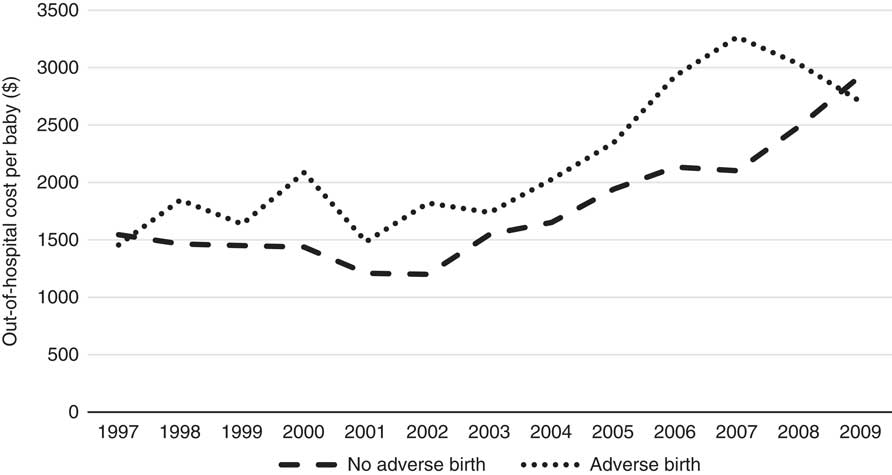
Figure 1 Out-of-hospital cost per baby per year (1997–2009).
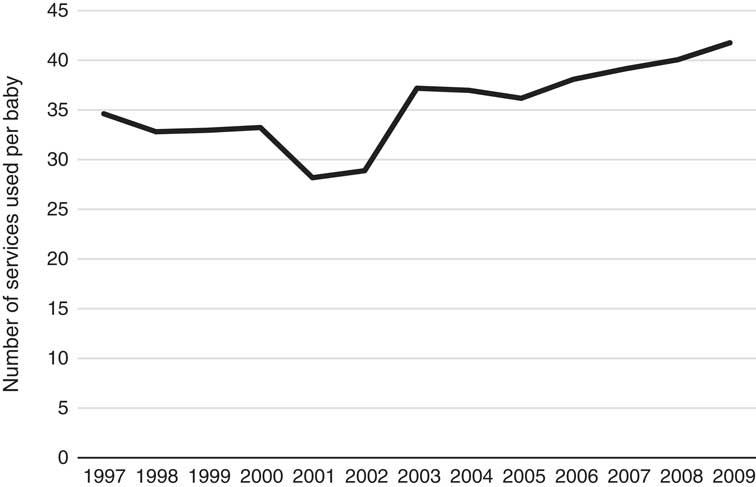
Figure 1 clearly shows an increasing trend in the cost over time for no-adverse births; similarly, the trend in costs for adverse births also appears to be increasing; however, given the relatively low numbers of adverse births, the cost data for this category is more volatile (especially in earlier years). The costs of adverse births are also higher than no-adverse births across all years except 1997 and 2009, for which they are comparable. The most interesting finding in this trend analysis, however, is the steadily rising cost since 2002. Note that these costs and this discussion already takes into account Medicare inflationary increases so there must be other reasons for the notable annual rises since 2002. Further investigation into these increases reveals they are likely due to both increases in service utilisation and the utilisation of higher cost services over time, and these trends are shown in the Appendix A. The number of Medicare services used for each baby over the perinatal period has increased from 35 in 1997 to 42 in 2009 and the average cost of these services has increased from $44 to $70 per service over the same time period. Further, there has been a change in the mix of services used as the proportion of services with rebates greater than $50 has also steadily increased over this timeframe, from 18% of all services in 1997 to 27% in 2009. These results are all likely influenced by the inclusion of more maternity services within Medicare provision, particularly due to the reforms in 2004. It is worth noting that the net cost to the government may not be affected by the broadening of Medicare coverage as these services may have been covered elsewhere (e.g. through hospital services) prior to these reforms. The change in mix of services may also reflect changes in women’s choice to actively substitute lower cost services for higher cost services over time – an obvious example of this phenomenon during the antenatal period is the choice of switching from a GP to a specialist obstetrician. Another major contributing factor to these trends is the significant increase in the number of babies that have mothers with private health insurance, rising sharply from 10% in 1997 to over 70% in 2009. Given this increasing proportion of women with private health insurance, it is likely that the mix and cost of the services used would increase over time too because of the more expensive specialist services that these women are likely to use. Once again, this particular finding may not imply greater net costs to the government, as the group of women with private health insurance is also more likely to use private services covered through private health insurance for delivery of their babies in hospital. We emphasise that any simplistic time-trend analysis with ALSWH survey data may not be indicative of overall population trends as ALSWH survey data represent a cohort of women that age over time, so a more detailed time-trend analysis must also take into account this ageing effect too. Specifically, the trends observed for increasing private health insurance is most likely to be associated with this ageing effect, as the take-up of private health insurance nationally by age (Australian Prudential Regulatory Authority, 2016) is consistent with what is observed over the age ranges of the women in this study, although the trends here are much more pronounced. This timeframe also coincides with the introduction of a number of tax reforms to encourage higher income individuals and young people to take up private health insurance (Australian Prudential Regulatory Authority, 2016). Given the limitations with time-trend analysis with this data and the major changes through time in the regulatory environment, these factors (i.e. age and year) will be considered in more detail in the formal parametric phase of the modelling as it is not possible to properly understand the complex interrelationships that exist between them using simple multi-way tables or graphs. Moreover, the study is separated into private and public cases in order to gain a better understanding of the potentially distinct cost risk factors for each group.
Given these comments, we identify large cost services as the key obstetric items introduced through the Medicare reforms and by also analysing the data for any other services that are subject to high government rebates. Table 4 shows which services are separated for analysis – these services accounting for 30% of the total costs. Appendix A also shows average costs when large items are removed. The trends observed here are significantly less noticeable when assessing underlying costs only (i.e. with large costs removed).
Table 4 Large cost services.

Note 1:
* These are predominantly in-hospital services and have few out-of-hospital records.
Note 2: IVF, in-vitro fertilisation.
3.2. CART
Regression tree models are fit relating costs during each sub-period to all covariates available for modelling. The regression trees are used as a tool for initially selecting factors for inclusion within the formal parametric modelling, so there is considerable flexibility allowed in growing the trees – that is, the trees should not be considered as parsimonious models, but rather as generating a relevant set of candidate variables for the later, formal analysis. Therefore, summarised versions of the trees are presented graphically here for each sub-period and for public and private cases, respectively. We use the data excluding the large services as their presence distort the tree model fit (i.e. they are unusually influential within the fitting process) and thus those cases are analysed separately, as discussed above. The single number shown in each node of the tree represents the predicted cost for that group with the number of data points at each node indicated in brackets.
3.2.1. Public cases
We first examine public out-of-hospital costs to identify relevant cost risk factors.
3.2.1.1. Antenatal period
The primary split of the antenatal regression tree (Figure 2) is infertility, with higher cost prediction being for women who self-report seeking treatment for infertility. Specialist use is the next major splitting variable for women who experience infertility, with those that use specialists predicted to result in higher costs than those that do not. Area is the next split for those who use specialists, with very remote areas associated with lower costs. It should, however, be noted that the number of women within the node reflecting very remote areas is quite small.
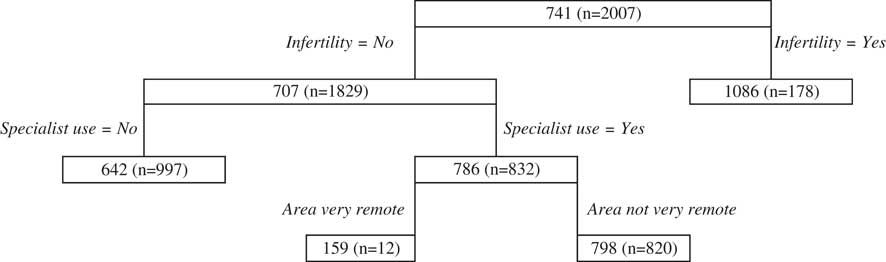
Figure 2 Antenatal public classification and regression trees results.
3.2.1.2. Delivery period
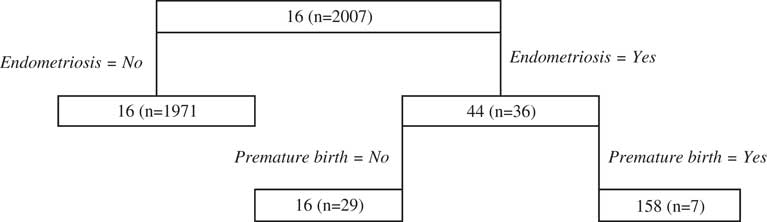
There is little data contributing to most splitting decisions within the delivery period regression tree model (Figure 3), making the resultant tree difficult to interpret because of the variability in fit that is often encountered in regression tree modelling when data are sparse. Notwithstanding this problem, the first split of the delivery regression tree relates to endometriosis, a condition that affects fertility of women and the following split for women who have endometriosis is for premature births. Each of these outcomes results in higher cost predictions.

Figure 3 Delivery public classification and regression trees results.
3.2.1.3. Postnatal period
Postnatal depression is identified as the first split of the postnatal regression tree (Figure 4) with women who experience postnatal depression associated with higher costs. For those women not reporting postnatal depression, GP use is the next split with more frequent consultations associated with higher predicted costs, consistent with expectations. Finally, endometrioses is the last notable split from those who do not visit GPs as often.

Figure 4 Postnatal public classification and regression trees results.
3.2.2. Private cases
We next consider private out-of-hospital costs.
3.2.2.1. Antenatal period
As seen in the public antenatal tree, a condition relating to infertility is the primary split of the private antenatal tree (Figure 5), although it is specific to whether the woman received in-vitro fertilisation (IVF) or not. For women who do receive IVF, specialist use is the next split and for women who do not receive IVF the year of birth of the baby is the next split suggesting that years following 2008 are subject to higher costs. While this temporal effect may not be explanatory of itself, it may reflect underlying changes to health funding policies (recalling that inflation has already been accounted for within the analysis).
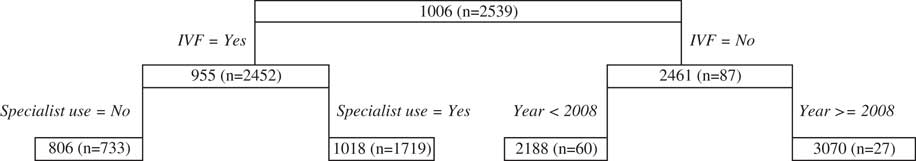
Figure 5 Antenatal private classification and regression trees results. IVF, in-vitro fertilisation.
3.2.2.2. Delivery period
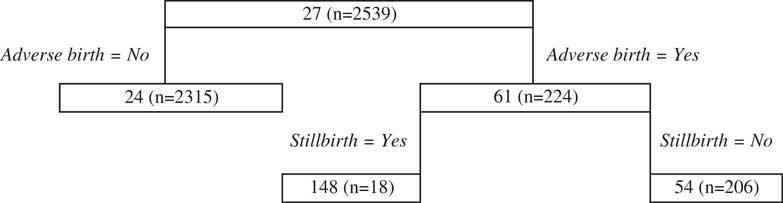
As seen for the public case, there is little data contributing to most splits of the delivery regression tree model (Figure 6). Notwithstanding this issue, which may result in a variable tree fit, the first split relates to adverse births and shows for women who experience an adverse birth, their predicted cost is higher. The following split relates to a type of adverse birth, namely stillbirths that substantially increase costs but there is little data in this node so the result should be interpreted with caution.

Figure 6 Delivery private classification and regression trees results.
3.2.2.3. Postnatal period
We observe splits relating to both GP and specialist consultations in the private postnatal regression tree (Figure 7). In addition we find for those women that are predominantly using GP’s, anxiety substantially increases costs and for those who do not suffer from anxiety, cancer has an impact on cost, however, there is very little data in this node limiting the certitude of this finding.
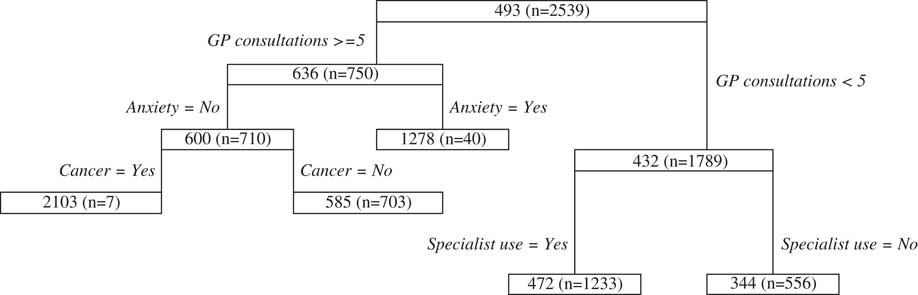
Figure 7 Postnatal private classification and regression trees results.
3.2.2.4. Qualitative literature review
The results of the literature review in the hospital study (William et al., Reference William, Chojenta, Martin and Loxton2017) are also considered here. In particular, the factors found from that review include: demographics such as maternal age, socio-economic status, education and area; reproductive history including previous adverse births and caesarean deliveries; health behaviours including smoking, alcohol use, exercise, obesity and body mass index; psychological and physical health including mental health, diabetes, asthma and hypertension.
All factors selected in the CART models for each sub-period and these other relevant factors identified from the extant literature are included as an initial candidate set of covariates for testing within the formal parametric modelling phase. A complete list of factors selected for testing is provided in Appendix B.
3.3. Phase 2: formal parametric modelling
The CART models provide valuable guidance as to an initial set of covariates to include as part of a model selection process for parametric models for cost. Using the factors selected in the CART models along with other factors identified in the literature, GLM for total costs, frequency and severity are fit, assuming a Tweedie distribution with log link, Negative Binomial error distribution with log link and γ error distribution with log link, respectively. We report factors at significance level <0.1% for parsimony for both public and private cases and for each of underlying and large costs. We also include for consideration all possible two-way interactions within the modelling process and report and interpret them when they are significant. Full details of the models and factors included for testing are provided in Appendix B and C.
3.3.1. Underlying costs
3.3.1.1. Antenatal period
Table 5 compares the significance of factors across all models for both public and private cases and for each of frequency of cost, severity of cost and total cost. Most factors that are statistically significant in the total cost models are due to frequency impacts; that is, it is higher service utilisation that drives the cost rather than increased costs per service. There is a clear trend of IVF, area and mental health factors (intense anxiety for public and stress about own health and anxiety for private) being significant across both public and private models. IVF is also a key driver of these costs but for this factor, significance is due to higher average costs of the service rather than to increased service use. Physical conditions such as hypertension and diabetes (type 1 only) affect private cases, while endometriosis is identified in the public model. We also find GP use is significant for both cases, but specialist use is only significant for the private case, which is unsurprising given that those who opt for private health insurance are more likely to use specialist services. Elective caesareans are significant for the private case; however, this is due to increased services used in the pregnancy – that is, before the birth event, which suggests that women who elect for caesareans are using more services than other women, even during pregnancy. This may be because they are in poorer health or are experiencing complications in their pregnancy – hence why they elect for a caesarean delivery.
Table 5 Significant factors in antenatal period.

Note 1:
* The bracketed description identifies which level of the factor relates to higher costs.
Note 2: IVF, in-vitro fertilisation; BMI, body mass index.
3.3.1.2. Delivery period
As the delivery period mainly (though not exclusively) involves hospital services, there is little data contributing to out-of-hospital services, and therefore are fewer factors of significance because of excessive variability within the model fit, particularly for public cases. Table 6 shows there is a marked difference between public and private cases, costs for public cases are impacted by women with medical conditions such as endometriosis and hypertension but only in terms of increased service utilisation, while costs for private cases are impacted by adverse births and elective caesarean delivery. Emergency caesarean delivery is also tested but did not prove significant in the model fit, potentially because of the very small numbers of patients involved.
Table 6 Significant factors in delivery period.

3.3.1.3. Postnatal period
Table 7 shows the results for the postnatal period. As for the other sub-periods, there are important differences, but also some notable similarities, between public and private cases. For the public case, mental health factors dominate the models with postnatal depression, anxiety and stress about own health all contributing to the costs in a statistically significant way. Adverse births, cancer, GP use and hospitalisations for reasons other than pregnancy are also noted as significant in this model. Moreover, the total cost model is also driven largely by the frequency effects and the severity model only finds postnatal depression and anxiety to be of significance. For the private case, the factors identified for the public case remain significant but there are a few additional significant cost risk factors. Caesarean delivery (emergency and elective) and specialist use are also significant for private cases, a result which is not surprising given the likelihood of private cases utilising such services and the higher costs associated with such use. In contrast to public cases, many of the drivers of the total cost model arise from the severity model rather than the frequency model, meaning that higher costs per service are more relevant than increased service utilisation.
Table 7 Significant factors in postnatal period.

3.3.1.4. Development of postnatal period
In order to understand how postnatal costs develop over time within the 1-year postnatal period, models are also fit to evaluate the effects of the covariates on postnatal costs for each bi-monthly interval following delivery. Tables 8 and 9 show the sub-period for which each risk factor becomes significant following the birth of the baby for public and private cases, respectively, for total cost models. For public cases, we find once a factor becomes significant in the postnatal period, it stays significant until the end of the year, so no new factors become significant during the year. Conversely, the results for private cases show that some factors are only significant in the middle of the first postnatal year and adverse births are only significant for the first 4 months. These results will be discussed in detail in the Discussion section.
Table 8 Public bi-monthly postnatal models.

Table 9 Private bi-monthly postnatal models.

3.3.2. Large costs
The notable large cost risk factors for public models are related to infertility and specialist use in the antenatal and postnatal periods. This is not a particularly surprising result as it is likely that public cases do not utilise services that have been grouped as large cost items as much as private cases. The results for private cases are shown in Table 10 and vary considerably by perinatal sub-period. The antenatal period is where most of the large costs are incurred and the risk factors identified here include specialist use, IVF, area, year, elective caesarean and socio-economic index for advantage (where more advantage is associated with higher costs). These factors are mainly reflected in the severity model with only area and specialist use significant for frequency of services. There is very little data available for the following sub-periods, with few factors of significance.
Table 10 Significant factors for large private models.

Note: IVF, in-vitro fertilisation; SEIFA, socio-economic indices for areas.
3.3.3. Summary of underlying costs
Table 11 summarises the results for the total models for the public and private cases across each sub-period for ease of comparisons across the scenarios studied.
Table 11 Summary of significant factors for underlying models.

Note 1:
* No significant factors in this model.
Note 2: IVF, in-vitro fertilisation; BMI, body mass index.
4. Discussion
We find that whether a woman has private health insurance or not has a significant impact on cost risk factors of out-of-hospital costs. This effect is largely due to differences in care pathways these two groups of women take during the perinatal period, and this is reflected in which cost risk factors are identified. The differences are also evident across the antenatal, delivery and postnatal periods for both underlying and large costs. In addition to this, the major findings from this study are the importance of IVF and treatment of infertility in the antenatal period; adverse births and caesarean delivery in the delivery and postnatal period; and mental health factors in the antenatal and postnatal period. The mental health factors, in particular, are dominant explanatory variables within many of our private and public models across these two sub-periods, and include separate factors for anxiety, intense anxiety, postnatal depression and stress about own health. We discuss each perinatal sub-period in turn and highlight areas where further research is necessary to formulate health policy based on this evidence.
In the antenatal period, IVF and infertility are the factors that have the greatest impact on cost for both public and private cases, a finding which is not surprising given how expensive procedures related to these services are. Women using these services are also more likely to be monitored more closely throughout their pregnancies, a feature that will also contribute to the cost impact. These factors also impact significantly on large costs for both public and private cases. Specialist use and GP use are also common significant factors within the private and public models, respectively, a phenomenon which seems logical as private patients are more likely to use the services of specialists while public patients are more likely to use the services of GPs for antenatal care. Other physical health conditions that are likely to impact on pregnancy also feature prominently, including hypertension and type 1 diabetes for private cases and endometriosis for public cases. Interestingly, elective caesareans are also identified for private cases in this sub-period, suggesting that those who elect for caesareans will have more costly pregnancies as well. Area of residence is also significant and the continuous factor fit shows that more remote areas are associated with lower costs compared with less remote areas. This is consistent with the findings within the hospital study, where we note that this may be due to increased access to services in metropolitan areas in particular, and the availability of a wider range of services in metro areas for women to choose from (Powers et al., Reference Powers, Loxton, O’Mara, Chojenta and Ebert2013). Finally, mental health factors (stress about own health, anxiety and intense anxiety) are identified for both private and public cases, providing evidence that mental health issues may be manifest even before the birth of a baby and they have significant impacts on the costs associated with pregnancy. These findings are largely driven by high service utilisation rather than high average costs of service; with the exception of IVF which is strongly significant for both frequency and average costs of services used.
The delivery period is quite distinct from the other sub-periods, with adverse births and elective caesareans significant for private cases; ancillary private health insurance is also significant in the severity model. The significance of ancillary private health cover is interesting and suggests that those who opt for greater insurance cover (unrelated to hospital cover) are likely to incur higher costs in the delivery period, possibly because they are in poorer health to begin with, thus opting for more private health coverage. As seen for the antenatal period, most of these findings are driven by high service utilisation rather than high average costs. There is little to note within public cases, with only two physical health conditions related to pregnancy (endometriosis and hypertension) significant in the frequency model.
Postnatally we find mental health factors dominate the set of significant features of many of our models, while some of the cost risk factors identified for private cases in the delivery period (caesarean delivery and adverse births) remain significant following the delivery of the baby. Interestingly, adverse births are only significant in the delivery period for private cases and postnatal periods for both private and public cases (which relate to periods in close proximity to the adverse birth event). These results suggest that adverse births do have significant cost impact which becomes apparent around the time the birth event has occurred, but this impact also extends into the postnatal period. In contrast, the hospital study showed that adverse births were only significant in the delivery period, and not beyond, for public patients. The lack of significance in the delivery period for public cases in this study is most likely due to many of these women being treated in hospital rather than out-of-hospital. Also, IVF is not significant in the delivery or postnatal period, suggesting that women who have these procedures become like other women in terms of cost once their baby is born – that is, there are no persistent effects of IVF use related to ongoing costs. GP, specialist use and area are also identified and similar comments to those made for the antenatal period apply here for these factors. A surprising risk factor in this sub-period is cancer and it was also identified in the postnatal period of the hospital study, which suggests that this particular health condition overrides the effect of other health conditions that relate specifically to maternal health following the birth of the baby. In contrast to the other two sub-periods, we find that while service utilisation drives most of the results for public cases, it is the average cost of services that contribute more significantly to the private cases. In other words, private cases tend to have higher costs mainly because they use more expensive services rather than simply using more services.
The study of the development of cost risk factors over the postnatal period reveal that more factors significantly impact on cost as time progresses, and once a factor becomes significant it stays significant until the end of the first year for public cases. However, this phenomenon is not observed for private cases. Adverse births and stress about own health are key factors that impact on cost from the early postnatal stages for both private and public cases. This finding highlights how important these risk factors are on cost at every stage in the first postnatal year. Interestingly, adverse births are not significant in the middle to final stages of the first year following delivery for private cases, which suggests that issues related to this are either resolved by the end of the first year for this group, or other health issues (such as cancer) become more prominent and outweigh the effect of adverse births and caesarean delivery. In contrast, for public cases, adverse births remain significant throughout all periods for the first postnatal year.
In terms of other differences between public and private cases; we find the former use GPs from 2 to 4 months onwards, but the latter continue to use specialists to manage their postnatal care from very early postnatal stages. This is perhaps an expected outcome given the increased service options that access to private health insurance offers. In addition to this outcome, for private cases only, elective caesarean delivery, anxiety and area are all important from the initial postnatal stage. Interestingly, emergency caesarean also becomes significant around the 4- to 6-month mark, but both types of caesarean deliveries are no longer significant in later postnatal stages, again suggesting these birth-related issues are resolved by the end of the first year. For mid- to later-stage conditions, for both public and private cases, postnatal depression develops into a significant cost risk factor 4 to 6 months following delivery. GP use also becomes significant in this timeframe for private cases, suggesting that some of these women may be switching from specialist to GP services around this time. For public cases, cancer and anxiety emerge as significant factors at much later stages, although the significance of anxiety at this time may relate to women seeking costly treatment later in the postnatal period when the condition has become severe and medical intervention has become necessary. This contrasts with the private case, where women are seeking treatment for anxiety typically much earlier in the postnatal period – possibly because they have more access to services. Closer inspection of the types of services used by women with mental health conditions show that they tend to use primary services (such as GP consultations) more than women who do not exhibit these conditions. These results provide overwhelming evidence about the impact on cost of mental health factors during the postnatal period and, more importantly, how these mental health factors develop over time in a way that significantly affects cost.
The large costs have very different drivers to the underlying costs. Public cases are not substantially impacted by large costs but do show similar characteristics to private cases with regard to the impact of IVF. For private cases, the cost burden is predominantly restricted to the antenatal period, with cost risk factors such as socio-economic factors, specialist use, IVF, area, elective caesarean and year identified as relevant, with most of these factors significant through increased average cost of services rather than higher service utilisation. These results suggest that large costs are likely to be driven by a woman’s ability to pay (socio-economic index) and the access (area) or choice of certain types of services (specialists) and procedures (caesareans and IVF). While many of these services and procedures are identified as relevant within the underlying cost models as well, they share influence on cost with many other factors (such as mental health factors and adverse births). In the large cost models, however, fewer significant factors emerge.
There are few comparisons that can be made with previous research due to the paucity of research in this area and some fundamental differences between this study and previous studies. Notwithstanding this comment, these results agree with Chollet et al. (Reference Chollet, Newman and Sumner1996) that the maternal out-of-hospital costs for women with adverse birth outcomes are higher than for those without adverse birth outcomes. We are also able to show that adverse births are a statistically significant cost risk factor (even in the presence of other cost risk factors) in the delivery (for private cases only) and postnatal period (for both public and private cases). We also consider a comprehensive and diverse selection of cost risk factors through ALSWH surveys and are therefore able to link factors such as mental health and other health behaviours to increased costs, a feature that many other studies are unable to summon.
These findings are important because they provide a comprehensive picture of what the most important drivers of the maternal out-of-hospital costs are. For this reason, these results provide a strong evidence base which may inform public policy in maternal health, particularly as it relates to what is already a high-cost area of health service provision – pregnancy. There are many key areas identified and discussed here and each warrants further investigation. In particular, the care pathways chosen by women, which often depend on whether they have private health insurance or not, have a significant impact across all sub-periods. Specialist use is unsurprisingly more prominent in private cases and, correspondingly, GP use is more prominent in public cases. However, private models generally also include GP use as well, perhaps reflecting how entrenched and central GP care is within Australia’s complex health system. Another layer of complexity in the Australian health care system relates to the choice that women have to purchase private health insurance and elect services under each of the public and private system, with the natural consequence that the availability of such choices may lead to anti-selection in private health insurance as it may be more attractive to higher risk women. Understanding how these systems and types of services interact with each other and also their impact on maternal outcomes should be considered further as they are fundamental services in the context of the Australian maternal health care system and are also clearly important drivers of the costs incurred.
We also identify mental health policy as a priority for further investigation given the overwhelming evidence for the association between higher costs and mental health factors (anxiety, intense anxiety, stress about own health and postnatal depression) in this study. Moreover we see this relationship manifest from the antenatal period before the baby is born and continue until at least the end of the first year following birth for both public and private cases. The impact of poor psychological health on maternal and birth outcomes is well documented (Hedegaard, Reference Hedegaard2002; Alder et al., Reference Alder, Fink, Bitzer, Hosli and Holzgreve2007; Wisborg et al., Reference Wisborg, Barklin, Hedegaard and Henriksen2008) so the flow-on effect to increased use of health services for women affected during the perinatal period is a reasonable expectation. The prevalence of depressive conditions during the perinatal period have also been studied and reported at between 10% and 20% in Australia, and this has remained fairly stable over 25 years (Schmied et al., Reference Schmied, Johnson, Naidoo, Austin, Matthey, Kemp, Mills, Meade and Yeo2013); for ALSWH women, postnatal depression has been reported by 15.7% of mothers (aged up to 36 years) (Chojenta, Reference Chojenta2013; Chojenta et al., Reference Chojenta, Lucke, Forder and Loxton2016). Unfortunately, anxiety disorders during pregnancy are often overlooked and are therefore less understood. Consequently, there is less overt evidence about anxiety in the perinatal period (Schmied et al., Reference Schmied, Johnson, Naidoo, Austin, Matthey, Kemp, Mills, Meade and Yeo2013). In terms of risk factors of perinatal mental health, studies show that previous mental health disorders are the most important predictor of future mental health disorders (Boyce & Hickey, Reference Boyce and Hickey2005; Chojenta et al., Reference Chojenta, Loxton and Lucke2012; Chojenta, Reference Chojenta2013; Schmied et al., Reference Schmied, Johnson, Naidoo, Austin, Matthey, Kemp, Mills, Meade and Yeo2013) and therefore early intervention is important for women at risk (Chojenta, Reference Chojenta2013; Chojenta et al., Reference Chojenta, Lucke, Forder and Loxton2016). The results of our study also provide evidence that early intervention may reduce costs, with evidence that many women are seeking expensive services later in the postnatal period, perhaps as the severity of the mental health conditions worsen or become critical and require specific intervention. A more proactive approach to their care may direct resources earlier in the perinatal period, or even earlier in their life course and ultimately produce better outcomes and lower costs over their lifetime. Given these findings, we propose initiatives such as a national universal mental health screening protocol for antenatal and postnatal periods in conjunction with improved screening methods and health services that focus on holistic, proactive early intervention so that mental health problems are detected and treated early. The introduction of targeted low cost innovations such as the emerging field of e-therapies may also reduce the economic burden on the health care system. The strengths of these initiatives have been discussed in other studies (Chojenta, Reference Chojenta2013; Chojenta et al., Reference Chojenta, Lucke, Forder and Loxton2016), and our study provides further evidence that they are indeed necessary for improved maternal health outcomes and likely to be cost effective as well. Such policies are likely to reduce the severity and recurrence of mental health impacts in the future, thereby reducing the health system cost implications. We recommend full cost benefit analysis of these policies before they are developed further.
There are a number of potential limitations with the data used for this analysis. First, we note the potential lack of reliability of self-reported responses to questions such as the adverse births and postnatal depression items. However, validation of the self-report measure of adverse births has been conducted and found to be reliable (Gresham et al., Reference Gresham, Forder, Chojenta, Byles, Loxton and Hure2015). For other items such as postnatal depression, such validation is harder to conduct, but they have been broadly compared to previous research where possible, and they fall within expected ranges, lending strength to the validity of self-report items used (Chojenta, Reference Chojenta2013; ALSWH, 2014). Despite these possible limitations, a key strength of using the survey data is that it allows us to capture and model the effects of a large number of key covariates (such as those related to mental health) in detail and such data are not collected in any national administrative data sets at this time. This study also excludes out-of-hospital services that are not billed through Medicare (which may, e.g. be delivered through an outpatient clinic at a hospital) as we are focussed on policy for Medicare-funded services. We note, however, that we cannot make any direct comparisons of our results to the group that do not use Medicare-funded services as there is currently no data collected on these services – we do posit that they will have different characteristics to the women considered in this study because they are not using out-of-hospital Medicare services, but there is currently no way to quantify these effects. These limitations highlight the need for improved maternal health services data for future examination of health care expenditure in the perinatal period to be possible.
5. Conclusion
In this paper, we identify key cost risk factors of out-of-hospital services to provide a more complete picture of the drivers of the maternal health system. We use a two-phase modelling methodology based on actuarial and statistical techniques to account for the large number of factors available for selection. We find that the majority of the costs are incurred in the antenatal and postnatal period and key cost risk factors across these periods are IVF, GP and specialist use, adverse births and numerous mental health factors. The impact of private health insurance is also identified as an important driver of cost and patients in this category are more likely to use more expensive specialist services. Thus, large costs are mainly relevant for private cases and we find that affordability, access and the types of services or procedures (such as caesarean delivery or IVF) are key drivers of large costs. The inherent differences between the public and private systems of health care funding and pathways of pregnancy care have inevitably led to differences in the provision of maternal health care, and consequently affecting cost risk factors, for both underlying and large costs. We consider the interactions between these systems a key area for further research.
A clear theme that emerges in this study is the prominence of numerous mental health factors from the antenatal period to the end of the postnatal period, and consequently we acknowledge mental health policy as a priority area for further research. We propose a number of initiatives that are based on proactive, early intervention for women at risk in conjunction with improved screening and more holistic support throughout the life course and the perinatal period. These initiatives are aimed at directing resources earlier in the life course so that the outcomes of affected women are improved, perhaps then avoiding the much larger costs associated with later, critical interventions. Further research using the evidence presented here and a full cost benefit analysis of these policy initiatives is strongly recommended.
Acknowledgements
The research on which this paper is based was conducted as part of the ALSWH by the University of Queensland and the University of Newcastle. The authors are grateful to the Australian Government Department of Health for funding and to the women who provided the survey data. The authors acknowledge the Department of Health and Medicare Australia for providing the MBS data. The authors also acknowledge the Australian Institute of Health and Welfare (AIHW) as the integrating authority for these data.
APPENDIX A: Exploratory analysis

Figure A.1 Number of services claimed per baby (1997–2009).

Figure A.2 Average cost of service (1997–2009).

Figure A.3 Change in mix of services (1997–2009).
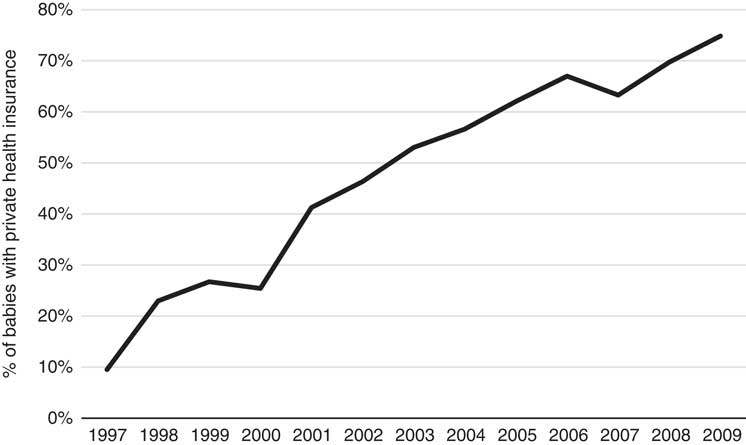
Figure A.4 Proportion of babies with mothers that have private health insurance (1997–2009).

Figure A.5 Average costs with large cost items removed (1997–2009).
Table A.1 Average underlying and large maternal out-of-hospital costs by perinatal sub-period (31 December 2015 $AUD values).

APPENDIX B
Table A.2 Factors tested in formal parametric models.

APPENDIX C: GLM output
Underlying Model Estimates
Public antenatal
Table A.3 Public antenatal frequency.

Table A.4 Public antenatal severity.

Table A.5 Public antenatal total.

Private antenatal
Table A.6 Private antenatal frequency.

Table A.7 Private antenatal severity.

Table A.8 Private antenatal total.

Public delivery
Table A.9 Public delivery frequency.

Private delivery
Table A.10 Private delivery frequency.

Table A.11 Private delivery severity.

Table A.12 Private delivery total.

Public postnatal
Table A.13 Public postnatal frequency.

Table A.14 Public postnatal severity.

Table A.15 Public postnatal total (12 months).

Table A.16 Public postnatal total (10 months).

Table A.17 Public postnatal total (8 months).

Table A.18 Public postnatal total (6 months).

Table A.19 Public postnatal total (4 months).

Table A.20 Public postnatal total (2 months).

Private postnatal
Table A.21 Private postnatal frequency.

Table A.22 Private postnatal severity.

Table A.23 Private postnatal total (12 months).

Table A.24 Private postnatal total (10 months).

Table A.25 Private postnatal total (8 months).

Table A.26 Private postnatal total (6 months).

Table A.27 Private postnatal total (4 months).

Table A.28 Private postnatal total (2 months).

Large Model Estimates
Public antenatal
Table A.29 Public antenatal frequency.

Table A.30 Public antenatal severity.

Table A.31 Public antenatal total.

Public postnatal
Table A.32 Public postnatal severity.

Table A.33 Public postnatal total.

Private antenatal
Table A.34 Private antenatal frequency.

Table A.35 Private antenatal severity.

Table A.36 Private antenatal total.

Private delivery
Table A.37 Private delivery frequency.

Table A.38 Private delivery severity.

Table A.39 Private delivery total.

Private postnatal
Table A.40 Private postnatal frequency.

Table A.41 Private postnatal severity.

Table A.42 Private postnatal total.