


In the past few decades, few comparative political economy debates have been as exciting as those concerning whether decentralization leads to greater public service delivery. The literature has offered a wealth of intriguing hypotheses connecting greater public participation, oversight, and accountability (often through elected councils) to a variety of local outcomes.Footnote 1 Although these studies have been highly influential for policy decisions and international aid activities (see World Bank 1994), more recent formal and experimental work has begun to question their underlying theory and empirical analyses (Treisman Reference Treisman2007). At the same time, many countries have grown dissatisfied with the results of their decentralization efforts and have begun to reverse them (Dickovick Reference Dickovick2011). Unfortunately, the literature is ill suited to offer empirical predictions on recentralization efforts for two reasons: (1) recentralization is a new phenomenon and therefore is under-theorized; and (2) the extant literature on decentralization is fiercely contested, offering few findings that withstand theoretical and empirical scrutiny.
In this article, we attempt to address these oversights by taking advantage of a unique quasi experiment in Vietnam that sheds light on the effects of allocating authority to subnational governments. When Vietnamese leaders first began to consider the removal of District People's Councils (DPCs), the topic was hotly debated both within the Communist Party of Vietnam (CPV) and the Vietnamese National Assembly (VNA).Footnote 2 Advocates claimed that DPCs complicated decision-making by adding an extra node to policy design and implementation, which led to sustained hold-ups and extra costs in service delivery, infrastructure rollouts, and land conversion, all of which were necessary for economic development (TPCS 2009). Opponents contested the proposal on democratic grounds, arguing that the councils represented an important forum enabling citizens to check the power of leaders and rein in local corruption (CPV 2010). The dispute was contentious enough that Vietnamese officials followed a grand history of pilot programs in Marxist-Leninist regimesFootnote 3 and confined the recentralization intervention to ten provinces (containing 99 districts); this decision allowed them to observe the effects of DPC removal in a contained setting before considering a full-scale rollout to Vietnam's other 53 provinces and national-level cities (National Assembly 2008).
What makes Vietnam particularly intriguing for researchers is the careful way in which it designed its recentralization experiment. To ensure that the conclusions were not rooted in the particular selection of provinces, officials stratified their selection by region, by urban versus rural, and by whether the province shared an international border (GSRV 2009). In addition, they made sure to include provinces that varied in their initial endowments, previous economic performance, and initial quality of public administration. Although not a randomized control trial (RCT), the research design ensured balance on a range of pretreatment covariates between selected and nonselected locations. In other words, it is reasonable to consider the nonselected provinces a plausible control group for isolating the causal effects of recentralization.
We take advantage of this quasi experiment to test the core hypotheses of decentralization in the literature. Our research design offers an overtime (diff-in-diff) analysis of real institutional change (not an artificial intervention) with a clearly identified counterfactual, performed at scale within one country; this design allows us to hold constant the unobserved historical and cultural confounders that have limited previous work. As far as we know, this is the first-ever empirical analysis with clear control and treatment groups on the abolishment of an elected council affecting more than ten million people. The existing work on institutional change was conducted on a much smaller scale and involved NGO or multilateral donor projects rather than national governments’ own initiatives and ownership.
Studying a large number of services helps us avoid the temptation to cherry-pick particular outcomes that confirm our hypotheses (Kramon and Posner Reference Kramon and Posner2012). We find that recentralization significantly improved a spectrum of public services that were considered important to central policy-makers, ranging from quality of roads to healthcare to the presence of post offices. By contrast, the intervention had no discernible effect on services deemed important by Vietnamese citizens (education, agricultural extension, and household business development).
In a more speculative final section of the article, we study the causal mechanism through which the DPC pilot generated positive performances for services favored by central leaders. There are three candidate mechanisms that might explain these results, including the removal of vertical accountability to citizens and improved efficiency resulting from bureaucratic restructuring. We demonstrate that the most compelling explanation, however, is that the pilot unblocked elite capture of the policy-making process. As researchers have argued in other contexts, the purported benefits of decentralization for grassroots monitoring (Cheema and Rondinelli Reference Cheema and Rondinelli1983; Huther and Shah Reference Huther and Shah1998) can be undermined by local elites (politicians, businessmen, notables), who take advantage of their concentrated political resources to manipulate public decisions in their favor (Bardhan and Mookherjee Reference Bardhan and Mookherjee2006; Campos and Hellman Reference Campos, Hellman, White and Smoke2005; Reinikka and Svensson Reference Reinikka and Svensson2004). We probe the observable implications of the elite capture mechanism through a nationally representative public opinion poll of 9,452 respondents (UNDP 2011), showing how recentralization reduced elite corruption in treatment districts.
THE LITERATURE ON DECENTRALIZATION
The past two decades have brought forth a rich debate in political science on the relative merits of locally elected governments. Camps of scholars and practitioners disagree on the theoretical benefits of granting authority to subnational units and the lessons learned from extant empirical work. At the same time, the rapid spread of decentralization worldwide, which at its peak led to elections of local governments in 90% of countries around the world (Rodden Reference Rodden2006), has subsided. A recent World Bank review of almost 500 studies reveals that the excitement about the benefits of locally elected bodies was not met by real-world improvements in outcomes (Mansuri and Rao Reference Mansuri and Rao2013). As a result, Argentina, Brazil, Chile, Columbia, Uruguay, South Africa, and a number of other countries have started reversing some of these original decisions (Dickovick Reference Dickovick2011; Eaton Reference Eaton2004). Vietnam is such a case.
Types of Decentralization
It is important to be clear from the start about where the Vietnamese DPC pilot fits into larger debates in the literature. The pilot involved a specific Vietnamese governmental unit (the second-tier district) and a specific body (the directly elected legislature). Scholars generally distinguish between modes of decentralization according to three considerations:
-
(1) The arenas in which power has been granted to local authorities: fiscal, administrative, or political (Faletti Reference Falleti2010; Green Reference Green, White and Smoke2005). A series of legal documents developed prior to the pilot provided DPCs with important fiscal authority (over budget allocation, approval, and implementation). DPCs also have the authority to elect and remove any member of the local executive (the District People's Committees (DPCOMs)), procuracies, and courts. In addition, they have oversight powers over all People's Councils and People's Committees of communes within their jurisdiction.Footnote 4 Thus, there are elements of fiscal and administrative decentralization (Fforde Reference Fforde2003). The DPCOM was not removed in the pilot, however, so this is only partly administrative recentralization. National legislation on local governmental organization also claimed to influence political decentralization through the DPCs’ universal election by district citizens, but this claim is contestable. In fact, a key feature of the debate in Vietnam has concerned the extent to which the DPC elections are actually democratic and the extent to which they provide downward accountability to citizens (Nguyen Anh Reference Nguyen2010).
-
(2) The extent of the power provided: deconcentration, delegation, or devolution (Cheema and Rondinelli Reference Cheema and Rondinelli1983; White and Smoke Reference White, Smoke, White and Smoke2005). Disentangling these three distinctions is tricky; most governments experience different types of decentralization at the same time (Grindle Reference Grindle2007). Nevertheless, it is fair to say that the DPCs, because they are under the hierarchal oversight of the Provincial People's Council (PPC) and the leadership of the CPV, are predominantly recipients of powers of delegation: their independent decision-making is highly circumscribed. The ongoing recentralization experiment essentially makes district leaders agents of the province and thereby reinstitutes deconcentration to the leaders of the treatment provinces. Following O'Donnell (Reference O'Donell1994), we can say that the move toward recentralization has shifted oversight of DPCOMs from horizontal accountability by DPCs to upward accountability to provincial overseers.Footnote 5
-
(3) The level or node in the government hierarchy invested with authority: first tier (Rodden Reference Rodden2006), second tier (Bardan and Mookerjee Reference Bardhan and Mookherjee2008), or below. The Vietnamese DPC is a second-tier unit, as it is accountable to the provincial authorities above it and oversees the communes below it. What differentiates this study from previous work on subnational elections in single-party regimes (see Tsai Reference Tsai2007 and Martinez-Bravo et al. Reference Martinez-Bravo, Padro-i-Miquel, Qian and Yao2010) is that the district is an official part of the Vietnamese hierarchy, as opposed to the villages analyzed in China, which have very limited authority.
The Costs and Benefits of Decentralization
The literature on decentralization is rife with controversy. A strong theoretical literature linked to some of the most esteemed political thinkers has proffered a range of positive benefits to local engagement in politics. More recently, a formal economic literature has generated a series of positive hypotheses regarding public service delivery and economic performance.
Specifically, economists have argued that greater local authority in decision-making improves the efficiency of public service delivery, because government outputs can be provided in small units and tailored directly to local tastes (Besley and Coate Reference Besley and Coate2003; Oates Reference Oates1972). In addition, decentralization creates competition for capital and labor, leading to improved governance outcomes; brings decision-making closer to citizens; and limits the role of central government intervention in economic performance (Inman and Rubinfeld Reference Inman and Rubinfeld1997; Tiebout Reference Tiebout1956). Lab experiments by Walker et al. (Reference Walker, Gardner, Herr and Ostrom2000) and Kroll et al. (Reference Kroll, Cherry and Shogren2007) provide suggestive evidence for the link between direct democracy and efficient public good provision under ideal conditions. Furthermore, Hamman et al. (Reference Hamman, Weber and Woon2011) find that democratic delegation helps lab subjects avoid the free-rider problem and frequently achieve more efficient and equitable social outcomes. Similar results are also found in psychology experiments (e.g., Wilke et al. Reference Wilke, Rutte, Wit, Messick, Samuelson, Wilke, Messick and Rutte1986)
As Wibbels (Reference Wibbels2006) notes, however, work in political economy has laid bare the underlying assumptions of decentralization theories (Weingast Reference Weingast1995) and in many cases has demonstrated that they are not met. Thus, the economic benefits of decentralization often fail to appear in practice (Prud'homme Reference Prud'homme1995). Citizens and entrepreneurs are often not fully informed about which level of government provides a particular service and therefore either cannot take advantage of relocation (Rodden and Rose-Ackerman Reference Rodden and Rose-Ackerman1997) or are simply limited in their mobility due to sticky labor markets and cultural differences within a country (Pepinsky and Wihardja Reference Pepinsky and Wihardja2011). Newly empowered local authorities may not have the needs of citizens at heart, and they may not understand local preferences better than their national counterparts (or than agents of the central government in the localities) (Cai and Treisman Reference Cai and Treisman2004; Treisman Reference Treisman2007). A number of scholars have found that there is actually no clear division of authority between the different nodes in a multitiered government (Bolton and Farrell Reference Bolton and Farrell1990). As a result, service delivery may even be less efficient, as decisions and implementation are held up by different levels of government (Cox and McCubbins Reference Cox, McCubbins, Cox and Kernell1992; Treisman Reference Treisman2007) or by the loss of scale economies in provision as services are divided up too narrowly (Bardan and Mookherjee Reference Bardhan and Mookherjee2008). In the language of the discipline, decentralization increases the number of veto points in policy making, which biases toward status-quo policy choices and service provision (Tsebelis Reference Tsebelis2002) so that multiple levels of government jointly provide poor public goods (Volden Reference Volden2005; Wibbels Reference Wibbels2005). Correspondingly, a lab-in-field experiment by Grossman (Reference Grossman and Baldassarri2012) suggests that centralized decision-making (via democratic institutions) improves group outcomes.
Most importantly for our research, a subset of this literature has found that decentralization can actually facilitate capture of the policy-making apparatus by local elites, especially by wealthy notables and large enterprises, creating a company town atmosphere in which elections are undermined and policy is diverted to the benefit of the powerful at the expense of other citizens (Campos and Hellman Reference Campos, Hellman, White and Smoke2005; Reinikka and Svensson Reference Reinikka and Svensson2004).
Drawing on these arguments, we test the following hypothesis:
H1: The removal of local councils will increase the efficiency of public service delivery.
Of course, recentralization may not have the same impact on all public services equally. More likely, recentralization may shift public services closer to the priorities set by the central government over those favored by the locality. Martinez-Bravo et al. (Reference Martinez-Bravo, Padro-i-Miquel, Qian and Yao2010) demonstrate that village elections and increased downward accountability in China generated policy outcomes that were associated with local preferences. In this article, we hypothesize that removing locally elected councils will have the opposite effect.
In general, we can group Vietnamese public services into three very broad categories. The first category includes transportation and communication infrastructure, such as local roads, public transport, post offices, radio, and television networks. The second category includes health and education services to citizens, such as preventive healthcare, health insurance, and local schools. The third category includes localized employment generation programs, such as household business support, agricultural extension, veterinary services, tax exemptions, subsidized credit, and the construction of market places.
The Vietnamese central government funds all categories of public services, but clearly gives top priority to infrastructure, followed by health and education. Following an economic model in which state companies control the leading national industries and give priority to large investors (both foreign and domestic), the central government has offered little support to private, household farms and businesses. This order of priorities was made clear in the 2001–2010 National Strategy for Socio-Economic Development (Central Committee 2000), which states:
“Infrastructure must move first to meet demands of socio-economic development as well as of national defense and security. The transport system is to be smooth and safe all the year round, and modernized. The rural transport network is to be expanded and upgraded. The dyke systems are to be fortified; the water conservancy systems developed and most of them solidified. Electricity, telephone, other basic postal and telecommunication services, dispensaries, solidly built schools, cultural and sports facilities are to be available to most communes. To ensure the basic physical conditions for primary and secondary schoolchildren to learn all-day at school. To provide enough hospital beds to patients” (“Strategic Goals Section” 8–10).
The Strategy also emphasizes the leading role of government corporations (p. 10). The strategy discusses state-owned enterprises (SOEs) at 11 points, while it mentions small and medium enterprises only three times. Reducing agricultural output to 16–17% of the GDP and the employment rate to 50% of the total labor force are considered two of the state's “strategic goals.” These priorities have been operationalized in many official documents, such as the National Five-Year Plan and the Action Plan of the Government.
Local citizens, however, seem to have a different order of priorities, according to Vietnamese responses in the MyWorld survey. Out of 16 items, Vietnamese citizens prioritized: education (76%), healthcare (62%), responsive government (51%), and job opportunities (45%). Better transportation and communications infrastructure ranked much further down the list: water and sanitation (32%), transport and roads (31%), and phone and internet access (15.4%).Footnote 6 Further disaggregating preferences, health services are more frequently needed than educational services. The 2008 VHLSS shows that 68% of citizens report that their families use local health services, while only 38% of citizens report that their families use secondary schools. Thus, we expect:
H2: The removal of local councils will shift public service delivery toward the priorities set by the central government.
In particular, we expect that improvements in infrastructure for transportation and communication are more likely than those in health and education, which are favored by both the public and the central government, and far more likely than those in household farm and business support, areas in which the central government has demonstrated little interest.
Extant Empirical Analyses
In addition to the theoretical limitations of the decentralization hypothesis, the literature has also been sharply criticized for the quality of empirical evidence justifying the causal relationships hypothesized. Treisman (Reference Treisman2007), for instance, devotes the entire 11th chapter of his book to demonstrating the contradictory empirical findings, weak evidence, and lack of robustness of previous work. He summarizes his conclusions by quoting Litvack et al. (Reference Litvack, Ahmad and Bird1998):
“Much of the discussion of decentralization reflects a curious combination of strong preconceived beliefs and limited empirical evidence. . . . It is not an exaggeration to say that one can prove or disprove almost any proposition about decentralization by throwing together some set of cases or data” (13).
Previous work generally falls into three categories. A large number of scholars have examined the decentralization process within individual countries both quantitatively and qualitatively, trying to derive generalizable conclusions from their studies. While this work has shed light on the particular forms of decentralization, these deep single-country studies have had difficulty establishing causality. In almost every case, decentralization occurs as a uniform policy, affecting every subunit of government at a particular level at the same time. Thus, there is no control group and no way to see the trajectory a subunit would have followed in the absence of the decentralization policy. This is particularly problematic because decentralization almost always occurs in the midst of other major institutional and policy reforms (democratization, economic opening, end of conflict). There is simply no way to hold constant the multiple policy, economic, and sociocultural changes taking place at the same time that could generate the same causal outcome.
An alternative approach has been to leverage large cross-national datasets to search for patterns in the data. Do countries with greater amounts of authority invested to subunits demonstrate better economic performance, public service delivery, lower inequality, and better governance? Numerous studies have taken this approach, resulting in a wide range of diverse but often contradictory findings. Although most of the scholars behind these studies demonstrate great empirical savvy, their approach is ultimately hampered because decentralization is not exogenously assigned across countries. States choose to decentralize for a variety of reasons: some hope to distance themselves from an authoritarian past (e.g., Indonesia); others hope to avoid civil conflict between regionally concentrated ethnic groups (e.g., Kosovo, the Czech Republic, and Russia (Hale Reference Hale2004)); some face pressure from international financial institutions (Eaton Reference Eaton2004); some are accommodating electoral outcomes or the career aspirations of local officials (Grindle Reference Grindle2004); and still others expect economic benefits. If these decisions are correlated with the outcome variables, the underlying motivation may generate the causal outcome; decentralization may be just one of many policies symptomatic of the desire to achieve that goal.
A final strand of the literature has sought to test particular implications of decentralization using randomized controlled trials (RCTs) in which treatment is randomly assigned to a set of locations within a country, allowing the researcher to observe the effects of decentralization in the treatment group and compare the outcomes to a control group of similar units. This technique simultaneously resolves the problem of the missing counterfactual in the case-study literature and the unobserved heterogeneity in the cross-national literature, as the experiment takes place within one country and scholars know that the assignment of the treatment is orthogonal to any underlying economic conditions or cultural factors within that one country. This work is just in its infancy, but it has begun to yield findings that question the logic of decentralization. Olken (Reference Olken2007), for instance, has used RCTs in Indonesia to demonstrate that participation in village councils is not associated with reductions in corruption. Humpreys et al. (Reference Humphreys, Masters and Sandbu2006) use an RCT to study how participatory processes may be influenced and coopted by local leaders.
While RCTs such as these certainly represent a positive development in terms of their ability to isolate causal effects, on the question of decentralization they are often constrained by artificiality and political feasibility. “Accountability meetings” and comment cards designed to elicit community participation are often new innovations in the locations being researched. They did not pre-exist the experiment and will not continue afterward. Findings from studies like these therefore pose a challenge to government officials who are deciding to alter institutions with long histories in a given locality and impose a new set of institutional rules that citizens will perceive as permanent. It takes time for citizens to become accustomed to institutional processes, to learn how they work and how they can best make use of them (Knight Reference Knight1992). Moreover, the shadow of the future matters as well. The effort and time a citizen invests in using a new institution may be strongly related to how long he or she expects it to operate in his or her locality. Because of this, limited information can be drawn from mechanisms of decentralization that are only conceived and tested within the experimental setting. Another limitation of RCTs is that they are constrained to small settings, usually at the village level, by budget and political parameters. It is hard to imagine the political feasibility of an RCT trying to abolish a democratic institution at the district level, an experiment that could potentially affect millions of people.
Ideally, then, researchers need experiments put forward by governments themselves that seek to test the impact of real institutions currently existing in the country or institutions that will be employed if the experiment proves successful. Our study follows in this vein. In 2008, Vietnamese authorities sought to remove a local institution that had been enshrined in the 1992 Constitution and that had been empowered by a series of decentralization reforms thereafter. Because the removal was internally controversial and potentially unconstitutional, Vietnamese authorities chose to pilot the program in a limited sample, providing a unique opportunity to observe changes in treatment and control areas over time. We explore the motivation and selection processes for the recentralization pilot below.
DPCS AND VIETNAM'S GOVERNMENT HIERARCHY
Vietnam's government architecture has both horizontal and vertical dimensions. Horizontally, the system is separated into executive, legislative, and judiciary branches. Vertically, the system consists of the central, provincial, district, and commune levels (Figure 1 reproduced from Fforde Reference Fforde2003).Footnote 7 The horizontal division is then replicated at each subnational level, so that branches of the executive (People's Committee), legislature (People's Council), and judiciary (People's Court/Procuracy) exist in every subnational unit in the country (Fforde Reference Fforde2003). Certainly, Vietnam is a single-party regime, so all government institutions are subordinate to the CPV at each level. In a combination of its French and Marxist-Leninist legacies, Vietnam follows a parliamentary system, which means that citizens vote to elect their representatives in the legislative branch (National Assembly (NA) and People's Councils (PCs)), who in turn elect the leadership of the executive branch and appoint the heads of the judiciary branch. Citizens vote to directly elect each of these legislative bodies at national, provincial, district, and commune elections.

FIGURE 1. Organization of the Vietnamese Political System Based on the Revised 1992 Constitution
Notes: According to Fforde (Reference Fforde2003), a leadership relationship means the superior body provides formal direction and/or appoints the leadership. A supervisory relationship implies that the lower body must report to and receive guidance from the superior institution. Source: Reproduced from Fforde (Reference Fforde2003).
District People's Councils
Districts, the focus of this article, are intermediate administrative units, lower than provinces in the government hierarchy and higher than communes.Footnote 8 In terms of function, DPCs perform three major tasks: appointing district personnel, making district policies, and overseeing district authorities.
Under the first task, DPCs elect the executive branch of the district authority, which is the District People's Committee (often abbreviated as DPCOM to distinguish from the elected councils). DPCs maintain the authority to elect or dismiss the chairperson and all members of the DPCOM. Members of DPCs have the ability to formally question the Chairperson of the DPCOM, as well as the heads of the procuracy, courts, and other district offices during DPC sessions. Under the second task, DPCs approve annual socioeconomic development plans, determine the district budget, and make district policies in most public policy areas, including infrastructure, agricultural extension, education, and healthcare. DPCs make decisions by passing resolutions, which are conducted through majority-rule votes. Under the last task, DPCs oversee all of the government offices of communes within their borders. This oversight task includes reviewing periodic reports, making queries, reviewing legal documents, making oversight visits, and conducting votes of confidence.
In terms of organization, DPCs have between 25 and 35 members, depending on the size of the district's population.Footnote 9 Each includes one chairperson, one vice chairperson, and several standing members, all of whom work for the DPC on a full-time basis as part of the standing committee. Other members work part-time for the DPC (i.e., participate in DPC meetings) and have separate full-time jobs. DPCs have very limited authority to raise revenue on their own; funding and resources for DPC operations come mainly from provincial government budgets.
Each DPC maintains a walk-in office, which is open daily to consider, receive, and respond to constituent requests. DPCs are expected to hold regular public meetings with constituents and report to them about the activities of the DPC and the District People's Committee. Because of these functions, opponents of DPC removal often present an idealized version of DPCs as bastions of democracy (Nguyen Anh Reference Nguyen2010).
Limits on DPC Authority
It is important not to exaggerate the importance of DPCs, which operate in a highly constrained political environment. The true amount of downward accountability to voters is highly disputed. Vietnam remains a single-party regime, and candidates for public office are vetted by the CPV. While seats are contested by multiple candidates and turnout is highFootnote 10 because voting is mandatory, it is not clear how much information Vietnamese citizens actually possess about the candidates or the district election process. In the 2011 UNDP-PAPI survey, only 5.8% of citizens could correctly answer all three basic questions on a civics test of which institutions were subject to elections and the length of officials’ terms. 14.8% missed all three questions (UNDP-PAPI 2011). Rather than providing vertical accountability (O'Donnell Reference O'Donell1994), low-quality elections and limited voter information allow DPCs to be captured by local elites who can nominate favored candidates for positions, manipulate candidate vetting in their favor, and use their informational advantage to make sure their choices are elected (Malesky and Schuler Reference Malesky and Schuler2011). Because these same local elites are also represented on the DPCOM, the DPC has a very hard time fulfilling its oversight role of the local executive (Van Arkadie et al. Reference Van Arkadie, London, Huong, Hanh, Oanh, Thang and Khoi2010, 155; Vu Reference Vu2012, 19). As Van Arkadie et al. (Reference Van Arkadie, London, Huong, Hanh, Oanh, Thang and Khoi2010) colorfully put it in a review of Vietnam's decentralization efforts, “Local government is seldom transparent; so that decentralization has sometimes seemed to have resulted in a kind of bureaucratic patrimonial localism (p. 185).”
Prior to the pilot, DPCs were considered to be paper tigers by most analysts of local governance (Kerkvliet Reference Kerkvliet, Tria Kerkvliet and Marr2004). As in China, DPC officials are generally party members and therefore must be accountable to party superiors in their district and province, which limits their decision-making authority (Whiting Reference Whiting, Naughton and Yang2004). By convention, the district Party Secretary usually serves as Chair or Vice Chair of the DPC as well, allowing the local party to influence DPC decision-making. In addition, full DPCs only meet twice a year and are represented by small standing committees when out of session. Finally, the DPC is only one of three assemblies that operate at the local level, so their initiatives must consider the framework imposed by Provincial PCs and anticipate the implementation of Commune PCs. Together, these limitations bias against finding a significant effect of the removal treatment.
Removal of DPCs
The idea of abolishing DPCs was proposed from the top down. In August 2007, the Central Committee of the CPV debated and passed Resolution 17-NQ/TW, directing the government to take stronger action regarding public and local government reform. The resolution pointed out the problems of the current public administrative system in Vietnam, and hinted that it was facilitating abuses, waste, and hold-up problems created by local leaders:
“Our public administration has many limitations and weaknesses. . . . The functions and responsibilities of various bodies within the public administration system are vague, overlapping and missing; the state hierarchy is burdensome and inappropriate. The qualifications of the cadre and officials do not meet the requirements; red tape and waste are pervasive. Institutions and regulations for public finance management have many problems” (Central Committee of CPV 2007, 1).
One of the main solutions laid out in Resolution 17 was to abolish DPCs and simplify current district governments into provincial government administrative agencies for handling district tasks (pp. 8–9). However, this solution faced considerable objection by the central government, VNA, local authorities, and mass media. Opponents of this solution pointed out that DPCs are a key democratic institution for promoting the interests of local populations. Pham Minh Tuyen, Chairman of the National Assembly's Committee for Delegate Activities, asked, “Who would examine and keep checks on the administration at the same level? Wouldn't increasing members of the Provincial People's Council and increasing meeting times also add extra costs to the budget?” Objections were also registered in the highest echelons of the political hierarchy, including by the Vice Chairman of the National Assembly, Nguyen Duc Kien (Nguyen Anh Reference Nguyen2010).
On the other side of the debate, supporters of the removal emphasized the inefficiency and ineffectiveness of DPCs, claiming that the time, money, human resources, compromises, and impasses involved in DPC deliberations were considerable. Pham Phuong Thao, Chairwoman of the Ho Chi Minh City People's Council, estimated that the removal of each DPC in Ho Chi Minh City would save up to $85,000 each year (Pham Thao 2008). Furthermore, Vietnam had four such representative bodies, raising the question of whether the cost of maintaining DPCs was justified by the benefits (Nguyen Thao 2010; Van Tat Thu 2010). Removal advocates pointed out that DPC functions could easily be handled by “upper and lower bodies” (Nguyen Thao 2010).
When resolution could not be reached in the debate, a consensus quickly emerged that the impact of DPCs was essentially an empirical question that should be addressed by experimentation.
EXPERIMENTATION WITH DPC REMOVAL
In December 2008, the National Assembly passed Resolution 26, allowing for the piloting of DPC removal. Given its paramount importance, the government created a National Steering Committee headed by the Prime Minister to coordinate this institutional experiment. Under the direction of the National Steering Committee, the Ministry of Home Affairs (MOHA) and various government agencies actively prepared for the launch of the policy experiment (GSRV 2009).
Selection of Treatment
MOHA was given the task of designing the pilot in order to “provide an objective and scientific evaluation of DPC removal (GSRV 2009, 1).” One of the key issues in the design was the selection of the treatment group. Researchers from MOHA conducted a series of workshops across the country to receive input from policymakers, social scientists, and the public. They then came up with a set of selection criteria, which they presented and on which they received feedback from line ministries and committees of the VNA. In January 2009, the government submitted a proposal to the VNA, which laid out four criteria for the selection of the treatment group:
-
1. The sample size of the treatment should be sufficient for scientific evaluation of impact.Footnote 11
-
2. The sampling should be stratified by region and subregion of the country.
-
3. The sampling should be stratified by city versus rural, lowland versus highland, midland versus internationally bordered land.
-
4. The sampling should be stratified by socioeconomic and public administration performance.
Upon reviewing this proposal, the Standing Committee of the VNA passed Resolution 724, listing 10 provinces (99 districts) in the treatment group, which had been selected according the four criteria above. The remaining 53 provinces (498 districts) would serve as the control group. Figure 2 demonstrates how the selection was stratified by subregion and national-level city.

FIGURE 2. Map of Treatment Provinces and National-Level Cities
While the MOHA researchers were careful, the experiment is certainly not an RCT. Consequently, it is important to assess whether the treatment and control groups are balanced on observable characteristics. Such information would provide tentative evidence that the selection criteria were exogenous to the outcomes and therefore that the intervention can be treated as a quasi experiment (Dunning Reference Dunning2008).Footnote 12 Table 1 provides a balance table of 46 economic, natural, demographic, governance, infrastructural, and legal indicators, measured prior to the intervention. The first two columns show the simple means of the two groups in these indicators. Since national-level citiesFootnote 13 were oversampled to test whether the experiment was applicable in urban settings, they comprise 30% of the treatment group and only 4% of the control group. Consequently, the treatment provinces appear to perform better in several areas. When excluding national-level cities, however, the differences between the two groups virtually disappear.
TABLE 1. Balance Between Ten Treatment Provinces and the Rest of the Country Based on 2008, Pretreatment Data

In addition to cities, MOHA also stratified their selection by region, so to ensure that each of the country's seven regions was represented (excluding the Central Highlands for security reasons). This makes it necessary to perform a true balance test within each region, as if analyzing an RCT with a stratification strategy. To this end, we regress these 46 indicators on the treatment dummy and control for two key criteria used for stratification (national-level city and region-fixed effect). Column ‘P-treatment’ in Table 1 reports the p values of treatment in these 46 regressions and shows that the treatment is not significantly correlated with 45 of these characteristics. In other words, the balance between the treatment and control groups seems to be as good as in stratified randomization, at least in all observable dimensions.
Selection based on unobservables is a possibility, as MOHA may have selected leaders that were considered more pliant or more likely to implement successfully. Because of the approach, we can never know for certain, but we do test to see whether the treatment provinces differ on leadership questions used in the Vietnamese Provincial Competitiveness Index (PCI), an annual survey of 10,000 Vietnamese firms (Malesky Reference Malesky2009). These questions are included in the governance panel of Table 1. We find no evidence that the 2008 respondents thought their provincial leaders were better at working within the law, more creative and clever, or more likely to risk punishment than leaders of control provinces.
Implementing the Pilot Intervention
Following Resolution 26 of the VNA, the Government and Ministries issued a series of documents guiding the DPC abolishment experiment. The 2004–2009 DPC term ended on April 25, 2009, and DPC elections were not held in experimental locations after this date. The existing personnel of DPCs had their responsibilities transferred to executive People's Committees in the same districts or provinces. The three existing functions of DPCs were transferred to different government bodies. The selection and dismissal of DPC personnel was assigned upward to Provincial People's Committees, which were also charged with appointing the new body. Policy-making and budget-approval functions were also transferred to the Provincial People's Committees. Finally, general oversight was transferred to the Provincial People's Councils. This transfer of power clearly implies that the nesting of districts within provinces will impact our ability to draw correct inferences, and that districts cannot be considered as independently drawn.
The abolition of the DPC system could have critical implications for public services and programs as well as for general wellbeing within each district. As we discuss in Section 1, the theoretical literature does not provide a clear guide as to whether this abolition would lead to improvement or deterioration of public services and governance at the district and commune levels.
OUR EMPIRICAL DESIGN
To analyze whether DPC abolishment improved public service delivery, we take advantage of a unique panel dataset that allows for a difference-in-difference (diff-in-diff) analysis on key outcome variables considered important by local and national leaders.
Data Source
To ensure reliable estimates of local performance over time, we use commune data from the three most recent Vietnam Household Living Standard Surveys (VHLSSs) in 2006, 2008, and 2010. These surveys were conducted by the General Statistics Office of Vietnam (GSO) with technical support from the World Bank. The 2006 and 2008 VHLSSs use the 1999 Population and Housing Census as a sampling frame, while the 2010 VHLSS uses the 2009 Population and Housing Census as a sampling frame.
The VHLSS has two components. The first is a stratified welfare survey of around 9,000 households. In addition, research teams are instructed to collect “hard data” from commune leaders and are provided a checklist to help gauge whether basic services are being met, such as whether or not the commune has a post office or an agricultural extension center. Information on commune characteristics was collected from 2,280, 2,219, and 2,199 randomly selected rural communes in the 2006, 2008, and 2010 surveys, respectively. Commune data include information on commune demography as well as on general economic conditions and aid programs, nonfarm employment, agriculture production, local infrastructure and transportation, education, health and health facilities, and social problems in the communes. Importantly, the commune dataset only includes rural communes, omitting the ward, the equivalent bureaucratic unit within cities. All analysis, therefore, only studies the impact of recentralization on rural localities using the hard data collected from communes.Footnote 14
Estimation methods
To examine the effect of the removal of People's Councils, we employ a difference-in-differences estimator and commune data from the 2008 and 2010 VHLSSs using the following specification:
 $$Y_{it} = \alpha + T_t \beta + D_{it} \gamma + T_t D_{it} \theta + X_{it} \delta + \varepsilon _{it} ,$$
The nested nature of the data poses a unique challenge. Communes can certainly not be treated as independent as they are clustered within districts, which control important financial and administrative decisions. The standard approach in such a situation is to cluster standard errors at the treatment level (the district), which will limit biases caused by the correlation of errors within a unit. The nature of the selection process, however, poses an additional conundrum. The selection of all districts within ten provinces (with only limited exceptions) implies an additional level of clustering that must be taken into account, especially as the district responsibilities had by that time been transferred upward to the provincial councils. To deal with this problem, we adopt the multiway clustering technique of Cameron et al. (Reference Cameron, Gelbach and Miller2011), which allows us to address the correlation of errors among communes at both the district and provincial levels simultaneously.Footnote 15
Choosing the appropriate dependent variable for the analysis is also not trivial. As Treisman (Reference Treisman2007, chap. 11) notes, the analyst's choice of variable for gauging public service delivery has critical implications for whether decentralization is deemed successful. Kramon and Posner (Reference Kramon and Posner2012) lodge a similar complaint about the cherry-picking of dependent variables in analyses of redistributive politics. To avoid this temptation, we employ as many outcome variables as we can find in the VHLSS that meet two criteria: (1) they are in areas under the authority of DPCs according to the 2003 Law on the Organization of People's Councils and People's Committees (infrastructure, communication, public health, education, agricultural extension services); and (2) they are factors that could possibly be altered by local leadership within the one-year time frame under investigation. For instance, measures of household wealth and productivity are available, but it is hard to imagine that district policies could radically alter the career choices and income streams of respondents within one year. We identify 30 outcome variables that fit these criteria, employing the exact same specification for all of them.Footnote 16
As noted above, provincial selection was stratified, so treatments are representative of every region (except the Central Highlands) and national-level city by design.Footnote 17 As suggested by Bruhn and Mackenzie (Reference Bruhn and McKenzie2009), we include dummy variables for regions and cities in order to ensure that these design choices do not lead to overestimation of treatment effects. Other control variables include commune location and population density. It should be noted that control variables should not be affected by the treatment variable, i.e., the removal of the People's Councils in our case (Angrist and Pischke Reference Angrist and Pischke2008; Heckman et al. Reference Heckman, Lalonde, Smith, Ashenfelter and Card1999). Thus we limit control variables to more exogenous variables where minimal nonbalance has been detected at the commune level. Our results are robust to eliminating these controls.
Table 2 presents the regressions of commune outcomes on time, treatment, and interaction between time and the treatment variable, as well as other control variables for the first seven of the selected outcome variables.Footnote 18 We provide mean values of the dependent variable in 2008 in order to estimate the amount of room available for improvement. The highlighted row (time*treatment) depicts the ATE for our analysis. In this set of outcome variables, we find that the ATE was positive and statistically significant. For instance, all-year roads have grown 8.7% faster in the treatment than in the control group; public transportation has grown 10.2% faster. Of course, not all outcome variables were significant, but as Figure 3 shows, the experiment revealed a disproportionately high number of positive effects.
TABLE 2. Difference-in-Difference Estimation Between 2008 and 2010 using VHLSS Commune Data

Regressions employ OLS with standard errors clustered at district level and provincial level (*** p < 0.01, ** p < 0.05, * p < 0.1). Regional fixed effects employed for seven major regions, but five provinces of Central Highlands are dropped, as no pilot occurred there. Table reports only the first seven outcome variables in dataset. Full results are reported in Appendix D.

FIGURE 3. Difference-in-Difference Analysis of Key Outcome Variables
Notes: This figure shows the Average Treatment Effect (ATE) of district removal. The results are derived from the fully specified difference-in-difference regression models in Table 2 and Online Appendix D, with each variable listed on the y index used as the dependent variable in a separate regression. Dependent variables are organized into six groups: (1) Infrastructure Index (measuring quality of transportation infrastructure); (2) Agricultural (Agr.) Services Index (measuring access to agricultural extension programs and credit); (3) Health Services Index (measuring quality of public health services); (4) Education Index (measuring access to and quality of public education); (5) Communications Index (measuring post office and telecommunication infrastructure); and (6) HH Biz Dev't Index (measuring household business development services, such as credit access and markets).
In Figure 3, we present the ATE along with a 90% confidence interval. Intervals that do not cross the dashed line are significantly different from zero. ATE results are organized by type of public service. Here, we see that the effect of District People's Council removal is statistically significant for 11 out of 30 outcomes (over one-third!), nine of which are in a positive direction. Such a large number of significant findings would not be predicted by frequentist statistics, an inference to which we return below.
A few additional patterns emerge from careful inspection. The treatment appears to have been particularly successful at improving transportation infrastructure (road, public transport, and socioeconomic projects), communication infrastructure (television broadcasting and post offices), and health care (assistance with fees and public health projects). Under the current law, DPCs have the authority to shape local policies and decisions in these sectors. The effects we find here suggest that removing such authority actually improves these public services. Most other outcome variables, particularly educational measures and agricultural extension, did not show significant improvement. On two outcomes, the treatment had a deleterious effect. Treatment provinces were less likely to have tax credits for business and veterinary visits.
To probe these aggregate patterns more directly, we construct six additive indices for (1) transportation infrastructure, (2) agricultural support services, (3) public health services, (4) education services, (5) communication infrastructure, and (6) support for household business development. The variables can be identified directly under the respective headings, which are capitalized in Figure 3. The indexing strategy is as conservative as possible, simply a sum of all the dichotomous measures. In a few cases, the variable under investigation is continuous (e.g., the share of households receiving credit). In these cases, we rescale the variable to range between 0 and 1 and add it to the index. We then rerun the diff-in-diff analysis on the six additive indices. The results, which can be seen in panel 1 of Table 3, confirm H2. Removing DPCs definitely generated positive improvements for districts in areas that were of strategic importance to central leaders (infrastructure and public health). These results are quite substantial and statistically significant. In areas where citizens may have preferred more assistance, the treatment appears to have been less effective (agriculture, education, and household business development). While individual indicators prove significant in each one, these are undermined by lack of improvement in other areas.
TABLE 3. Difference-in-Difference Estimation using VHLSS Commune Data on Aggregate Indices
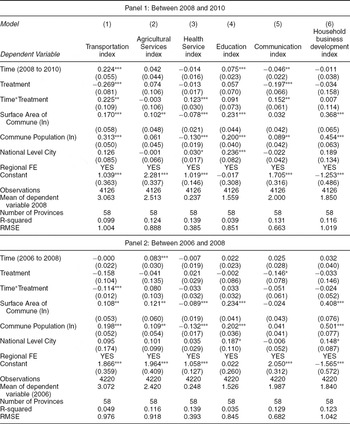
Regressions employ OLS with standard errors clustered at the district level and the provincial level (*** p < 0.01, ** p < 0.05, * p < 0.1). Regional fixed-effects are employed for seven major regions, but five provinces of the Central Highlands are dropped, as no pilot occurred there. Dependent variables are additive indexes created by summing up the groups of variables in Figure 3. Continuous variables are re-scaled between 0 and 1, and then added in with dichotomous variables.
ROBUSTNESS TESTS
At first blush, the findings appear compelling and confirm that recentralization can improve the efficiency of public service delivery (H1), especially in arenas that are of explicit importance to the central government (H2). Nevertheless, the nature of selection and the implementation of the rollout pose a number of threats to validity. In this section we tackle these threats one by one: (1) The Parallel Paths Assumption; (2) Spurious Correlation; (3) Motivated Interference by Central Officials; and (4) Hawthorne Effects.
The Parallel Paths Assumption
The diff-in-diff estimator identifies the impact of the treatment under the assumption that the unobserved difference between the treatment and control groups is time-constant between survey rounds. In other words, we should not observe differential trending between treatment and control groups in the same direction as in the experiment in prior periods. We test this assumption by running diff-in-diff regressions using commune data from the 2006 and 2008 VHLSSs. The two surveys were conducted before the intervention in 2009, and therefore we should expect that the effect of the interaction between the time and treatment variables should not be statistically significant. The lower panel of Table 3 depicts the results of this analysis for the six aggregate indices,Footnote 19 which confirm the assumptions of the model. Only two out of 30 outcome variables are significant and positive in the pretreatment period. In only one case is the ATE for an index statistically significant, but it is in the wrong direction. Infrastructure was actually worse for treatment provinces before the removal of DPCs. For instance, road quality improved at a slower rate in treatment than control provinces between 2006 and 2008, so that treatment provinces were starting from a slight deficit at the time of the intervention. A few individual variables also demonstrate this pattern, but these deficits should only make it more difficult to identify effects of the treatment. Far more dangerous would be positive trending continuing into the experimental period, which would lead to bias in the treatment effect coefficient. We observe no such cases, however, indicating that pre-experiment trending in the treatment provinces did not contribute to the results observed in 2010.Footnote 20
Randomization Inference Test
Another empirical concern is that the effects of the treatment are simply the result of a lucky draw from the universe of possible outcome variables. In other words, a critic might conjecture that there is nothing special about the treatment at all. If we simply repeat the analysis post-hoc and randomly assign a “treatment” across the observed differences, 11 significant outcomes would be well within the range of possible outcomes.
To this end, we conduct a randomization inference test, where we perform 1000 Monte Carlo simulations, randomly assigning an artificial treatment and then regressing outcome variables on our treatment with the exact same specification used above. Figure 4 presents the results of this analysis. Here, we show the number of total significant and significantly positive outcomes observed in the DPC experiment (long-dashed line), the pretreatment 2006–2008 analysis (short-dashed line), and each Monte Carlo simulation. Notice that while the pretreatment trends fall well within the range of significant outcomes that could be obtained by pure chance, the DPC experimental results were not reached in a single one of the 1,000 simulations.Footnote 21

FIGURE 4. Randomization Inference Test on Total Number of Significant Outcomes
Notes: Comparison of Treatment to Monte Carlo Estimation with 1000 Simulations. Long dashes show number of significant outcomes from actual treatment (2008–2010; see Online Appendix D for full results). Short dashes show number of significant outcomes from pretreatment trending (2006–2008; see Online Appendix E for full results).
The DPC experiment's positive effect on public service delivery cannot be brushed aside as pure coincidence. It seems quite clear that abolishing the elected council improved the efficiency of an important set of public services, supporting H2.
Motivated Interference by Central Officials
Skeptics might argue that central officials wanted the experiment to be successful and, despite pretending to be careful about selection, actually manipulated the results by providing greater resources to the treatment group. This bias would explain the positive results but destroy our ability to draw theoretical inferences regarding the impact of recentralization. To test for such interference, we collect data on direct and indirect central transfers to each province between 2006 and 2012. If transfers diverged significantly between treatment and control groups over this period, this would provide strong evidence of elite manipulation of the experiment.
The results of this analysis are presented in Figure 5. Panel 1 presents the trend in total transfers per capita over time, where treatment provinces are depicted with straight lines and control provinces with dashed lines. Panels 2 and 3 divide overall transfers into nontargeted (or equalizing) transfers (to make up for local budget deficits) and targeted transfers for central government programs in infrastructure, poverty alleviation, and environment. Finally, panel 4 depicts the share of provincial own-source revenue that the location is allowed to retain. Eleven wealthy provinces must share between 75% and 10% of own-source revenue with the central government, providing an implicit transfer that is embedded in the target amount. In all four cases, we can see clearly that control provinces received a greater share of resources per capita over the entire period under investigation, beginning in 2006 before the experiment and continuing afterward. While all four charts show increases in transfers after the experiment, there is no evidence at all suggesting that special treatment was given to treatment locations. A t test provided in the legend provides additional confirmation, showing that treatment provinces did not receive statistically significant increases in any form of transfers between 2008 and 2010. We also investigate a tranche of funds available to the Vietnamese Government for special projects to see if they were employed in a biased manner.Footnote 22

FIGURE 5. Test of Motivated Interference in Experimental Performance
Notes: Comparison of per capita transfers and state investment from the central government to control and treatment groups between 2006 and 2012. The treatment group is represented by solid lines and the control group by dashed lines. 90% Confidence Intervals (CIs) are also presented for each year for both treatment (light gray) and control dark gray. T tests are of the growth in all four variables between 2008 and 2010. Each panel studies a different type of transfer: panel 1: total transfers (per capita) in millions of VND; panel 2: equalizing transfers to make up for budget deficits; panel 3: target transfers for socioeconomic development programs (infrastructure, agriculture, environment, and poverty alleviation); panel 4: share of own-source revenue that can be retained by the province; panel 5: liabilities held by Central State Owned Enterprises (CSOEs) located in the province over provincial GDP; panel 6: central state equity held by CSOEs in province over provincial GDP. Source: MOF (2006 to 2012) Source: GSO (2006–2011).
Vietnam also engages in indirect transfers to subnational governments through state-owned banks and centrally managed state-owned conglomerates (Pincus et al. Reference Pincus, Anh, Nghia, Wilkinson and Thanh2012). State-owned banks do not release their lending portfolios, but it is commonly estimated that 70% of their loans go to SOEs (Malesky and Taussig Reference Malesky and Taussig2009). Because we cannot access state-owned bank balance sheets, we rely on firm-level data from the GSO Enterprise Census over the research period. Using the annual census, we create measures of aggregate liabilities held by centrally managed SOEs in the province as a proxy for state bank lending in panel 5. We also track “owner” equity, which gives us a sense of the share of capital introduced to the SOE through the national budget in panel 6.Footnote 23 We standardize both figures by nominal, provincial GDP. Treatment provinces do have larger average allocations of state lending and slightly higher owner equity over the research time period. There is no evidence, however, of disproportionate increases in these figures. In fact, liabilities in the control group actually grew at a faster rate after 2008.
Hawthorne Effects
A related concern is known as the Hawthorne effect, whereby a treatment group experiences gains not because of the experiment, but because they received special treatment and observation (French Reference French and James1950). In the Vietnamese case, this may have come in the form of a special unit from the Ministry of Home Affairs (MOHA) observing progress. Fortunately, a limited budget prevented MOHA from evaluating all 10 treatment provinces. Rather, they chose to evaluate and survey citizens from five treatment and five control provinces, allowing us to disentangle the effect of having central officials in suits roaming the province from the actual effects of DPC removal.Footnote 24
To test for Hawthorne effects, we replicate the analysis in Section 4 but with a slight twist—we impose a triple interaction of time, treatment, and whether the province received a MOHA delegation to survey citizens (survey). These results can be observed in Table 4. Panel 1 reports the regression coefficients. The first thing to notice is the interaction term (time*treatment), as this term represents the treatment effect without the contamination of MOHA visitors. Even though only five treatment provinces were surveyed, making statistical significance more difficult to achieve, the ATE remains sizable and positive for transportation, health, and communication. Moreover, it is still strongly significant for health and communication, indicating that MOHA visitors did not influence these results.
TABLE 4. Test of Hawthorne Effect—Using Visits from Ministry of Home Affairs to Conduct Evaluation

Regressions employ OLS with standard errors clustered at district level and provincial level (*** p < 0.01, ** p < 0.05, * p < 0.1). Triple interaction of treatment, time, and visits by MOHA survey team. Regional fixed effects employed for seven major regions, but five provinces of Central Highlands are dropped, as no pilot occurred there.
Two further differences are critical for assessing whether Hawthorne effects inhibit the experiment. First and most important is the set of 10 treatment provinces. If the provinces that received MOHA delegations within that treatment group significantly outperform the nontreatment provinces, this would be evidence of bias. We can conclude that this is not the case. The coefficient on the triple interaction (time*treatment*survey), which is the effect of the survey in treated provinces, is not significant for all six indices. This indicates that the visit did not have any special effect on the final ATEs observed in Section 4. A secondary test involves comparing the control group that was surveyed to the control provinces that were not surveyed. If surveyed provinces outperform other control locations, this would be a cause for concern, as it would suggest that the visiting delegation generated additional effort from local leaders. Once again, we can rest assured that this is not the case.
Certainly, with such a small number of province-level units, statistical significance may not be particularly compelling. Consequently, we calculate the predicted effects for each of the cells generated by the experimental conditions in panel 2 for the six aggregate indices. Probing further into the three indices where the DPC experiment appeared to be most effective (transportation, health, communication), we find that the score of the treatment group that did not receive a MOHA delegation is actually higher than that of the group that was visited. In other words, provinces that received a MOHA delegation did marginally worse, not better.
In sum, after repeated robustness tests, it is clear that the removal of DPCs had a significant impact on the delivery of public services that were most important to central officials. This is a surprising result that offers a useful corrective to the extant decentralization literature.
TESTING THE CAUSAL MECHANISM—UNBLOCKING POLITICAL CAPTURE
Three general mechanisms may explain the above results. First, DPC abolition may have reduced citizen influence over policies, allowing the center to drive through its favorite initiatives. A second basket of mechanisms can be grouped under the heading of bureaucratic restructuring possibly leading to efficiency improvements. DPC removal eliminated a key veto point in the implementation of central policies, but maintained other assemblies to capture citizen views. In addition, oversight of DPCOMs was shifted to provincial authorities, substituting upward accountability for horizontal accountability to the DPC. Third, DPC removal reduced capture of the decision-making process by local elites, who had exploited the extra veto point to hold up central programs in exchange for a share of the rents and demanded bribes from citizens trying to comply with regulatory procedures. The capture story combines elements of the first two mechanisms, as it requires imperfectly implemented local elections in the control group and bureaucratic restructuring in the treatment group that shifts accountability upward and unblocks decision-making.
Unfortunately, the research design was not fine-grained enough to reveal for certain which mechanism generated the underlying findings. In an ideal experimental setting, one could disentangle these mechanisms, but in this project, the fact that only one treatment occurred means we can only speculate. One way to advance the discussion, however, is to test the observable implications of the above mechanisms. Specifically, the diff-in-diff analysis generated a number of downstream puzzles: (1) Why did DPC removal expedite progress on central priorities without a discernible negative effect on policies favored by citizens? (2) Why was rapid progress made on projects with relatively long gestation periods (i.e., all-year roads, post offices)? (3) Why was the achievement of control provinces worse on nearly all services than that of the pilot group, despite transfers to control provinces? Where did the money not spent on public services go?
Removal of vertical accountability to citizens cannot answer the first question. Control provinces should have had better performance on services favored by citizens; instead, we observe noneffects of the treatment on the aggregate indices and sporadic positive performance on individual indicators. Bureaucratic restructuring can answer the first two questions, but it provides only a partial answer to the third. Provincial oversight may reduce waste, but it does not answer the question of why the horizontal accountability of executives to DPCs in the control group was unsuccessful. In addition, we were unable to find evidence for two potential tracers of a pure bureaucratic restructuring story. The pilot did not appear to affect the distribution of service delivery among districts or the turnover of local leaders, as might have been expected from increased provincial authority over district policies.Footnote 25
One causal mechanism, however, provides an answer for all three puzzles—the elite capture mechanism. DPC removal did not impact progress on citizens’ service preferences because the DPCs in both treatment and control were not acting on behalf of voters in the first place. Policy was being directed by an elite group of local decision-makers. Rapid progress could be made on long-term projects, because capture was holding up implementation of central-level projects that were “shovel ready” (e.g., Chinh Trung 2011; Tri Tin 2013). They had already been decided upon at the highest levels and just needed local authorities to approve and pass the appropriate implementing documents. The conflict between local elites and central policymakers can be intense, dampening project implementation (Tuan Ngoc 2009) and public scrutiny of local projects (Nguoi Dua Tin 2012). A postpilot report from the Da Nang People's Committee (2012), for instance, credits reductions in decision delays and administrative expenses for improved service delivery. Finally, transfers were higher to control provinces without corresponding improvement on other public services because of corruption. Money was leaking out of the projects into the hands of district officials (Le Anh 2012).
The answer to the third puzzle provides an additional observable implication to study. If DPC removal unblocked elite capture of the policy-making apparatus, we should observe lower corruption in treatment provinces. There is both qualitative and quantitative support for this theory. As the VNA debate about DPCs was taking place, a joint team of foreign and Vietnamese experts showed that decentralization in Vietnam had been unsuccessful in terms of its stated goals (p. 18) and led to the uneven allocation of public services, particularly regarding infrastructure (p. 102) and healthcare (p. 144) (Van Arkadie et al. Reference Van Arkadie, London, Huong, Hanh, Oanh, Thang and Khoi2010). The report concluded that the main reason for the disappointing results was corruption, claiming that decentralization produced, “unaccountable and corrupt local institutions that respond inadequately to public needs” (183).
To study increased corruption quantitatively, we shift our attention to an alternative dataset. The UNDP-PAPI Survey (13,642 total respondents, 9,452 in rural districts) was specifically designed to measure quality of governance at the local level (UNDP 2011).Footnote 26 One battery of PAPI asks respondents to reflect on corruption in their locality. The questions look at multiple forms of petty bribery, but three questions in particular give us insight into the state capture mechanism: (1) leaders’ diversion of state funds for personal use; (2) the use of kickbacks on government construction contracts; and (3) the necessity of bribery for obtaining government positions. The full wording for these questions is available in Table 5, where we study the difference between control and treatment groups in relation to their leaders’ behavior.
TABLE 5. Effect of Treatment on Reported Corruption (Traditional Questions, PAPI Survey)

Regressions employ OLS with probability and post-stratification weights to address the probability of selection with robust standard errors clustered at the province and district levels (***p < 0.01, **p < 0.05, *p < 0.1). Regional fixed effects employed for seven major regions, but five provinces of Central Highlands are dropped, as no pilot occurred there. N varies by number of citizens who experienced service. In Models 3, 6, and 9 the control group is trimmed to the two closest (by distance in km) non-treated districted in neighboring provinces for ever treatment province.
Source: PAPI-UNDP Survey 2011 (Question D402): I am going to read several statements about events that occur sometimes. When I read them to you, please think about your own experience and tell me how much you agree with each statement. That is to say, you agree completely, you agree somewhat, you disagree or you disagree completely. (Answers were coded as 2. Agree; 1. Somewhat Agree; 0. Disagree, but were re-coded for analysis to 1. . Agree; 0. Disagree):
A. Officials divert funds from their budget for their personal benefit.
E. Officials receive kickback in exchange for construction permits.
F. In order to get a job in government, people have to pay a bribe.
Because PAPI only surveyed the full set of provinces in 2011, we cannot perform a diff-in-diff analysis; rather, we simply look at the differences in the average effect between the control and treatment groups. As with VHLSS, we maintain regional and national-level city effects with a few exogenous controls for respondent-level covariates that could plausibly be correlated with outcomes (the sex, age, and ethnicity of each respondent, whether the respondent holds a government job, and individual wealth). To remain consistent with VHLSS analysis, we (1) drop all observations from the Central Highlands, which did not participate in the experiment; (2) analyze only rural districts; (3) employ regional and national-city dummy variables; and (4) use robust standard errors, clustered at both the province and district levels. All results are robust to removing all control variables.Footnote 27
In Table 5, we present the results of the capture analysis. Responses are recoded to create a dichotomous variable that combines “Agree” and “Somewhat Agree” into a single value of “Agree.” This facilitates interpretation and the use of a linear probability model.Footnote 28 The treatment is significantly associated with lower corruption in all three categories. In treated provinces, officials are 10% less likely to divert public funds, 8% less likely to expect kickbacks on corruption procurement, and 13% less likely to pay a bribe to obtain a government job. The results are a strong confirmation that recentralization, under the specific setting of a single-party authoritarian regime, can reduce local capture caused by imperfect elections.
Because the PAPI is a single-shot survey of citizen perspectives, the above results cannot be subjected to the rigor of a diff-in-diff design. We address this limitation with a literal “nearest neighbor” matching strategy, where we identify the two nearest districts across the border in nontreated provinces. We trim the control group to these proximate communes, providing greater balance on district characteristics. We report the results in models 3, 6, and 9, finding that the results are actually strengthened by the more demanding approach.
CONCLUSION
Despite a fruitful decades-long theoretical debate, the literature on decentralization has stagnated in recent years as scholars have encountered a range of empirical problems rendering causal identification difficult, if not impossible. The Vietnamese pilot project to remove DPCs in 99 districts nicely resolves these problems for the following reasons: (1) it has a well-defined control group, allowing within-country comparison; (2) the timing of the experiment's introduction was exogenous to outcomes; and (3) the intervention involved a real-world institution that had existed as part of the polity since 1992. In short, it provides the ideal research design for studying the impact of subnational political and financial empowerment. Moreover, the experiment provides the first controlled analysis of recentralization, an institutional change that will likely become more common as the pendulum swings back from the misplaced euphoria of the mid-1990s. Our analysis reveals that the removal of Vietnamese DPCs significantly improved a wide range of public services that were favored by central authorities (roads, healthcare, and communications). Services favored by local citizens (education, agriculture, small business support), however, did not benefit from decentralization. Further analysis reveals that the most likely mechanism for the improved performance was that the pilot unblocked local capture of district policy-making, thereby releasing halted projects and reducing corruption. More generally, the capture result shows how imperfectly implemented local elections can ultimately undermine quality of governance and service delivery.
As in all projects, there are important limitations to generalizing from the Vietnamese experience. Selection of the treatment was not randomized, so unobserved targeting remains a possibility. The pilot took place in a single-party authoritarian setting that has traditionally struggled with local implementation of central initiatives. Thus, we are cautious about generalizing the findings to settings with truly democratic elections at the central or local level. Moreover, there are questions of the breadth of our conclusions. The pilot is still ongoing, and long-term effects may be different from the medium-term results we identify. Finally, there is potential for fallacy of composition—what may work in the pilot may not be true for all districts, especially as future recentralization forces the central government to make difficult decisions about the allocation of resources for public goods.
These limitations aside, however, this article provides a positive advance in our understanding of recentralization in settings with imperfect local elections.
Supplementary materials
To view supplementary material for this article, please visit http://dx.doi.org/10.1017/S0003055413000580


Comments
No Comments have been published for this article.