


Introduction
There is a large body of research on the rise of populist parties (e.g., Colantone and Stanig Reference Colantone and Stanig2018; Hangartner et al. Reference Hangartner, Dinas, Marback and Matakos2019; Eatwell and Goodwin Reference Eatwell and Goodwin2018; Guiso et al. Reference Guiso, Herrera, Morelli and Sonno2019; Kaltwasser et al. Reference Kaltwasser, Taggart, Espejo and Ostiguy2017; Kriesi et al. Reference Kriesi, Grande, Dolezal, Helbling, Höglinger, Hutter and Wüest2012). Less attention has been paid to a corollary of this trend: the electoral decline of the center left. Across Europe, social democratic parties that once commanded over 40% of votes have collapsed to the low twenties, teens, or lower. We do three things to investigate these patterns. First, we describe the variations in support for social democrats over the last century in 31 countries. Second, we undertake a time-series cross-sectional analysis to identify some of the correlates of the electoral fortunes of social democrats. Third, we supplement this aggregate-level analysis by looking at individual-level support for social democratic parties between 2002 and 2016.
Our goal is not to provide a causal explanation of the rise and fall of social democracy. Rather, by introducing a new dataset of elections for 31 countries over 100 years, we provide descriptive evidence of a time-consistent relationship between two main factors, public-sector spending and industrial production, and votes for social democratic parties. Our findings suggest that most of the fall in support for social democrats is correlated with a decline in the number of industrial workers as well as a reduction in the propensity of these parties’ core supporters (industrial workers and public-sector employees) to vote for them.
Evolution of Social Democracy
There has been extensive work on the evolution of social democratic parties. For example, scholars have looked at their formation (e.g., Bartolini Reference Bartolini2000; Sassoon Reference Sassoon1996), the strategic challenge of appealing to the middle class while maintaining working-class support (e.g., Przeworski and Sprague Reference Przeworski and Sprague1986), the rise of a social dimension cross-cutting the traditional left–right (e.g., Kitschelt Reference Kitschelt1990), how electoral systems shape their behavior (e.g., Iversen and Soskice Reference Iversen and Soskice2006), and globalization (e.g., Boix Reference Boix1985;Garrett Reference Garrett1998). We include all of the factors discussed in this literature, and we complement them with a wide range of other variables including public spending, welfare spending, employment in industry, and electoral turnout.
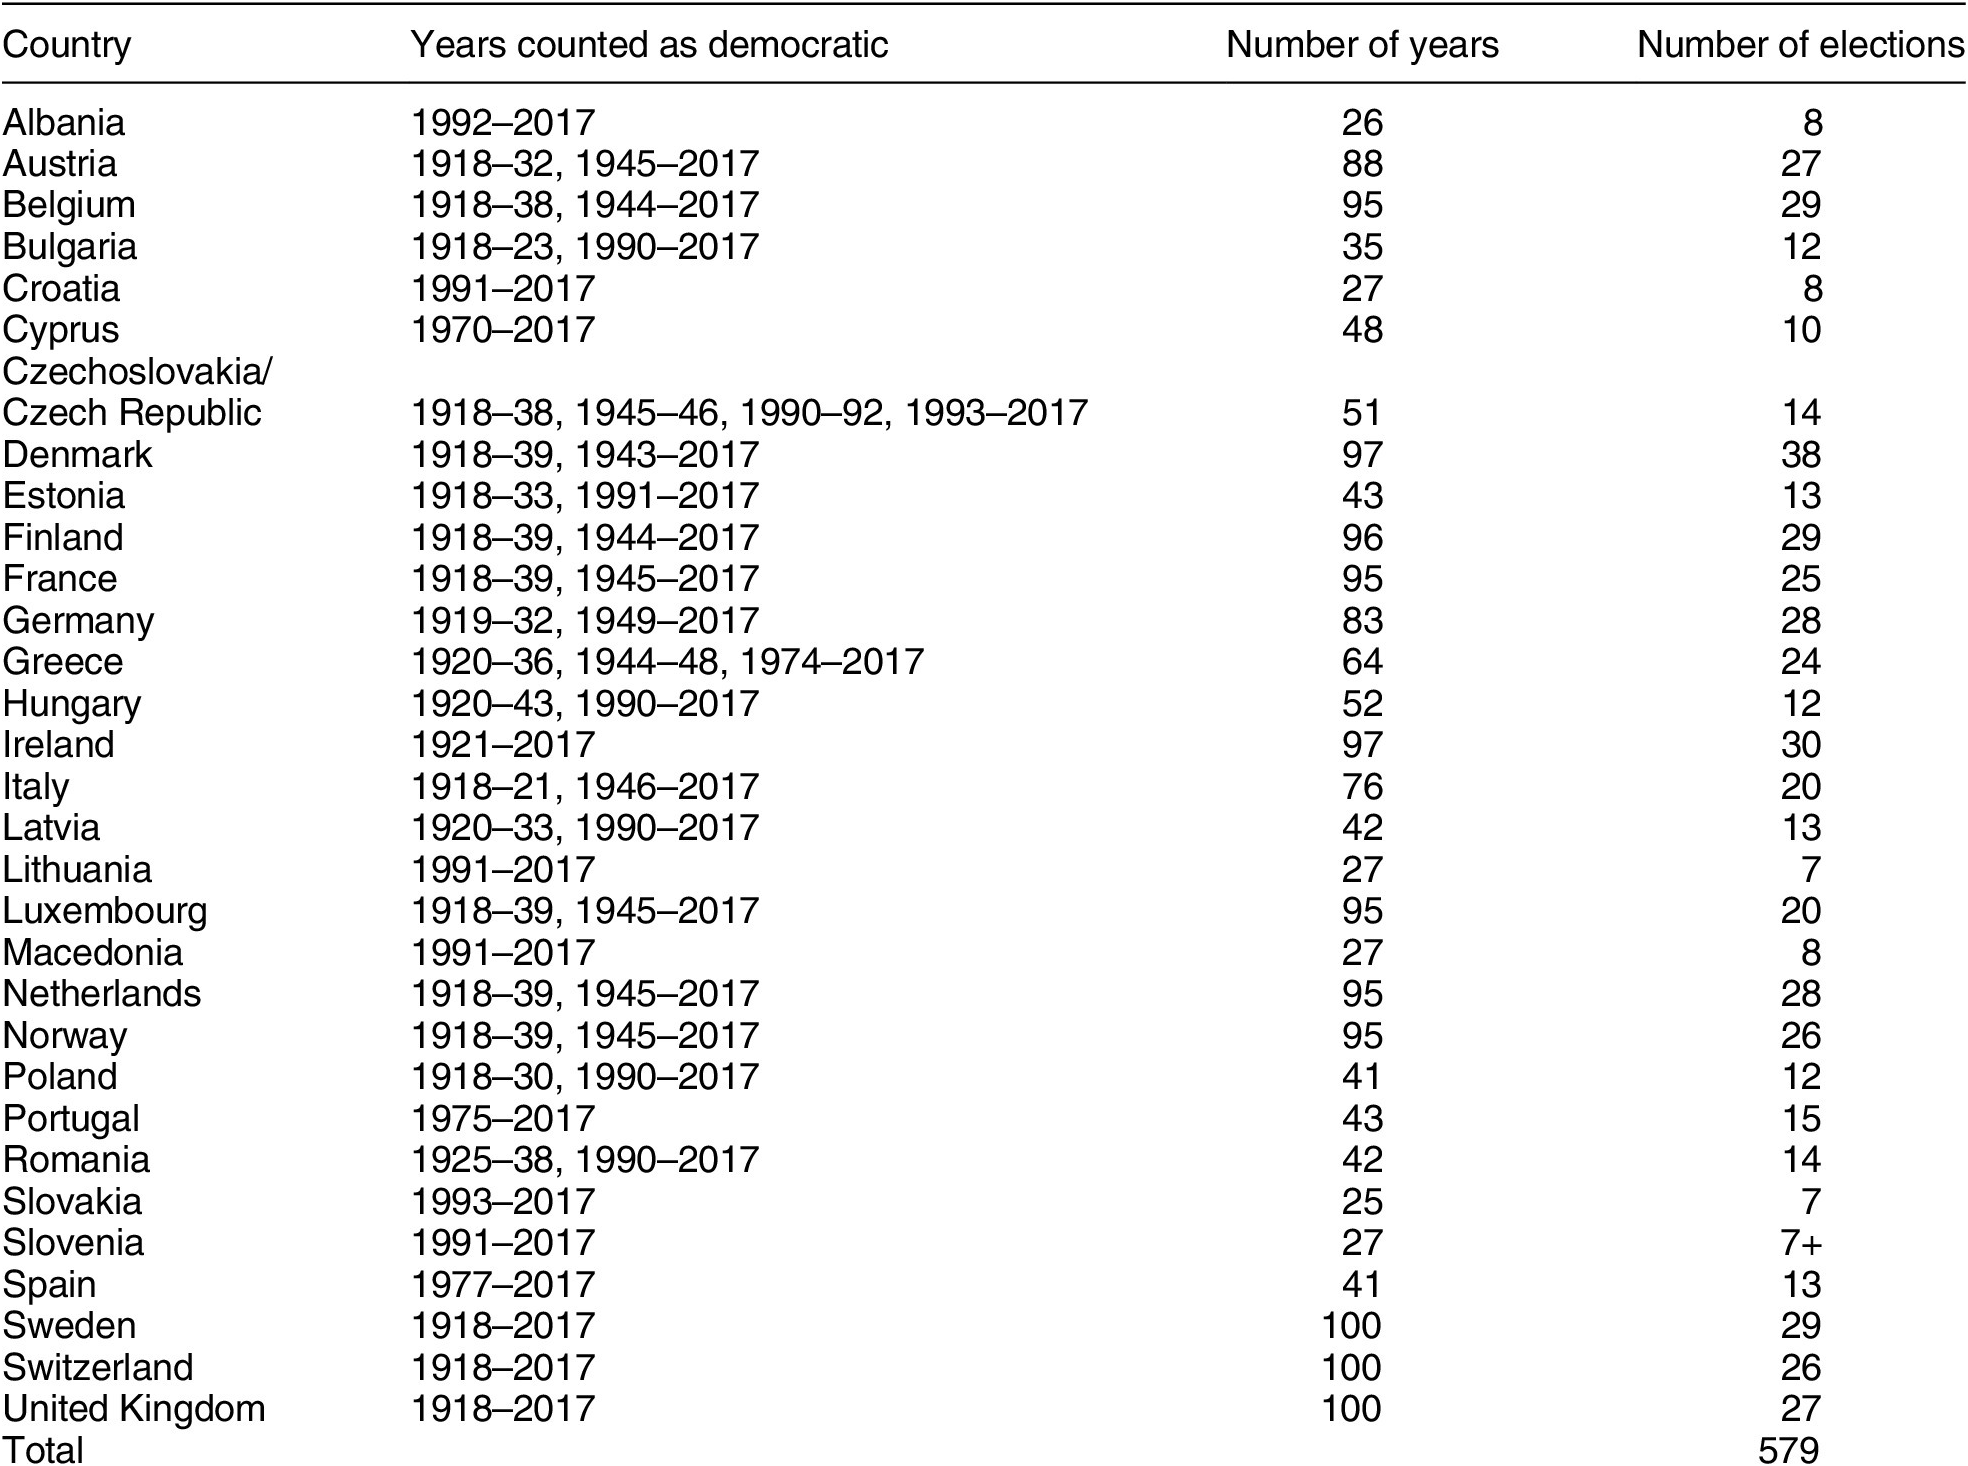
We analyze all of the democratic elections in Europe over 100 years, starting from 1918. Many European countries extended suffrage at the end of WWI. We define democratic elections as all elections that were held in a year when a country had either a Polity score or a Political Competition score greater than five.Footnote 1 We count countries that had populations larger than 500,000 in 2017 and who had democratic elections for at least one 20-year period. These criteria produce 579 elections in 31 countries, as Table 1 shows.
TABLE 1. Democratic Elections in Europe, 1918–2017
Which parties do we count as social democratic? Usually, only one party was a member of the Socialist International or Party of European Socialists at a particular time. For the cases where several parties were members of these organizations, we combined the vote shares for these parties—see Appendix Table A1. Parties with different ideological origins at different stages have been described as social democratic, such as the Italian Communist Party (PCI) since the late 1960s. We run two robustness tests to address this issue. First, we estimate the models with the vote share of all left parties as the dependent variable (social democratic, communist, and green). Second, because of the particular case of Italy, we estimate the models counting the PCI rather than the Italian Socialist Party (PSI) as the social democratic party in Italy from 1968 onwards, as after that year the PCI became more moderate, the PSI remained in government with the center right, and the PCI was the main opposition. We put together the data on vote shares from Nohlen and Stoever (Reference Nohlen and Stoever2010) and cross-checked the data with national electoral commissions where possible.
Figure 1 exemplifies the breadth of this dataset and shows three measures of social democratic parties’ electoral performance. Measured by the average vote share (percentage) across our countries in a given year, support for social democrats peaked in the 1950s. Measured by the total share of votes across Europe, support for these parties peaked in the late 1990s because of the high performance of social democrats in several larger countries (Germany, UK, and Italy). Measured by the total share of the electorate, support for social democrats declined in the late 1980s and fell precipitously in the 2000s (Figures A1–A2).

FIGURE 1. Three Measures of the Electoral Performance of Social Democratic Parties
One issue is that social democracy has meant different things in different periods. The main stages of the evolution of social democracy can be summarized as three “waves.” Figure 2 shows the periodization of these waves. Here, we coded each party by looking at their positions in manifestos (for the post-1945 period) as well as historical descriptions (for the pre-1945 period) (Bartolini Reference Bartolini2000; Jacobs Reference Jacobs1989; Sassoon Reference Sassoon1996; von Beyme Reference von Beyme1985). The first wave of a parliamentary road to socialism started after WWI, when most social democratic parties broke from revolutionary politics and attempted to achieve socialism via a parliamentary route, sometimes blending parliamentary and revolutionary objectives. With the rise of industrial society, many expected these parties to win electoral majorities (cf. Przeworski and Sprague Reference Przeworski and Sprague1986). Indeed, social democrats won over 30% of the vote in some of the first elections after WWI (in Germany and Austria). In the mid-1920s, the Swedish and Austrian parties exceeded 40%, while the Belgian party reached 39%. The 1920s and 1930s also saw brief periods in government for social democrats in Czechoslovakia, Germany, France, the UK, Denmark, Norway, and Sweden, most often in coalition with or tolerated by other parties. When in government, social-democrat-led reforms included maximum working hours, paid annual leave, collective bargaining, and pensions systems. But, in this period, not all workers supported socialist parties, as some supported Catholic or communist parties. Meanwhile, the social democrat electorate also included agricultural workers and some middle-class supporters (Lipset Reference Lipset1983; Neisse Reference Neisse1930). These early successes ended with the Great Depression. Democracy collapsed in most of Central and Eastern Europe while support for social democrats fell in Western Europe. There were some exceptions, as social democrats achieved 38% in the UK, over 40% in Denmark, Sweden, Norway, and Finland, and a historic peak of 29% in Switzerland.
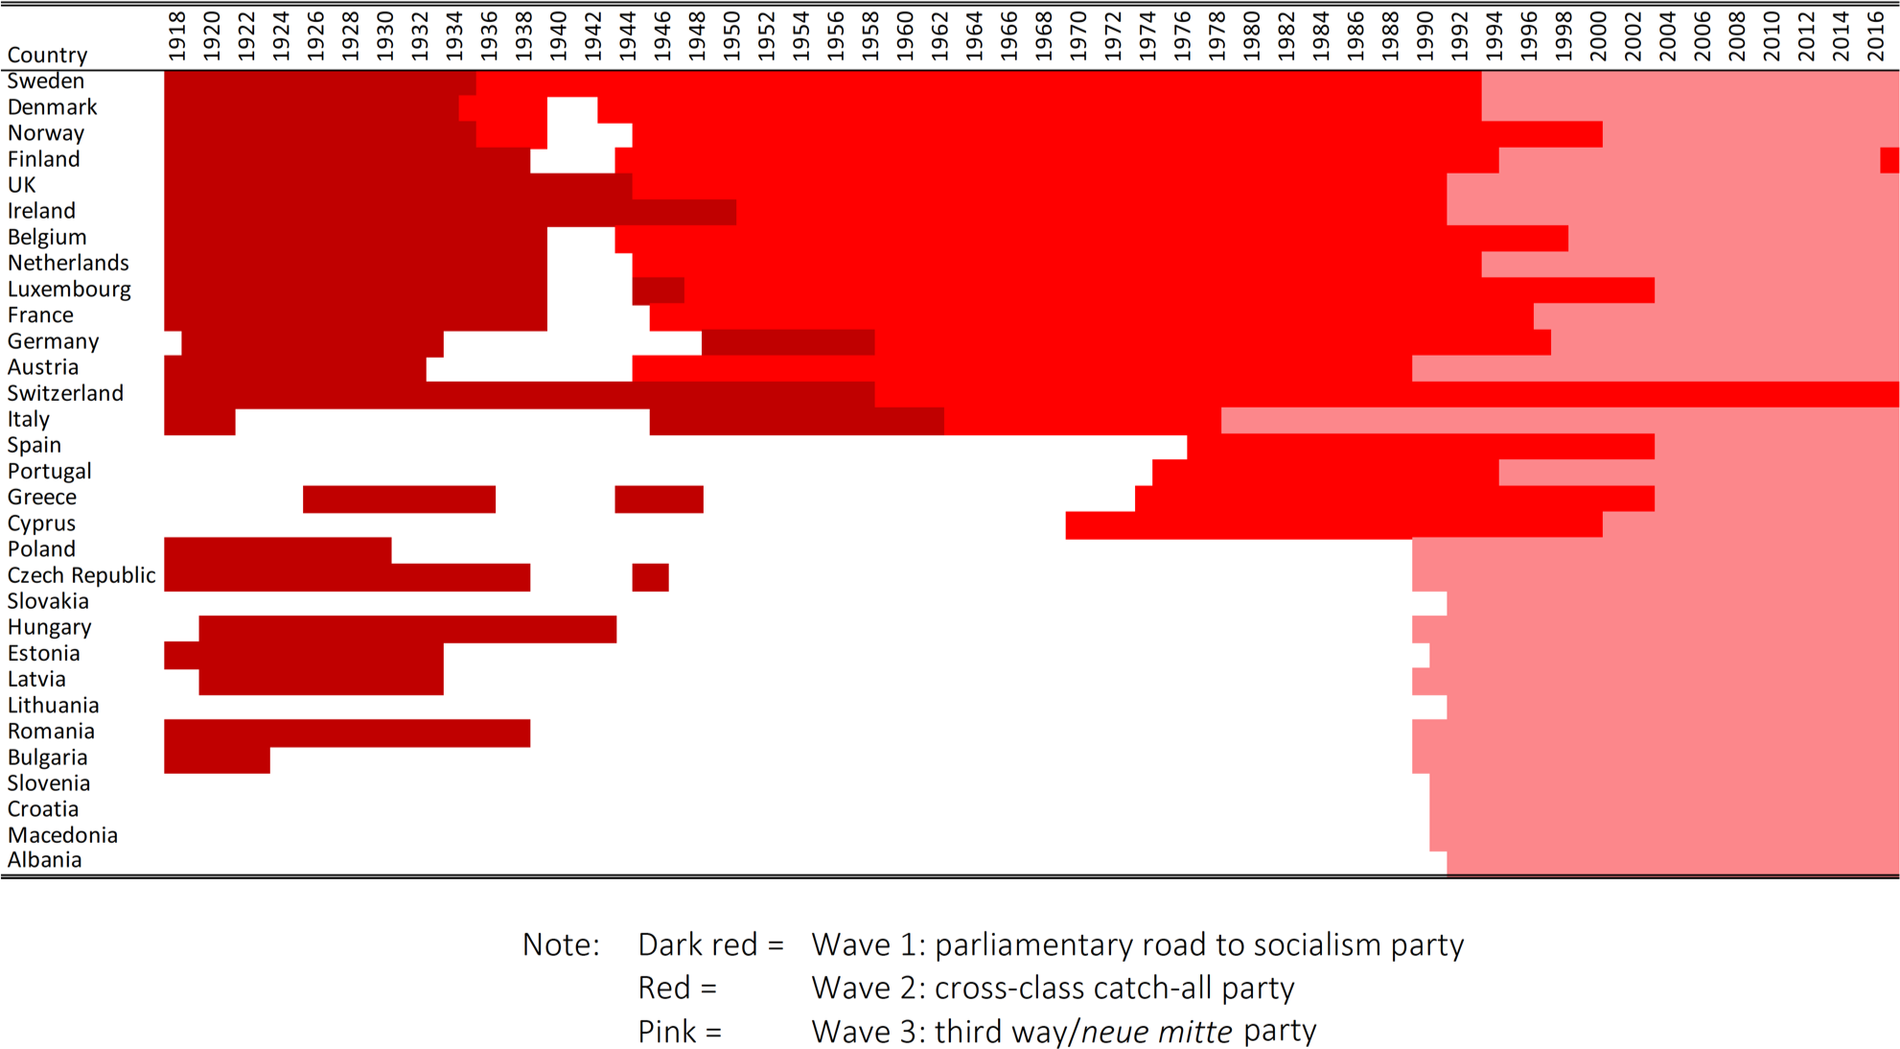
FIGURE 2. Three Waves of Social Democracy
The second wave of social democracy involved the transformation of the parties into mainstream electoral machines. After WWII, most social democratic parties attempted to reach beyond their traditional working-class base (e.g., Kirchheimer Reference Kirchheimer, Weiner and LaPalombara1966), accepting that social-democrat-voting industrial workers were unlikely to generate a majority (Sassoon Reference Sassoon1996, 42). This new strategy started in Scandinavia in the 1930s, and it then spread to social democratic parties in the UK, France, Austria, Belgium, and the Netherlands in the 1940s and to Germany, Italy, and Switzerland in the 1950s. These “catch-all” parties downgraded class-based politics in favor of policies that appealed to public-sector employees, urban professionals, and agricultural laborers. Many social democrats focused on establishing a social market (an objective shared with Christian democrats), building a welfare state, nationalizing natural monopolies, macroeconomic demand management, and in later years, liberal social policies on divorce and gender equality. Universal welfare policies also shifted the preferences of sections of the middle class as well as center right parties (e.g., Gingrich and Häusermann Reference Gingrich and Häusermann2015). These shifts enabled social democrats to form governments with liberals and Christian democrats, and in the immediate postwar years, social democrats were in government almost everywhere and in single-party governments in the UK, Sweden, and Norway. Most social democratic parties saw their support peak in the 1960s and 1970s, although whether this success was a result of societal changes or moderating party positions cannot be identified with our data.
Following the 1970s oil crisis, changes in global trade patterns and rising unemployment and inflation, market liberalization, and monetarist economics gained momentum, while green movements also squeezed support. European integration, globalization, and the collapse of communism facilitated a renewal of social democracy (e.g., Boix Reference Boix1985; Garrett Reference Garrett1998). A third wave of social democracy emerged around the idea of a third way or new middle (neue mitte), which emphasized regulating markets, supply-side economic management, balanced budgets, and social liberalism and environmentalism (e.g., Giddens Reference Giddens1998). By 1998, social democrats were back in office in every Western European country except Spain, Norway, and Ireland; governing alone in the UK, Portugal, Sweden, and Greece, leading coalitions in Germany, Italy, Denmark, the Netherlands, and France, and serving in grand coalitions with the center right in Austria, Belgium, Finland, and Switzerland. Also, in Central and Eastern Europe, former communist leaders used third-way social democracy to distance themselves from the past, and they emerged as electoral winners except in Estonia, Latvia, Slovenia, and Slovakia.
But, starting in the early 2000s, social democrat support collapsed almost everywhere. Between 2000 and 2017, most social democratic parties secured the lowest levels of support that they had had since 1918 (or 1945 for the postwar democracies and 1989 for the new democracies in Central and Eastern Europe).Footnote 2
This suggests that different factors shaped the success of social democratic parties in different periods. In the interwar period, the parties that emerged from industrial labor became more moderate in the postwar period as they expanded support to public-sector workers, and they then adapted their positions following globalization in the 1970s and faced new challenges following the fall of the Berlin Wall in 1989 and the Great Recession in the 2000s. To investigate this story, we look at each of these periods in turn. Empirically, this periodization also fits the availability of data for some key variables. For the interwar period, we found data on manufacturing and public spending, but data on party positions are not available until after WWII and data on employment in industry and globalization only start in the 1970s. In the empirical analysis, we test that our results are not driven by the choice of our periodization by estimating the models starting five years before and after our cutoff years.
Correlates of Electoral Support for Social Democratic Parties
To understand what factors correlate with these cross-country and cross-time variations we collected a wide range of institutional, economic, social, and political variables. The Appendix contains a full list of variables.
We estimate two different types of time-series cross-sectional models:
 $$ \kern6.50em {V}_{it}=\upalpha +\upbeta {W}_{it}+\upphi {X}_{it}+{\upgamma}_i+{\uptheta}_t+{\upepsilon}_{it}\kern7.00em (1) $$
 $$ \kern6.00em {\displaystyle \begin{array}{ccc}\Delta {V}_{it}=\upalpha +\upbeta \Delta {W}_{it}+\upphi \Delta {X}_{it}+{\gamma}_i+{\uptheta}_t+{\upepsilon}_{it.}& & \kern4.50em (2)\end{array}} $$
 Model 1 uncovers long-term changes in the levels of support for social democratic parties, while model 2 (a first-differences model) examines short-term changes between elections. In the equations, V is a social democratic party percentage of vote share in country i at time (election) t,  $$ \upalpha $$ is a constant, W is a vector of independent variables, X is a vector of control variables,
  $$ \upgamma $$ represents country-fixed effects,
  $$ \uptheta $$ represents decade-fixed effects and country-specific time trends,
  $$ \upbeta $$ and
  $$ \upphi $$ are the parameters to be estimated, and
  $$ \upepsilon $$ is the error term. We estimate equation 1 and equation 2 using ordinary least squares. This historical longitudinal cross-sectional analysis allows us to tackle such a large and important question. However, it poses a trade-off. Although conditional on a large set of controls and fixed effects, our exercise remains descriptive because this type of time-series analysis poses several empirical challenges such as omitted variable bias, unit roots, and interferences with time trends. We address some of these issues later.
As a start, Figure 3 plots two main independent variables (for 18 Western European democracies): public spending as a percentage of GDP and several measures of the size of industry/manufacturing. Public spending increased steadily from the 1920s to the 2000s, consistent with Wagner’s (Reference Wagner1890) law on developed economies that embark on social progress.Footnote 3 Industrial production rose until the 1970s and then declined dramatically as a result of structural changes, globalization, and technology.

FIGURE 3. Public Spending and Industrial Production in Western Europe
To investigate these relationships further, Table 2 presents the correlates of social democratic party vote shares between 1918 and 1939 for the 16 countries that held democratic elections in this period and with the limited set of available variables. Trade in manufactured goods in this early period is strongly correlated with votes for social democratic parties. We do not find evidence that public spending was related to support for social democrats in this period. Together, these findings are consistent with the description of wave 1 social democratic parties that based their support on industrial labor. Third, when these parties made it into government, they generally lost support, whether as a single party of government or as a senior or junior coalition partner. This result is consistent for all of the periods that we examine.
TABLE 2. Correlates of Social Democracy Party Vote Shares, 1918–1939
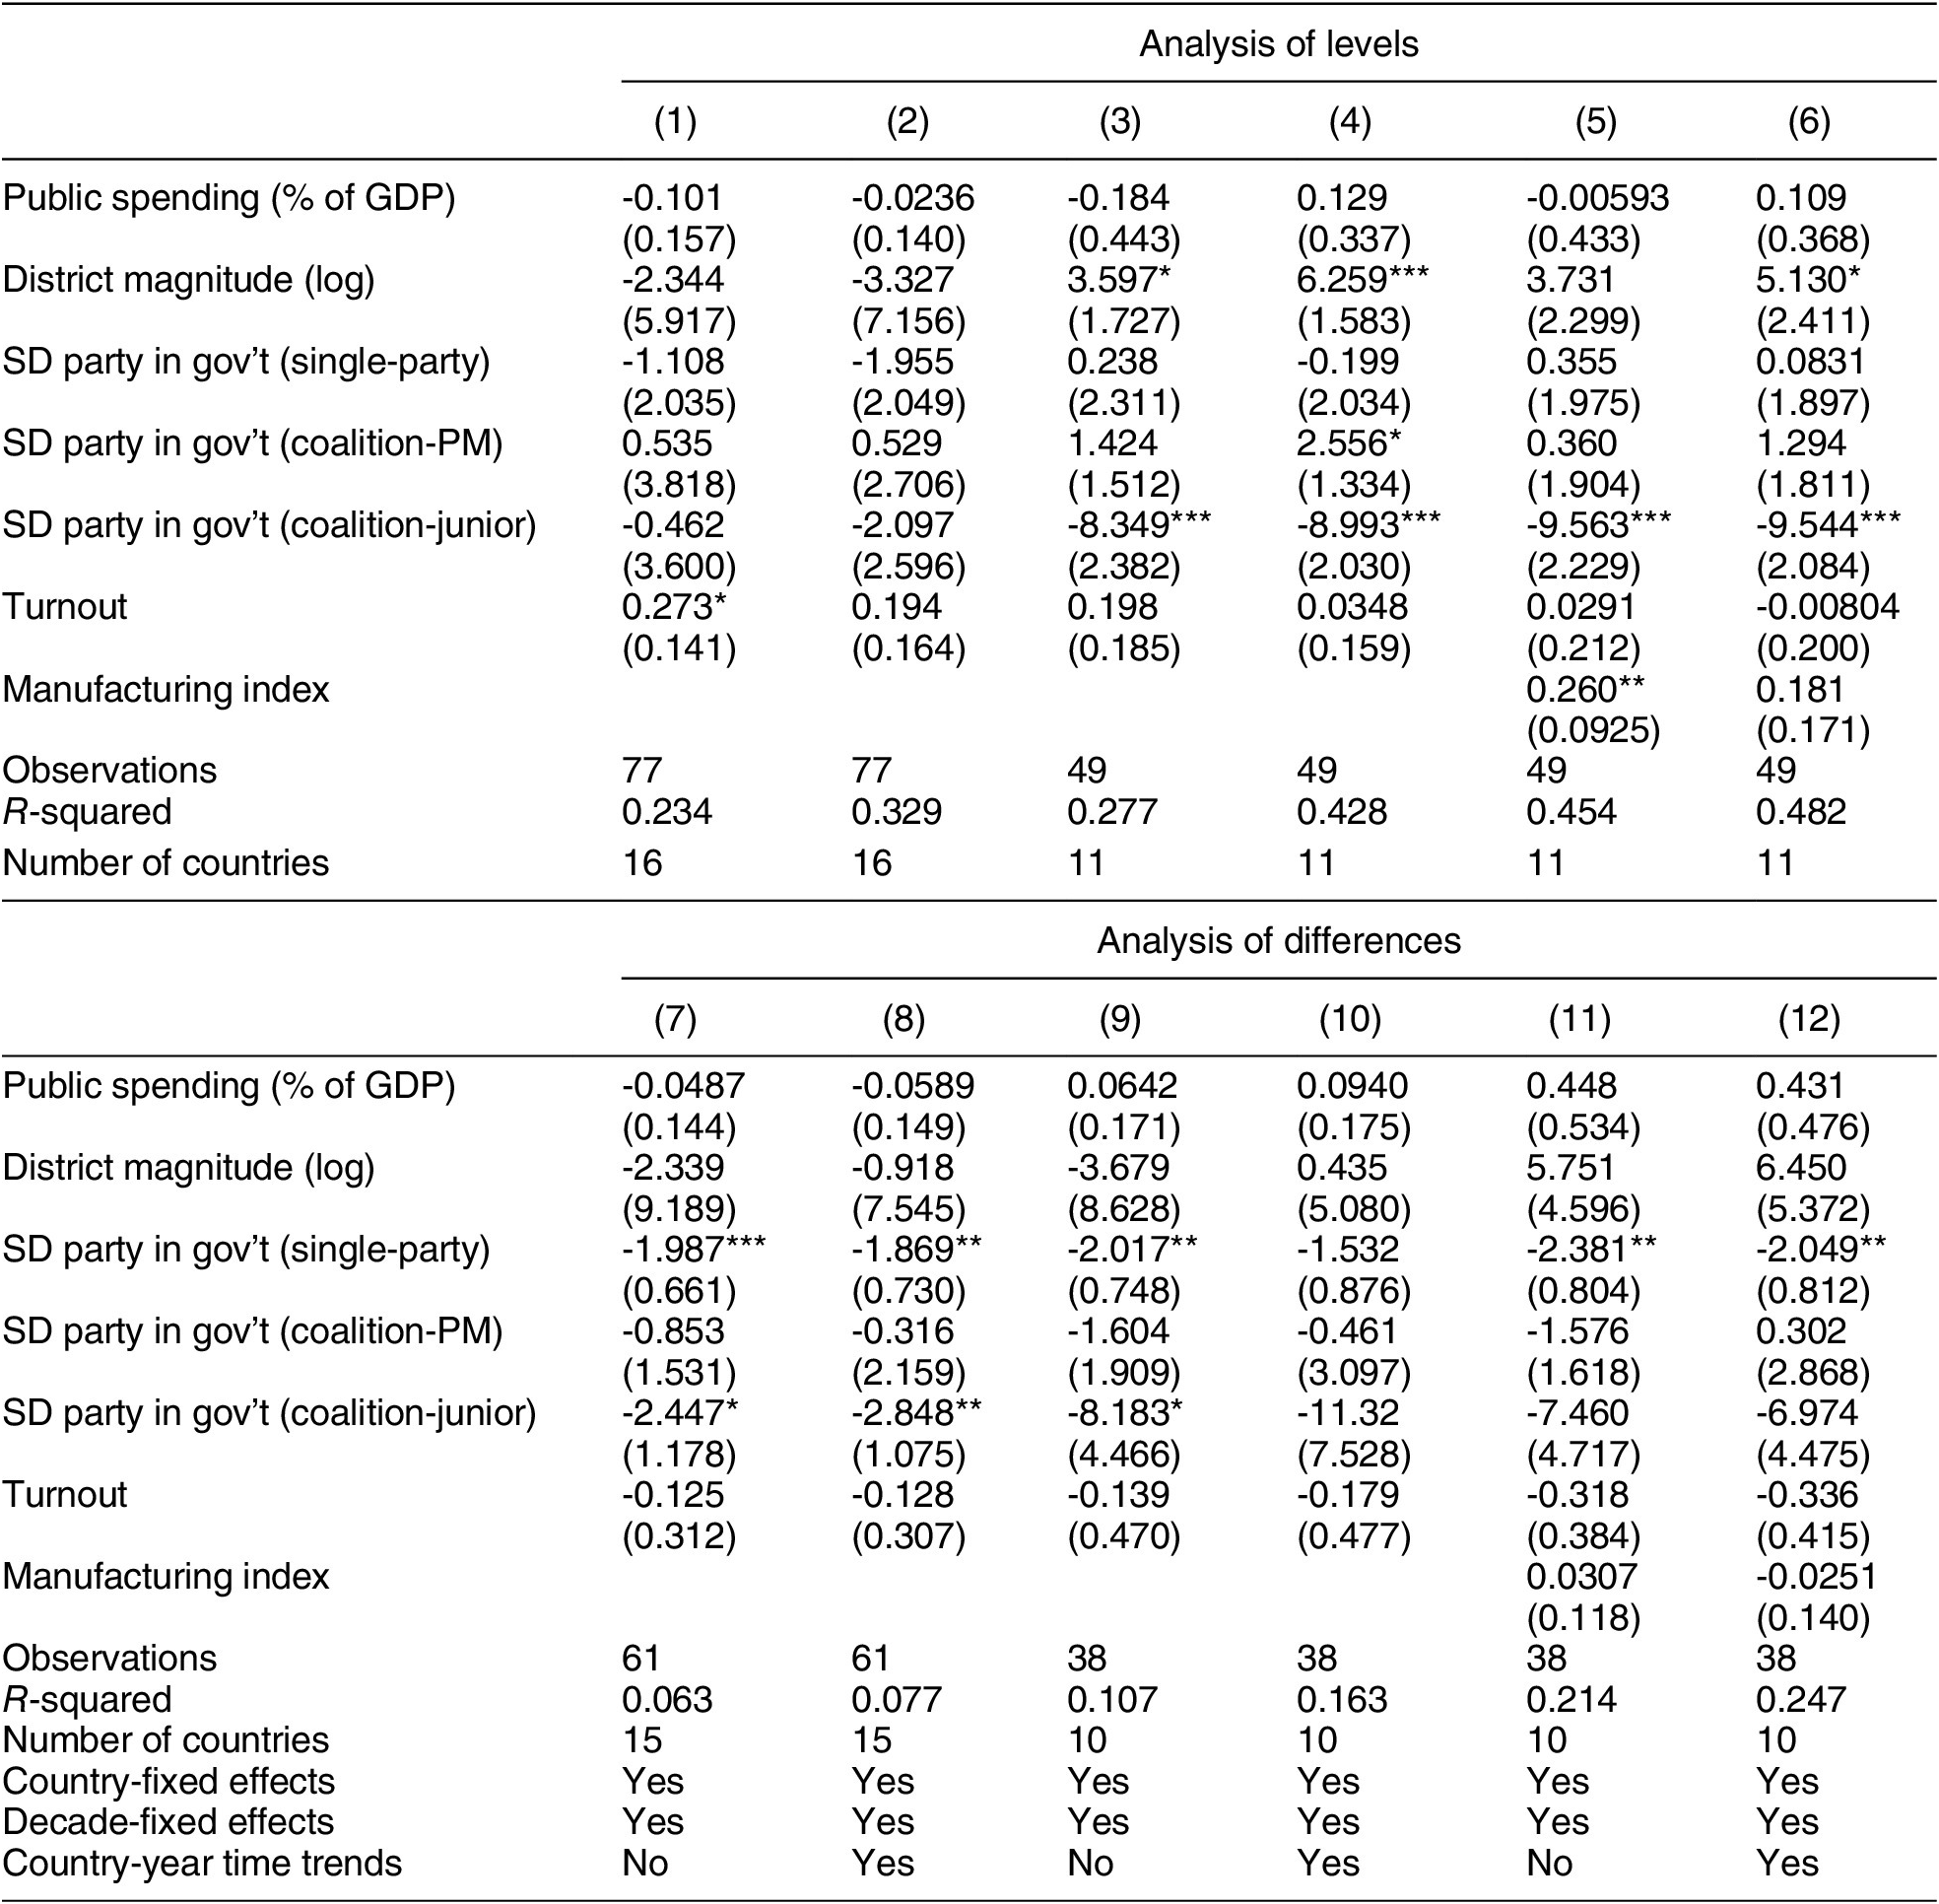
Note: Dependent variable: social democratic party vote share. SD: Social Democratic; gov’t: government; PM: prime minister. Models 1 to 6 estimate the effects on the overall level of support for social democratic parties. Models 7 to 12 estimate changes in support between elections (first differences). From Model 3, the sample is composed by the subset of countries for which the manufacturing index is available. The manufacturing index was available for Austria, Belgium, Denmark, Finland, France, Germany, Italy, the Netherlands, Norway, Sweden, and the United Kingdom.
Table 3 presents the correlates of social democratic party vote shares between 1945 and 2017. Because of data availability we add several economic control variables as well as some key political variables, in particular the left–right locations of social democratic and center right parties (from party manifestos), as well as the interaction of left–right party positions and the electoral system. We include the policy positions of center right parties because these were the main competitors for social democratic parties in most countries. We accept that the positions of other parties are also relevant, particularly for the decline of social democratic parties in more recent periods.
TABLE 3. Correlates of Social Democratic Party Vote Shares, 1945–2017

Note: Dependent variable: social democratic party vote share. Models 1 and 2 estimate effects on the overall level of support for social democratic parties. SD: Social Democratic; gov’t: government. Models 3 and 4 estimate changes in support between elections (first differences). Controls: GDP per capita (log), GDP growth, EU member, Eurozone member, presidential system. Full results in Appendix Table A3.
Several results are worth highlighting. First, public spending after 1945 is positively related to support for social democratic parties, and this result holds both for the long-term trends and for short-term (between election) changes. The effect is sizeable too: a one standard deviation increase in public spending is associated with an increase of about 1.5% in vote share for social democratic parties. What we do not know from this result, though, is whether more public spending leads to more support for social democrats or whether a larger public sector means more workers with an interest in voting social democrat.Footnote 4
Second, regarding party positions, we find evidence that social democratic parties gained votes when they moved to the center (closer to the median voter) and lost votes when they moved to the left. We do not find an effect of the left–right position of the main center right competitor on social democratic support. We replicated this analysis breaking the left–right down into separate economic and social dimensions—see Appendix Table A6—and we found that social democratic parties won more votes when they were more free market on the economic dimension but more conservative on the social dimension. These results challenge some existing research, for example, that there is little evidence of the link between parties’ positions and their electoral performance (e.g., Adams Reference Adams2012) and Kitschelt ’s (Reference Kitschelt1990) contention that social democrats should gain support as they become left-libertarian. However, further investigation reveals that this result on the social dimension is mainly driven by parties in Central and Eastern Europe (after 1989), where several parties, in Romania and Slovakia for example, became socially conservative from the early 2000s and gained votes at the expense of more liberal-cosmopolitan parties. In contrast, there is little evidence in Western Europe of a connection between social democratic parties’ positions on a social dimension and their electoral performance.
We also find that the electoral effect of social democratic parties’ positions is magnified by the electoral system. We find an interaction between the electoral system and the left–right position of a party such that the larger the district magnitude, the lower the support for a social democratic party as the party moves rightwards. Intuitively, this is consistent with existing theory (e.g., Iversen and Soskice Reference Iversen and Soskice2006; Przeworski and Sprague Reference Przeworski and Sprague1986), which highlights the threat of being outflanked by more left-wing parties in countries with proportional electoral systems. So, in higher district magnitude (proportional) electoral systems, social democratic parties lost support as they become more centrist, whereas in lower magnitude (majoritarian) systems, they gained support as they moved towards the median voter.
Table 4 presents the results for the era of globalization, after 1975. Data availability enables us to add a number of new control variables. In particular, we include a globalization index, which combined 43 economic, social, and political variables such as net and total trade volume, net immigration and total foreign-born population, technological integration, and so on (Dreher Reference Dreher2006; Gygli et al. Reference Gygli, Haelg, Potrafke and Sturm2019). We also now include welfare spending as a percentage of GDP. This allows us to look at public spending on redistribution as opposed to total public spending, which also includes public employment. As before, we find a statistically significant correlation between public spending and social democratic support. In addition, we find that the magnitude of the relationship between public spending on welfare and social democratic support is over twice the size of the magnitude of the relationship between total public spending and social democratic vote shares. This suggests that social democrats benefitted from both more public-sector employment and greater wealth redistribution.
TABLE 4. Correlates of Social Democratic Votes in the Era of Globalization, 1975–2017

Note: Dependent variable: social democratic party vote share; SD: Social Democratic. Models 1 to 4 estimate effects on the overall level of support for social democratic parties. Models 5 to 8 estimate changes in support between elections (first differences). Controls: union density, district magnitude, employment in agriculture, women in work, urban population, life expectancy, population (log), population aged 65 and over, population aged 0 to 14, percentage in higher education. Full results in Appendix Table A4.
Another key result is the relationship between employment in industry and support for social democrats. Again, the results lend support for the proposition that industrial workers have been their core supporters and hence that the decline in industry since the 1970s is one of the key reasons for the long-term decline in their support. We find little evidence that short-term changes in industrial employment affect social democratic support. We also do not find a relationship between globalization and support for social democrats. But, we do find a negative relationship between union density and social democratic support, which runs counter to some existing views about the power of unions and support for wealth redistribution (e.g., Crouch Reference Crouch2017).
Table 5 shows the results for 1989 to 2017, for the post-Cold War period (1989–2017) and the Euro Era and Great Recession (2000–2017). Again, the public-spending variables are significant, although this time only the welfare-spending variable is significant in all specifications. In addition, employment in industry is only significant for 1989–2000, not for 2000–2017. This suggests that after the 2008 financial crises, industrial workers had not only declined in numbers but also were now less likely to support social democrats.
Table 5. Correlates of Social Democratic Votes after the Cold War and the Great Recession

Note: Dependent variable: social democratic party vote share; SD: Social Democratic. Columns 1 to 8 estimate effects on the overall level of support for social democratic parties. Columns 9 to 16 estimate changes in support between elections (first differences). Controls: employment in agriculture, district magnitude, women in work, urban population, population (log), population aged 65 and over, population aged 0 to 14, union density, percentage in higher education. Full results in Appendix Table A5.
Robustness tests: We undertake three robustness tests. First, to test whether our results depend on our definition of social democratic parties, we estimate the models with three alternative dependent variables: (1) our social democratic vote share variable, but counting the Italian Communist Party (PCI) as the social democratic party in Italy from 1968 onwards (instead of the PSI); (2) total left vote share, of all votes for social democrats, radical left, and other left parties; and (3) center right vote share, of votes for the mainstream center right parties in each country. The results (in Appendix Tables A8 and A9) reveal that the existing correlation between public spending and social democratic votes is even stronger for the 1945–2017 period when counting the PCI rather than the PSI. We also find that the key relationships we uncover only hold consistently for social democratic parties but not for all votes for left parties. Similarly, employment in industry is unrelated to support for the center right. In short, only support for social democratic parties seems closely linked to the size of the manufacturing and public sectors.
Second, to explore the heterogeneity of the effect, we break down the analysis by region. Figure A3 in the Appendix shows the pattern of support for social democratic parties in Northwestern Europe, Scandinavia, Southern Europe, and Central and Eastern Europe. These figures show heterogeneity across and within regions, although Northwestern Europe, Scandinavia, and Southern Europe all show a clear “rise and fall” pattern. We also estimate the models separately for the 18 Western European and 13 Central and Eastern European cases (in Table A10 in the Appendix) and for Southern Europe, Scandinavia, and the rest of Western Europe (in Table A11). The effect of public spending holds for Western Europe and Southern Europe, but when broken down to the smaller number of cases (in A11), the lack of power reduces the significance.
Third, given our attempt to trace the arc of social democracy over a century, issues of periodizations are crucial. To test whether our results are driven by our choice of periods, we undertake a sensitivity analysis by randomizing when we stop and start the periods we analyze: starting in 1950 rather than 1945; in 1970 or 1980 rather than 1975; and in 1985, 1995, or 2005 instead of 2000, or 1989, or 2000. The results of this analysis (in Appendix A12, A13, and A14) suggest that our choice of periods in the main analysis has no effect on our main results.
Who Votes for Social Democratic Parties?
The results from this aggregate analysis can only be suggestive of particular relationships between individual voters and social democratic parties. For the most recent period, though, we can see whether the aggregate patterns can be observed at the individual level, using the European Social Survey (ESS). The eight ESS waves, from 2002 to 2016, cover the period of the Great Recession (2007–10), the refugee crisis (2015–16), and the decline in support for social democratic parties. Fourteen countries in our aggregate data are included in all ESS waves: Belgium, Finland, France, Germany, Hungary, the Netherlands, Norway, Poland, Portugal, Slovenia, Spain, Sweden, Switzerland, and the United Kingdom.
Following the aggregate results, we focus on the propensity of someone in a manual job in industry (manufacturing, construction, or extraction) or who was a public-sector employee (health and social care, education, or public administration and defense) to vote for a social democratic party. To investigate whether social democratic parties are attracting new professionals, as Kitschelt (Reference Kitschelt1990) and others have suggested, we also include a measure of whether someone is a sociocultural professional (legal services, the media, the creative industries, and universities) (Oesch Reference Oesch2006). We estimate a linear probability model for each wave separately, with country-fixed effects, and we control for a person’s gender, whether they live in a city or town, and their age.
The results are summarized in the lower panel of Figure 4 (see Appendix Table A15). The upper panel shows the average percentage of employment in manufacturing and the public sector in the 14 countries at the time of each ESS wave, using Eurostat data. Together, these data reveal a particular perspective on the decline of the social democratic electoral coalition. First, while employment in the public sector has remained stable, employment in industry declined by almost 20% in just 12 years (from 24.4% to 21.1% of the workforce). Second, there has been a decline in support for social democratic parties among industrial workers and public-sector employees, although public-sector employees remain more likely to vote social democrat than industrial workers do. In addition, support for social democrats among sociocultural professionals has remained stable. This concurs with Abou-Chadi and Wagner (Reference Abou-Chadi and Wagner2019), that social democrats can lose votes if their policies are opposed by (public-sector) trade unions, as well as Piketty’s (Reference Piketty2018) view that social democrats now mainly rely on the support of “Brahmins,” who in our measures are public-sector employees and sociocultural professionals.

Figure 4. Industrial Workers, Public-Sector Employees, and Socio-Cultural Professionals and Social Democratic Voting
In short, in the most recent period, social democratic parties have been hit by a triple effect: (1) there has been a decline in the size of one of the main groups that have traditionally supported social democrats (industrial workers), (2) there has been a decline in the propensity of their core supporters (industrial workers and public-sector employees) to vote for them, and (3) these losses have not been compensated by gains in support among the newer professional classes.
Conclusion
The story of the electoral performance of social democracy over the past century is the story of the rise and fall of a particular electoral coalition. Social democratic parties grew after 1918 to represent the industrial working class. The primary goal of these parties was to win an electoral majority and to transform capitalism. This strategy was limited by the size of this social group and the fact that not all workers supported socialism. Only after social democratic parties moderated their policies (moved closer to the median voter) could the electoral coalition be broadened. By adding another group (public-sector workers) to the coalition, social democratic parties started to win between one-third and one-half of all votes in many countries. This new coalition established social democrats as one of the main electoral forces in European politics since 1945—on the back of growing public-sector employment. From the 1950s to the 1990s, social democracy sought to manage or moderate capitalism mainly via increasing public spending. Yet, this coalition unraveled in the 2000s. Globalization and technological change meant that one pillar of this coalition, industrial workers, was now a relatively small group in most countries. Also, as social democratic parties tried to appeal to younger, urban professionals, many industrial workers increasingly supported other parties (such as the populist right or radical left). This left social democrats relying increasingly on public-sector employees. But, with the growing constraints on public spending after the Great Recession, this was no longer a winning strategy. Can social democratic parties build a new electoral coalition? We leave this to others to answer and hope our results and our dataset encourage new research in this area.
Supplementary Materials
To view supplementary material for this article, please visit http://dx.doi.org/10.1017/S0003055420000234.
Replication material can be found on Dataverse at: https://doi.org/10.7910/DVN/WTYLTK.


Comments
No Comments have been published for this article.