


Introduction
Government programs that look good on paper often fail on the ground because of poor implementation by local bureaucrats (Lipsky Reference Lipsky1980; Pressman and Wildavsky Reference Pressman and Wildavsky1984). What explains this chronic failure? Prominent explanations emphasize rent-seeking by bureaucrats (Banerjee, Duflo, and Glennerster Reference Banerjee, Duflo and Glennerster2008; Niskanen Reference Niskanen1971; Shleifer and Vishny Reference Shleifer and Vishny1993). Others point to capture of the bureaucracy by special interest groups seeking to advance their private goals (see e.g., Brierley Reference Brierley2020; Evans Reference Evans2012; Migdal Reference Migdal1988).
This article documents a different pathology that we term bureaucratic overload: local bureaucrats are often heavily under-resourced relative to their responsibilities. We advance a two-step theory explaining why bureaucratic overload is detrimental to local state capacity, defined in terms of the organizational capacity of local bureaucracy to successfully implement government programsFootnote 1 as well as why politicians fail to invest adequately in local bureaucratic resources in the first place, emphasizing a lack of electoral incentives.
Bureaucratic overload is detrimental to implementation, we argue, because it inhibits the ability of bureaucrats to divide and specialize in tasks, especially those of a managerial nature. For instance, when managers lack adequate staff and physical resources, they are forced to reallocate time to firefighting and dealing with various particularistic issues, crowding out managerial focus (for instance, time allocated to the planning of programs and coordination of implementation).Footnote 2 For this reason, a characteristic symptom of bureaucratic overload is “rationing” or the failure to implement programs on a scale sufficient to meet the demand for benefits among citizens despite statutory entitlements.
Why do politicians fail to invest adequately in local bureaucracy? While bureaucratic resources improve implementation, attributing this improvement to the actions of particular politicians and parties is difficult for voters. This is exacerbated in multilevel political systems characterized by high levels of decentralization of administrative authority, where multiple political agents, often belonging to rival parties, compete for the credit or attempt to shift blame (divided agency). The resulting absence of clarity of political responsibility for implementation weakens the electoral incentives of local politicians to engage in costly lobbying for additional local bureaucratic resources or for ruling parties to make costly fiscal investments in local bureaucratic resources. A testable sub-national implication of the theory is that bureaucratic resources should be under-provided to a greater extent in administrative units where responsibility is less clear, for instance due to greater division of agency.
To test the argument, we conduct a nationwide survey of Block Development Officers (BDOs), rural development officials responsible the local implementation of development programs across administrative units in India known as rural development blocks (the median size of which is 150,000 residents). The survey reached 423 officials responsible for managing the implementation of development programs for roughly 66 million rural residents. The survey included a questionnaire, from which we constructed an index of local bureaucratic resources based on the number of full-time employees, contract employees, vehicles, and computers per 100,000 rural residents. It also included novel time-usage diaries that enumerators completed three times with each BDO to measure their behavior. In addition, enumerators conducted focus group discussions with BDOs in each of the districts where the surveys were conducted.
The empirical strategy proceeds in two steps. First, to test the impact of bureaucratic overload on implementation, we connect the survey data on bureaucratic resources to administrative data on India’s National Rural Employment Guarantee Act (NREGA), a large-scale program that guarantees every rural household up to 100 days of public works employment annually but is in practice characterized by extensive rationing due to the managerial complexity of planning and executing public works projects. We also collect administrative data on Swachh Bharat (SB), a less complex program that provides financial incentives to households to build toilets. Taking a fixed effects empirical strategy, which in our preferred specifications compares BDOs within the same district, we provide evidence that officials with fewer resources are worse at implementing rural development programs, especially those of a managerially complex nature. Drawing on behavioral data from the time-usage diaries, we provide evidence that this is likely because they are unable to focus on managerial tasks.
Next, we test the political determinants of bureaucratic overload. We exploit two sources of differences in clarity of responsibility across rural development blocks: (i) variation in the alignment of local legislators with state-level ruling parties and (ii) variation in the degree to which rural development blocks are represented by a single or multiple legislators. When a rural development block is represented by the same party locally and at the state level or by a single legislator, voters can more clearly attribute improvements in implementation to a single party or politician, improving electoral incentives to invest in bureaucratic resources. We provide quantitative evidence that bureaucratic resources tend to be greater in rural development blocks represented by aligned legislators as well as in blocks represented by a single legislator. A close-elections fuzzy regression discontinuity design, in which we instrument for the share of the population located in an aligned constituency with the narrow election of a ruling-party legislator in the constituency containing the block headquarters, suggests that the impact of party alignment on bureaucratic resources is especially large in close races, consistent with an electoral logic for making these investments.
The findings provide a micro-level perspective on the political economy and bureaucratic behavior underpinning weak local state capacity, the subject of comparative research that usually takes a more macro-historical approach. We concur with historical research that highlights the critical role that political investments in personnel and resources plays in state capacity (Acemoglu, Garcia-Jimeno, and Robinson Reference Acemoglu, Garcia-Jimeno and Robinson2015; Garfias Reference Garfias2018). Our findings suggest that one reason these resources are critical is that they facilitate the organizational division of labor and specialization in tasks that are critical for carrying out complex responsibilities. Macro-historical work suggests that state-builders make these investments as part of a process of war-making and internal consolidation of authority over rivals (see e.g., Ertman Reference Ertman1997; Geddes Reference Geddes1994; Tilly Reference Tilly, Evans, Rueschemeyer and Skocpol1985). Our findings provide an analogue for these dynamics in contemporary democratic settings: politicians possess stronger electoral incentives to invest in local bureaucracy when clarity of responsibility is high due to unified authority; conversely, they have weaker electoral incentives when agency is divided or fragmented.
The results also shed light on the puzzle of poor implementation and rationing under public programs (Lipsky Reference Lipsky1980). Important work suggests that programs are poorly implemented because of bureaucratic rent-seeking or capture of the bureaucracy by special interests. While rent-seeking and capture are undeniably important forces that can and do exist simultaneously with bureaucratic overload, we argue that quite often, independent of these factors, bureaucrats simply lack the resources needed to do their jobs effectively because of institutional and electoral conditions that discourage socially beneficial investments in local bureaucratic resources. Our findings link with work which suggests that clear oversight of bureaucrats by politicians (Gulzar and Pasquale Reference Gulzar and Pasquale2017; Raffler Reference Raffler2018; Williams Reference Williams2017), as well as managerial autonomy and organizational capacity (Mangla Reference Mangla2015; Pepinsky, Pierskalla, and Sacks Reference Pepinsky, Pierskalla and Sacks2017; Rasul and Rogger Reference Rasul and Rogger2017), are critical for bureaucratic performance.
The remainder of the article is structured as follows. We first develop the theoretical framework before describing the rural development official upon which we focus, presenting our empirical strategy, reporting results, and concluding.
Overloaded Bureaucrats
Poor implementation of public programs by local bureaucrats is a problem that spans rich and poor countries. In their classic study of implementation failure, Pressman and Wildavsky (Reference Pressman and Wildavsky1984) studied a federal program intended to provide $23 million worth of public works employment in Oakland, California; three years after the program had been initiated, just $3 million had actually been spent due to disarray in the municipal bureaucracy, despite widespread urban unemployment. A similar phenomenon is found in India, the setting of this study. Take the example of NREGA, one of the world’s largest social programs, which routinely fails to provide as much employment as is desired by rural citizens despite a formal guarantee of up to 100 days of public works employment to rural households annually as well as surplus budgeted funds that are left unspent every year (see e.g., Ravallion Reference Ravallion2019).Footnote 3
As these examples illustrate, one of the hallmarks of poor implementation is “rationing” or the failure to meet the demand for program benefits among citizens, despite statutory entitlements (Lipsky Reference Lipsky1980). We offer an explanation for poor implementation and rationing rooted in a lack of resources relative to the functional responsibilities of local bureaucracy, a phenomenon we term bureaucratic overload. Bureaucratic overload has organizational-behavioral consequences that make it difficult for bureaucrats to efficiently divide and specialize in tasks, weakening the organizational capacity of local bureaucracy to implement programs. Nonetheless, bureaucratic overload occurs, we argue, because politicians often lack the electoral incentives to invest in augmenting local bureaucratic resources.
We elaborate on the consequences and causes of bureaucratic overload in turn. All organizations, including the local bureaucracies which are tasked with the ground level implementation of government programs, benefit from economies of scale arising from the division of labor among multiple specialized employees (Smith Reference Smith1817; Williamson Reference Williamson1973). The division of labor between employees contributes to organizational efficiency by promoting learning by doing and functional specialization (Dewatripont, Jewitt, and Tirole Reference Dewatripont, Jewitt and Tirole2000; Rosen Reference Rosen1983). In large organizations with multiple employees that are responsible for working together to carry out complex responsibilities, the division of responsibilities between managers who specialize in coordination and workers who specialize in more specific tasks is especially critical for organizational performance (see e.g., Hart and Moore Reference Hart and Moore2005).
Yet the local bureaucrats who are tasked with the day-to-day implementation of government programs are often severely under-staffed and under-equipped relative to the number of programs they are expected to implement and the number of citizens they are expected to serve. This is especially, but not exclusively, true of developing countries, which tend to have much smaller public sectors (Besley and Persson Reference Besley and Persson2014). This is the case with India, the focus of this study, which is characterized by rampant under-staffing and vacancies across its frontline bureaucracy (Kapur Reference Kapur2020).
Under conditions of bureaucratic overload, instead of focusing on their coordinating role, managers spend more time firefighting and on various particularistic tasks, crowding out managerial focus. For instance, when bureaucratic officials lack adequate personnel, instead of focusing on the planning and execution of programs and delegating particularistic transactions like addressing the individualized issues of citizens to specialized employees, bureaucratic officials must pitch in on these tasks. A similar issue arises when there are not enough physical resources, for instance computers or vehicles, to divide tasks between multiple workers—managerial tasks are crowded out by other tasks that utilize the finite physical resources and tools that are available. An absence of managerial focus contributes, we argue, to the characteristic symptom of bureaucratic overload: the inability to execute projects and absorb funds, which results in rationing.
Given the deleterious consequences of bureaucratic overload for implementation, why do politicians fail to invest adequately in local bureaucratic resources? We build on an idea discussed by Wilson (Reference Wilson1991, 135). In his discussion of why fast food franchises are staffed to efficiently serve a large number of customers while local bureaucracies tend to be characterized by under-staffing and long queues, he traced the problem to electoral incentives: “if lines become shorter and clients become happier, no legislator will benefit.” While providing additional staff and equipment to local bureaucracy may generate socially beneficial improvements in the speed and quality of service delivery, these investments do not occur because the perceived link between these investments and electoral returns are weak.
An important reason that the electoral incentives of politicians to invest in local bureaucracy are weak, we argue, is an absence of clarity of political responsibility for implementation. In comparative politics, the concept of clarity of responsibility was developed to describe the extent to which outcomes can be attributed to the actions of specific political actors (Powell Reference Powell2000). While bureaucratic resources improve implementation, attributing this improvement to the actions of particular politicians and parties is difficult for voters, especially because implementation is a noisy function of bureaucratic capacity as well as many other factors.Footnote 4 It is especially difficult for voters to assign credit for improvements in bureaucratic resources and implementation to the responsible party in contexts of multi-level government combined with decentralization of authority (Bueno Reference Bueno2018; León Reference León2011; Powell Reference Powell2000; Tillin and Pereira Reference Tillin and Pereira2017), where rival parties and politicians may compete for the credit or shift blame (divided agency).
This political equivalent of the “team production” problem identified in the industrial organization literature—describing scenarios in which aggregate output but not individual action is observable to the principal (in this case, voters) in a context where many agents (in this case, politicians) play a role in production—weakens the electoral incentives of ruling parties and politicians to make costly investments in local bureaucracy in the first place (Holmstrom Reference Holmstrom1982). At the same time, ruling parties possess clear incentives to claim credit for the announcement of ambitious new programs, the implementation of which is subsequently delegated to local bureaucracy. The result is a gradual accumulation of local bureaucratic responsibilities without corresponding investments in resources, resulting in bureaucratic overload. We provide a simple diagram of our two-step theoretical framework about the causes and consequences of bureaucratic overload in Figure 1.
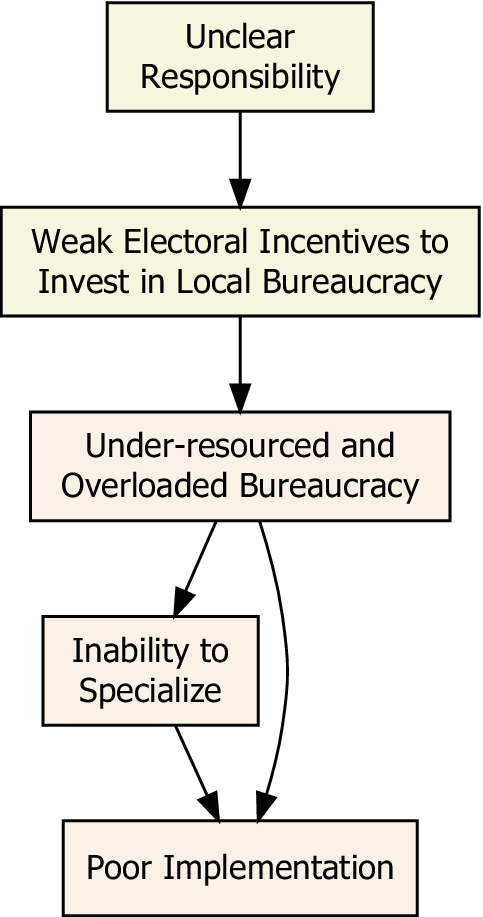
Figure 1. Theoretical Diagram
The intent of our argument is not to suggest that other explanations are not important or empirically salient but to highlight a different source of poor implementation that is not frequently theorized. Our argument differs from theories of bureaucratic rent-seeking, which suggest that self-interested bureaucrats extract rents under conditions of imperfect oversight.Footnote 5 While corruption and rent-seeking are undeniably important phenomena, bureaucratic overload is detrimental to implementation not because of malfeasance by bureaucrats but because of an absence of resources and organizational capacity to implement programs well, even if bureaucrats were hypothetically subject to perfect monitoring or are intrinsically motivated. Our argument also differs from theories of bureaucratic capture, which highlight inadequate autonomy from special interests as a major source of weak implementation.Footnote 6 While subversion of the bureaucracy for the private purposes of special interests is also undoubtedly important, our framework suggests that politicians and parties may under-invest in bureaucratic resources not in order to protect or advance a particular set of private interests but because of structurally unclear responsibility, which makes it difficult for any politician or party to internalize the electoral benefits of making socially beneficial investments in local bureaucracy.
Several empirical implications arise from the theoretical framework. First, holding other variables equal, variation in bureaucratic resources should predict the degree of bureaucratic specialization, especially with regard to managerial focus. Second, if local bureaucracies are overloaded, then fewer resources should result in worse implementation, especially increases in the extent of rationing. Third, if bureaucratic overload stems from a lack of adequate electoral incentives, the degree of bureaucratic overload should be greater in conditions which make responsibility less clear. These conditions include macro-structural institutional features that vary across countries. But these conditions also vary sub-nationally, for instance across administrative units characterized by more or less division of agency. We examine these implications in the context of rural development officials in India.
Rural Development Officials in India
We apply our theoretical framework to rural development officials in India known as Block Development Officers (BDOs). BDOs are state-level civil servants who serve as the managers of block development offices, frontline offices that are responsible for implementing development programs across administrative units known as rural development blocks. The median size of a rural development block is approximately 150,000 rural residents; five to ten rural development blocks typically comprise a single district, which is the rough administrative equivalent of an American county (but about 20 times the population in aggregate). BDOs are responsible for managing the employees who comprise a block development office and overseeing the local implementation of dozens of different rural development programs. BDOs therefore represent the key managerial agents in India’s local rural development bureaucracy as well as the “eye of the needle” through which most government programs must pass before they reach citizens on the ground.
To obtain fine-grained measures of local bureaucratic resources as well as behavior, we conducted a nationwide survey of BDOs. The key challenge was getting bureaucrats to complete detailed questionnaires and time-usage diaries. To address this, we conducted the survey in collaboration with the Lal Bahadur Shastri National Academy for Administration (LBSNAA), India’s apex training academy for its national civil service, the Indian Administrative Service (IAS). The survey was conducted by new IAS trainees who are placed temporarily in districts for a few months as part of their training. The survey encompassed both an in-person questionnaire and three over-the-phone time-usage diaries, which measured the daily behavior of BDOs. It also included focus group discussions with all the BDOs in the district, to solicit their open-ended feedback about the constraints they face in their work, including resources as well as other factors. In the analyses in this article, we connect information collected through the questionnaire and time-usage diaries to administrative data on the performance of rural development programs as well as geo-coded electoral data to study the determinants and consequences of variation in bureaucratic resources.
The survey sampled three rural development blocks at random across each of a nationally diverse sample of 160 districts.Footnote 7 By working with a training academy that is trusted by Indian bureaucrats, we were able to elicit a high degree of participation from BDOs in the survey, with 423 out of 480 or 88% of BDOs responding to the questionnaire. Of the BDOs who completed the questionnaire, 92% completed at least one time-usage diary (and 78% completed all three assigned time-usage diaries). The blocks reached during the survey represent approximately 6% of all the rural development blocks across India. While we did not control the districts in the sample, we controlled the random sampling of blocks within districts.Footnote 8Figure 2 displays a map of the coverage of the survey.
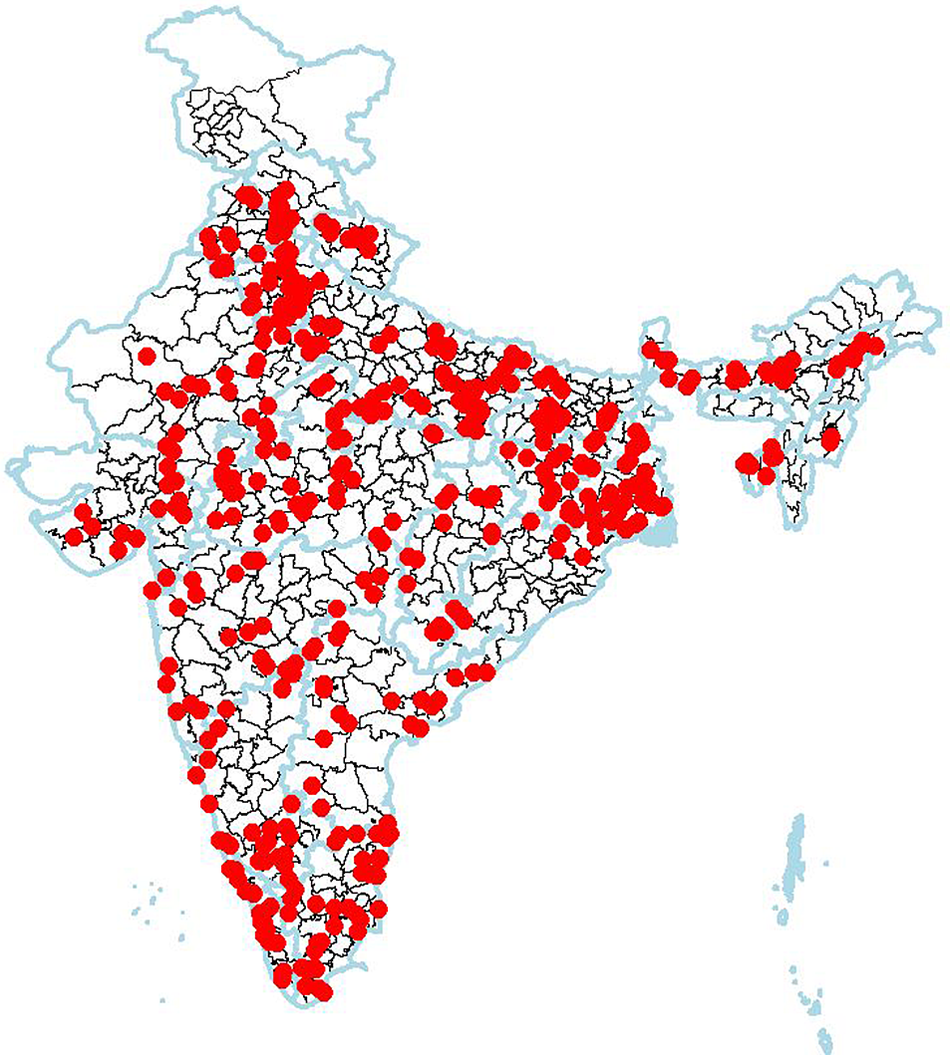
Figure 2. Rural Development Blocks in Survey
Overload among BDOs
BDOs epitomize the pathology of bureaucratic overload we describe. Though they are critical agents of rural development, they are typically over-burdened with responsibility for administering an ever-growing list of complex programs and tasks, relative to the scant personnel and physical resources with which they are provided. A major consequence of bureaucratic overload in rural India, we argue, is that because BDOs are under-resourced and short-staffed, instead of specializing in managerial tasks and delegating particularistic transactions like addressing the individualized requests and complaints of citizens to specialized employees, bureaucratic officials must pitch in on these tasks, reducing time spent on the planning and execution of programs and projects and contributing to the rationing problem that affects many major development and welfare programs.
We first illustrate these claims with data from the focus groups, which were successfully completed in 139 of the 160 districts in the sample. In the focus groups, BDOs were asked to provide open-ended responses to discussion prompts concerning different topics, including resources.Footnote 9 The enumerators took written notes which paraphrased the discussion, including selected quotations, and at the end of the discussion provided a quantitative score ranging between one and five summarizing the degree to which the BDOs expressed satisfaction with the resources they are provided with relative to the work they need to complete.Footnote 10
Figure 3 provides quantitative summaries of the focus group discussions, including a word cloud representing words proportionate in scale to their frequency in the focus group notes as well as the distribution of focus group scores.Footnote 11 As the focus group data indicate, a large share of BDOs report that an absence of adequate resources is a major barrier to carrying out their responsibilities effectively (with considerable variation across focus groups). As the word cloud indicates, the most frequently noted resource deficits across focus groups pertained to vehicles, computers, staff, office space, and the reliability of internet connections.

Figure 3. Focus Group Data: Discussion on Resources
A qualitative reading of the focus group notes also paints a picture of serious, but uneven, shortages of resources across rural development blocks. For example, the BDOs in one focus group reported that “more than 50%” of the posts in their offices were vacant, according to the enumerator. Another group of BDOs felt that they were provided with “less than half of the necessary physical and human resources.” According to the focus group notes, however, another group of BDOs felt “that physical resources like computers, office space, vehicles were enough. There was a shortage of manpower (vacancy of posts) which needs to be filled.” One BDO complained to the enumerator, “Sir, in my Block the generator does not function. Even the computers which are broken down are not repaired.” Another enumerator wrote of the focus group discussion, “One thing that clearly comes out is the severe shortage of manpower in all the Talukas [rural development blocks].”
Several focus groups suggested that inadequate resources make it difficult for BDOs to focus on managerial tasks in a context of pressure to deal with particularistic issues. For instance, according to the enumerator, one group of BDOs felt that “deficiency of staff makes it difficult to handle citizens/visitors.” In another focus group, the BDOs felt that the core responsibility of a BDO is “monitoring and supervising” but that “in the absence of resources both get hampered.” In another focus group, when asked to describe a comparable profession, one BDO described his role as comparable to that of a firefighter: “Few words which can describe the job of the BDO are: dynamic, diverse, and overburdened. . . . it is a combination of soldier and fire fighter. BDO . . . has to do a lot of fire-fighting every day, especially during grievance hour [the period during which citizens and politicians visit the office with complaints].” In a similar vein, the BDOs of another focus group felt that as a result of personnel shortages there was a “huge burden on a few employees.” The consequences for implementation are severe. According to the enumerator, one group of BDOs felt that “only 15–25%” of their responsibilities were successfully fulfilled because of inadequate resources.
Interestingly, many BDOs recognized a common source of overload: the failure of state governments to make investments in bureaucratic resources commensurate with the accumulating responsibilities of BDOs. One enumerator wrote of the discussion, “[The BDOs] feel that over a period of time the number of schemes have increased leaps and bounds. . . . However, the resources at the blocks have not kept pace with it.” Another focus group observed that their state “has not taken intake of clerical staff” in the last twenty years. Another focus group emphasized more recent dynamics, arguing that the state finance commission’s most recent recommendations for allocating resources to the rural development bureaucracy had been “extremely reduced” in recent years. Several focus groups also noted sharp disparities in resources available across rural development blocks within the same district. According to the enumerator, one group of BDOs felt that “there is a wide difference . . . with regard to the availability of resources. Some blocks are flushed [sic] with enough resources . . . while some of the far off blocks are having a hard time.”
Measurement
To measure bureaucratic resources, the questionnaire included questions about the number of active full-time employees (those recruited through civil service procedures), the number of active contract employees (lower-salary employees on short fixed term contracts without civil service protections), the number of functioning four-wheel vehicles (which are critical for mobility in a rural context), and the number of functioning computers (which are critical for entering data and operating program monitoring software) in each BDO’s office. We normalized these variables by the rural population to account for considerable variation across blocks in the size of the populations they serve and, therefore, the quantity of public services with which they are tasked with delivering. To combine the different resource variables into a single bureaucratic resources index, we conducted a principal components analysis on the four (standardized) items before combining them into a single index with weights based on the factor scores for each item (see e.g., Filmer and Pritchett Reference Filmer and Pritchett2001). This index was then normalized by its in-sample standard deviation across blocks so that in all statistical regression analyses the main coefficient of interest represents the effect of a one-standard-deviation improvement in the bureaucratic resource index. Table 1 provides descriptive statistics for the different variables.
Table 1. Bureaucratic Resource Index
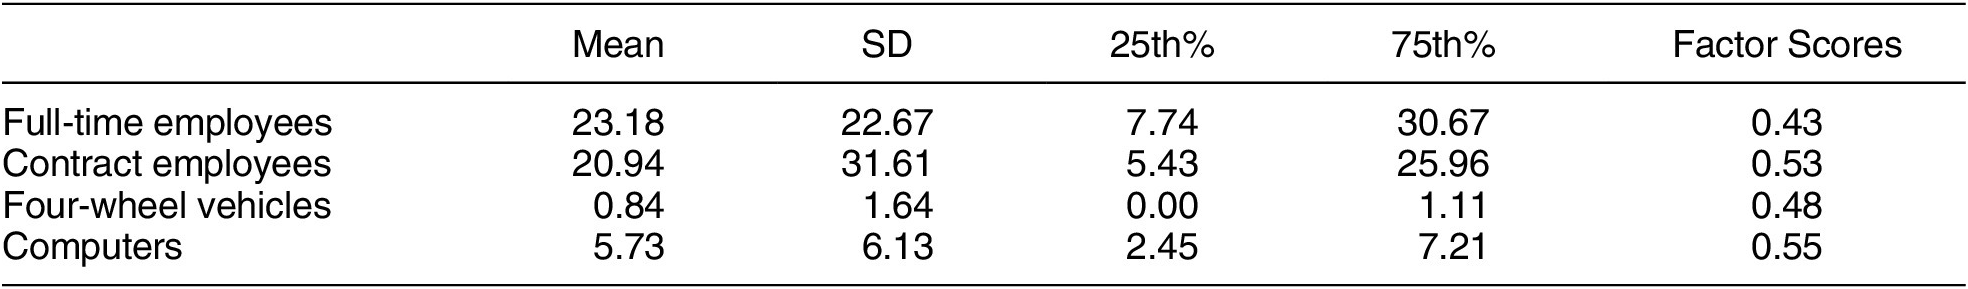
Note: Table includes descriptive statistics for four different variables comprising bureaucratic resource index: full-time employees per 100,000 residents, contract employees per 100,000 residents, four-wheel vehicles per 100,000 residents, and computers per 100,000 residents. The variables were combined into a standardized bureaucratic resource index with item weights based on the factor scores from a principal components analysis.
As Table 1 illustrates, despite the critical role they play, BDOs are given few resources to carry out their responsibilities. According to the survey, BDOs on average have just 23 full-time employees per 100,000 rural residents and less than one four-wheel vehicle per 100,000 residents. This is largely the consequence of a high vacancy rate, with 42% of sanctioned full-time employee posts currently vacant across the blocks in the survey. On a scale from 1 (lowest) to 5 (highest), 68% of the BDOs in our sample rated the “adequacy of resources in [their] current Block Development Office relative to the work they need to complete” a 3 or lower. Over 44% of BDOs reported that they had incurred out-of-pocket expenses for their official work in the previous six months, for items ranging from petrol to “protocol duty” (the provision of refreshments for official functions).
To measure the behavior of BDOs, enumerators contacted each BDO by phone on one day every week for three successive weeks to complete a time-usage diary for the preceding workday (the specific day of the week was randomly selected). The exercise consisted of asking BDOs to indicate in chronological order for each of the half-hour intervals between the start and end of the work day (i) where the BDO was physically located, (ii) who else was physically present, (iii) a short description of what he or she was working on, and (iv) a categorization of the activity into one or more of nine categories.Footnote 12 We asked for a high level of detail to make it cognitively burdensome for BDOs to misreport their activities.
In Figure 4, we provide a ridgeline plot of patterns of time utilization by BDOs over the course of a typical work day, averaging across all of the time-usage diaries completed by BDOs. As the figure illustrates, BDOs divide their time across many tasks, with trade-offs between multiple areas of focus. For example, the data reveal that while BDOs are able to dedicate their mornings to managerial tasks based in the office (e.g., planning and budgeting regarding programs, management of office and staff, and form filing), these managerial tasks are swiftly “crowded out” by handling the daily deluge of particularistic complaints and requests from citizens as well as politicians in the morning, a period sometimes known as “grievance hour.” Indeed, the estimates suggest that BDOs on average allocate only 22% of their daily time to planning and budgeting for programs; this is driven by the fact that much of their time is consumed with particularistic issues, especially handling individualized requests from citizens (21%) as well as from politicians (14%).
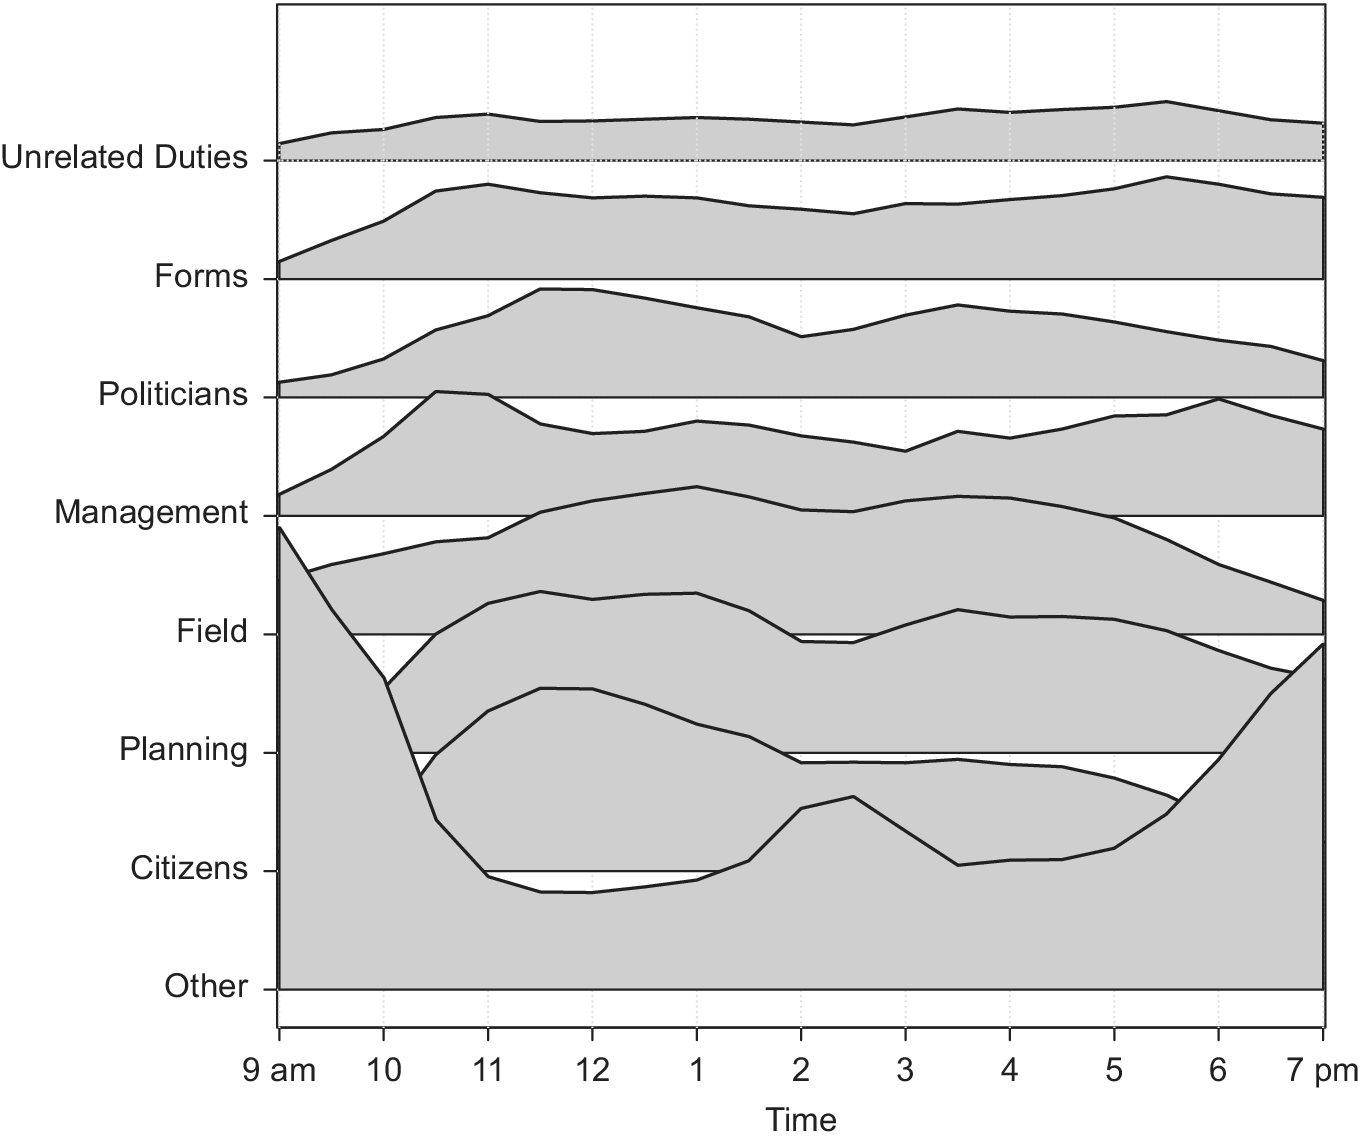
Figure 4. Patterns of Daily Time Allocation by Rural Development Officials
Political Determinants of Overload
What accounts for bureaucratic overload in India’s rural development bureaucracy? One key factor is the increase in bureaucratic responsibilities over time, especially an increase in the size of the populations that BDOs serve as well as a proliferation of national and state-level rural development programs, without commensurate investments in bureaucratic resources. Between 2001 and 2011, according to decadal censuses, despite an increase in the urbanization rate the rural population expanded by over 12%. In the last two decades, India has experienced the proliferation of an “alphabet soup” of national rural development programs (Kruks-Wisner Reference Kruks-Wisner2018). The implementation of these programs is delegated as an afterthought to BDOs, who have dozens of existing programs to implement, contributing to an accumulation of new programs that perform poorly at the implementation stage (Pritchett Reference Pritchett2009).
Yet it is the expansion of responsibilities coupled with the failure of state-level ruling parties to make commensurate investments in local state capacity that is the fundamental source of bureaucratic overload in India’s rural development bureaucracy. BDOs themselves have little power to purchase resources or hire staff. Instead, rural development blocks are allocated resources by state-level rural development departments, state-level ministries responsible for administering the local rural development bureaucracy. The most important actor that shapes these decisions is the ruling party of a state, which shapes these decisions through annual budgetary choices concerning the number of civil service employees that are recruited through merit-based examinations, the total funds that are allocated to staff salaries, or through norms governing the allocation of computers and vehicles to rural development blocks (see e.g., Kapur Reference Kapur2020). However, resources can also be targeted to localities, for instance, through the subdivision of an old block into multiple new blocks, differences in where new civil service recruits are posted, differences in the speed at which vacancies are filled, and differences in responsiveness to requested repairs of equipment depending on the bureaucratic priority given to different localities. It was regularly noted in the focus groups that resource levels vary significantly across blocks, even within the same district. One reason for this is that a variety of local politicians, especially legislators, play an important role in shaping the priority that the rural development department and district administrators give to different blocks.
The combination of decentralized administrative authority together with the fragmentation of the Indian party system weaken the electoral incentives of ruling parties and local politicians to make costly investments in improving local bureaucratic resources. In a rural setting where few citizens observe the inner working of local bureaucracy directly, ascribing bureaucratic performance to actions of specific actors among multiple potentially responsible parties is extremely difficult. Structurally unclear responsibility is exacerbated by the fragmentation of the Indian party system. In many rural development blocks, voters are represented by multiple political parties in different layers of government. For instance, in a given village, the local elected village council leader, the local legislator, and the state government may each belong to (or be controlled by) rival parties. This generates ambiguity about which party voters should reward or blame for local bureaucratic performance.
Though responsibility for implementation is structurally unclear, this also varies sub-nationally across rural development blocks. For example, blocks vary significantly in whether local legislators, actors who play an important role in local constituency service and bureaucratic oversight (see e.g., Bussell Reference Bussell2019; Gulzar and Pasquale Reference Gulzar and Pasquale2017), are aligned with the ruling party. While most rural development blocks are fully contained by a single legislative constituency, some, by virtue of the imperfect correspondence of block and constituency boundaries, intersect with the constituencies of multiple legislators. Therefore, a summary statistic that captures the degree of alignment is the share of the block population that is located within an aligned constituency (where  $$ j $$ indexes the villages in a block
  $$ i $$):
 $$ Aligne{d}_i=\frac{\ {\sum}_j Populatio{n}_j\times {I}_j^{Aligned\ Constituency}}{\sum_j Populatio{n}_j} $$
When voters are represented by aligned legislators, they can more clearly attribute observed improvements in implementation to a single party that holds power at the local and state level. The electoral incentives of the ruling party to make costly fiscal investments in the resource of a rural development block are therefore increasing with the share of villages that are located in an aligned constituency. However, as the share of the population in a rural development block represented by an opposition-party legislator increases, the less the ruling party expects to fully electorally internalize costly fiscal investments in local bureaucratic resources, since voters may be unable to clearly attribute resulting improvements in implementation to a single party or because of the risk that the electoral credit may even be “hijacked” by a legislator belonging to a rival party (see e.g., Bueno Reference Bueno2018).
Another source of variation in clarity of responsibility is the degree to which a rural development block is represented by a single or multiple legislators. One way of capturing the degree to which representation of a block is “unified” in a single legislator is the Herfindahl index of how concentrated the rural population is in a single constituency, which captures the probability with which two randomly selected citizens in a block are represented by the same legislator. This can be computed with the following equation (where  $$ j $$ indexes villages located in block
  $$ i $$ and
  $$ k $$ indexes constituencies):
 $$ Unifie{d}_i={\sum}_k{\left(\frac{\ {\sum}_j Populatio{n}_j\times {I}_j^{Constituency\ k}}{\sum_j Populatio{n}_j}\right)}^2. $$
When all or most of the rural population of a block is represented by a single legislator, the legislator expects to internalize the electoral credit from costly lobbying efforts to direct resources to the block. By contrast, when a rural development block overlaps with the constituencies of multiple legislators, both play a role in shaping local bureaucratic performance and local service delivery. As the clarity of responsibility literature suggests, in conditions of divided agency, it becomes more difficult for voters to attribute outcomes to the actions of specific agents, weakening the electoral incentives of local legislators to engage in costly lobbying for local bureaucratic resources in the first place.
To measure these variables, this article utilizes the primary census abstracts of the 2011 census to identify the census codes of every village located in the rural development block in our survey (over 40,000 villages). It then connects these census codes to shapefiles of village boundaries. It then utilizes GIS to assign village centroids to constituencies based on shapefiles of constituency boundaries. It is then possible to compute the  $$ Unifie{d}_i $$ variable by identifying all of the constituencies which intersect with a block and tallying the population-weighted share of villages located in each of those constituencies according to the formula above. It is similarly possible to compute the
  $$ Aligne{d}_i $$ variable by linking constituencies to electoral data from the most recent state election preceding our survey in each state to compute the population-weighted share of block villages located in an aligned constituency.
Figure 5 illustrates the GIS coding of these variables as well as how they correspond to differences in clarity of responsibility. The top row depicts rural development blocks with high levels of party alignment and the bottom row depicts blocks with low levels of party alignment. Ceteris paribus, we expect ruling parties to provide greater bureaucratic resources to aligned blocks. The left-hand-side column depicts rural development blocks which are represented by a single legislator. The right-hand-side column depicts rural development blocks which intersect with the constituencies of more than one legislator. Ceteris paribus, we expect legislators to exert more effort in lobbying for bureaucratic resources when the representation of a block is unified in a single legislator.

Figure 5. Differences in Block-level Clarity of Responsibility
Empirical Results
To test the argument statistically, we proceed in two steps. We first examine the effect of variation in block-level resources on the performance of rural development programs as well as plausible behavioral channels based on how resources affect the allocation of bureaucratic time across different tasks as measured through time-usage diaries. We then examine the political determinants of variation across rural development in resources.
Implementation
We first examine the association between bureaucratic resources and the performance of India’s largest rural development program, NREGA, with a regression equation of the form
 $$ NREG{A}_i={\beta}_1 RESOURCE{S}_i+\boldsymbol{X}^{\prime}\gamma +{\varepsilon}_i, $$
 where the variable  $$ NREG{A}_i $$ represents administrative data on the performance of NREGA in block
  $$ i $$ for one of two outcomes: the number of days of public works employment provided per capita and expenditure per capita under the program in 2016–17. By focusing on NREGA, the largest national rural development program in India, we are able to establish common metrics for performance across BDOs nationally.
We focus on NREGA because it is India’s largest rural safety net program (and indeed, one of the largest in the world). Additionally, as discussed, “rationing” or an under-provision of benefits relative to demand as well as a failure to spend available funds afflicts the implementation of NREGA. This makes measures of output a good proxy for performance. Another important feature of NREGA is that it is a managerially complex program, requiring BDOs to coordinate the planning and execution of a large number of public works projects, while also regularly verifying the completion of the projects on an intricate online monitoring system (see e.g., Mathur Reference Mathur2016). The administrative complexity of NREGA makes it a good test case for our theory of bureaucratic overload, which suggests that one reason that under-resourced and overloaded bureaucrats do not implement programs well is because they are unable to allocate enough time to managerial tasks, which are critical for carrying out complex responsibilities.
The main explanatory variable is  $$ RESOURCE{S}_i $$, which represents the standardized index of block-level resources, based on the number of full-time employees, contract employees, four-wheel vehicles and computers per rural capita, summed together with weights assigned on the basis of a principal components analysis. As discussed, this index was normalized by its in-sample standard deviation across blocks so that the coefficient
  $$ {\beta}_1 $$ represents the effect of a one-standard-deviation improvement in the bureaucratic resource index. We estimate three models: those with no fixed effects, those with state fixed effects, and those with district fixed effects. Our preferred specification is based on the inclusion of district fixed effects, which utilizes comparisons only between proximate BDOs within the same district.
All specifications control for a vector of block-level covariate as well as bureaucrat-level traits which may confound estimates. The block-level controls include block size (the total rural population), remoteness (measured in terms of haversine distance in kilometers to the district headquarters), the share of socially marginalized communities in the population (the share of scheduled tribes and castes in the population), and a proxy for block-level economic development (the literacy rate according to the 2011 census). At the bureaucrat level, we control for gender, educational level, as well as method of appointment to his or her current position (whether directly through a civil service exam, temporary posting, or promotion from a lower posting). The analysis is estimated by OLS, with standard errors adjusted to account for clustering of errors within states.
The regression results are reported in Table 2. The analysis from the preferred specifications including district fixed effects suggest that a one-standard-deviation improvement in bureaucratic resources is associated with an improvement in the provision of NREGA employment of one additional day per capita and total expenditures under the program by an additional 214 rupees per capita. When restricting attention purely to wage expenditures, a one-standard-deviation improvement in bureaucratic resources is associated with an improvement in the provision of NREGA wages by 154 rupees per capita.
Table 2. Impact of Bureaucratic Resources on Implementation of NREGA (Public Works) Dependent variable

Note: Unit of analysis is rural development block. Outcome is total days of NREGA employment provided per rural capita during 2016–17 or per capita program expenditures during 2016–17. Within-state specifications control for state fixed effects and within-district specifications control for district fixed effects. All specifications control for BDO-level controls (gender, education, method of civil service entry) and block-level controls (minority share of population, remoteness, literacy rate, and total block rural population). Analysis estimated by OLS. Standard errors adjusted for clustering within states. *p < 0.10, **p < 0.05, ***p < 0.01.
These are large magnitudes. The estimates imply that in the median block containing 150,000 residents, a one-standard-deviation improvement in bureaucratic resources is associated with additional annual expenditures under the program of approximately 32 million rupees and an additional 150,000 total person-days of public works employment provision annually, funded almost entirely by the central government. Comparable results are found in the specifications utilizing no fixed effects and in specifications with state fixed effects. The annualized cost to the state-level civil service of a one-standard-deviation improvement in bureaucratic resources is approximately 11 million rupees.Footnote 13 This implies that the marginal value of additional bureaucratic resources significantly exceeds cost, even when focusing on a single rural development program. The implied returns to additional investments in bureaucratic resources are so large that they suggest that state-level ruling parties are clearly failing to make socially beneficial investments in local bureaucracy.
We have argued that one reason that under-resourced and overloaded BDOs are unable to implement programs well is because they are unable to allocate adequate time to managerial focus, which is critical for implementing managerially complex programs like NREGA. One way in which we can assess this channel is to look at the impact of bureaucratic resource on the performance of Swachh Bharat, another major, national rural development program that is far less managerially complex to implement. Swachh Bharat is a national rural development program which provides financial incentive to rural households to build toilets. Typically, these toilets are built by private contractors, making it a less difficult program for rural development bureaucrats to administer.
In Table 3, we examine the effect of the standardized index of bureaucratic resources on the number of toilets built per 1,000 residents in 2016–17 across the rural development blocks in our sample, controlling for the same vector of block and bureaucrat traits and different fixed effect as in the NREGA analysis. As the preferred estimate based upon district fixed effects in column (3) suggests, a one-standard-deviation improvement in bureaucratic resources is associated with building an additional 2.5 toilets per thousand residents. While consequential, this is a smaller estimate relative to the impact of additional bureaucratic resources on the more managerially complex program, NREGA. An additional 2.5 toilets per 1,000 rural capita represents an 8% improvement over the sample average whereas the estimated impact from the same specification in the case of NREGA, an additional day of employment per rural capita, represents a 32% improvement over the sample average.
Table 3. Impact of Bureaucratic Resources on Swachh Bharat (Incentives for Toilets)

Note: Unit of analysis is rural development block. Outcome is number of toilets built per 1,000 rural residents under Swachh Bharat during 2016–17. Within-state specifications control for state fixed effects, and within-district specifications control for district fixed effects. All specifications control for BDO-level controls (gender, education, method of civil service entry) and block-level controls (minority share of population, remoteness, literacy rate, and total block rural population). Analysis estimated by OLS. Standard errors adjusted for clustering within states. *p < 0.10, **p < 0.05, ***p < 0.01.
Behavior
Another way we can highlight the critical role that bureaucratic resources play in facilitating organizational specialization and focus on managerial tasks is to examine how variation in bureaucratic resources is associated with patterns of bureaucratic time allocation. To assess this, we estimate a regression equation of the form
 $$ TIM{E}_{ita}={\beta}_1 RESOURCE{S}_{ita}+\boldsymbol{X}^{\prime}\gamma +{\varepsilon}_{ita}, $$
 where  $$ TIM{E}_{ita} $$ represents the percentage of hours between 10 a.m. and 5 p.m. dedicated to task
  $$ a $$ by the BDO in block
  $$ i $$ according to the time-usage diary
  $$ t $$, three of which were assigned to be completed by each BDO in the survey. The different tasks include (i) filing forms, (ii) management of office and staff, (iii) planning and budgeting for programs, (iv) field inspections, (v) handling individualized requests and complaints from citizens, (vi) handling individual requests and complaints from politicians (asked separately vis-à-vis village politicians and legislators but combined into one category for the analysis), and (vii) unrelated duties. All regressions control for the same vector of block and bureaucrat characteristics discussed previously as well as no fixed effects, state fixed effects, or district fixed effects, depending upon the specification. The analyses are estimated by weighted least squares, with weights assigned in inverse proportion to the number of time-usage diaries completed by each BDO, to ensure that each BDO is weighted in the analysis equally regardless of his or her responsiveness to the time-usage diary exercise.
The results of the analysis are reported in Table 4. Consistent with the argument, the results indicate that when BDOs have additional resources (less overload) they are better able to specialize, focusing on managerial tasks and delegating particularistic tasks to employees. According to panel C, which reports the preferred estimates based on within-district comparisons, a one-standard-deviation improvement in bureaucratic resources is associated with an increase in the percentage of daily hours allocated by BDOs to managerial tasks: form-filing increases by 2.97 percentage points, time spent on office-based management of staff increases by 1.14 percentage points, and time spent on planning and budgeting for schemes increases by 1.73 percentage points. By contrast, a one-standard-deviation improvement in bureaucratic resources is associated with a reduction in time allocated to particularistic tasks: field inspections fell by 2.08 percentage points, handling individualized requests and complaints from politicians by 1.45 percentage points, and handling individualized requests and complaints from citizens by 1.41 percentage points. Cumulatively, this represents a reallocation of 5.85 percentage points of daily time to managerial tasks (on average BDOs spend 52% of their daily hours of form filing, planning and budgeting, and managing office and staff). However, additional resources do not substantially change a measure of the fractionalization of time allocated to different tasks upon which a BDO works over the course of the day, as suggested by the near-zero estimate in column (8). This suggests that additional personnel and resources affect bureaucratic behavior primarily by encouraging managerial focus, rather than promoting task homogeneity per se. A very similar pattern of results is obtained in panel A, which uses cross-state comparisons, and panel B, which uses within-state comparisons.
Table 4. Impact of Resources on Bureaucratic Behavior

Determinants of Bureaucratic Overload
What explains variation across rural development blocks in the degree of bureaucratic overload? We have argued that, if electoral incentives matter, ruling parties should invest more in local bureaucratic resources in conditions of greater clarity of responsibility. To test this claim, we estimate a regression equation of the form
 $$ RESOURCE{S}_i={\beta}_1 ALIGNE{D}_i+{\beta}_2 UNIFIE{D}_i+{\beta}_3 MINORITIE{S}_i+{\beta}_3 REMOTENES{S}_i+{\varepsilon}_i, $$
 where the outcome  $$ RESOURCE{S}_i $$is one of five different measures of bureaucratic resources in block
  $$ i $$: either the standardized bureaucratic resource index or one its four components, including full-time employees per 100,000 residents, contract employees per 100,000 residents, four-wheel vehicles per 100,000 residents, and computers per 100,000 residents. The variable
  $$ ALIGNE{D}_i $$ measures the share of the block population that is represented by an aligned legislator. The variable
  $$ UNIFIE{D}_i $$ represents a Herfindahl index of the degree to which the population of a block is concentrated in a single constituency. Both of these variables represent the degree to which agency is unified or divided and serve as a proxy for clarity of responsibility and the strength of electoral incentives to invest in local bureaucratic resources. As discussed, these variables were measured based on GIS tools, which enabled us to link information on over 40,000 village boundaries to the rural development blocks in our survey.
As before, depending on the specification, we control for no fixed effects, state fixed effects or, in our preferred specification, district fixed effects. We also examine other potentially important determinants of local state capacity, including socioeconomic marginalization and remoteness. The variable  $$ REMOTENES{S}_i $$ represents the haversine distance in kilometers of the block headquarters from the district headquarters, which is typically the closest urban center. The variable,
  $$ MARGINALIZATIO{N}_i $$, represents a measure of socioeconomic marginalization based on the population share of socially marginalized communities (scheduled castes and tribes).
The results are reported in Table 5, which suggests that fewer bureaucratic resources are provided in conditions where responsibility is less clear. Panel A suggests that going from a block where none of the population is represented by an aligned legislator to one where all of the population is represented by an aligned legislator is associated with a 0.22-standard-deviation improvement in resources, driven primarily by an increase in contract employees (an additional 8.46 per 100,000 rural residents) and computers (an additional 1.02 per 100,000 rural residents). Similarly, going from a block where representation of the rural population is evenly split between two legislators (where the measure of unified representation takes a value of half) to a block that is completely represented by a single legislator (where the measure of unified representation takes a value of one) is associated with a 0.22-standard-deviation improvement in the resource index, which is also primarily driven by improvements in contract staff.
Table 5. Determinants of Bureaucratic Resources
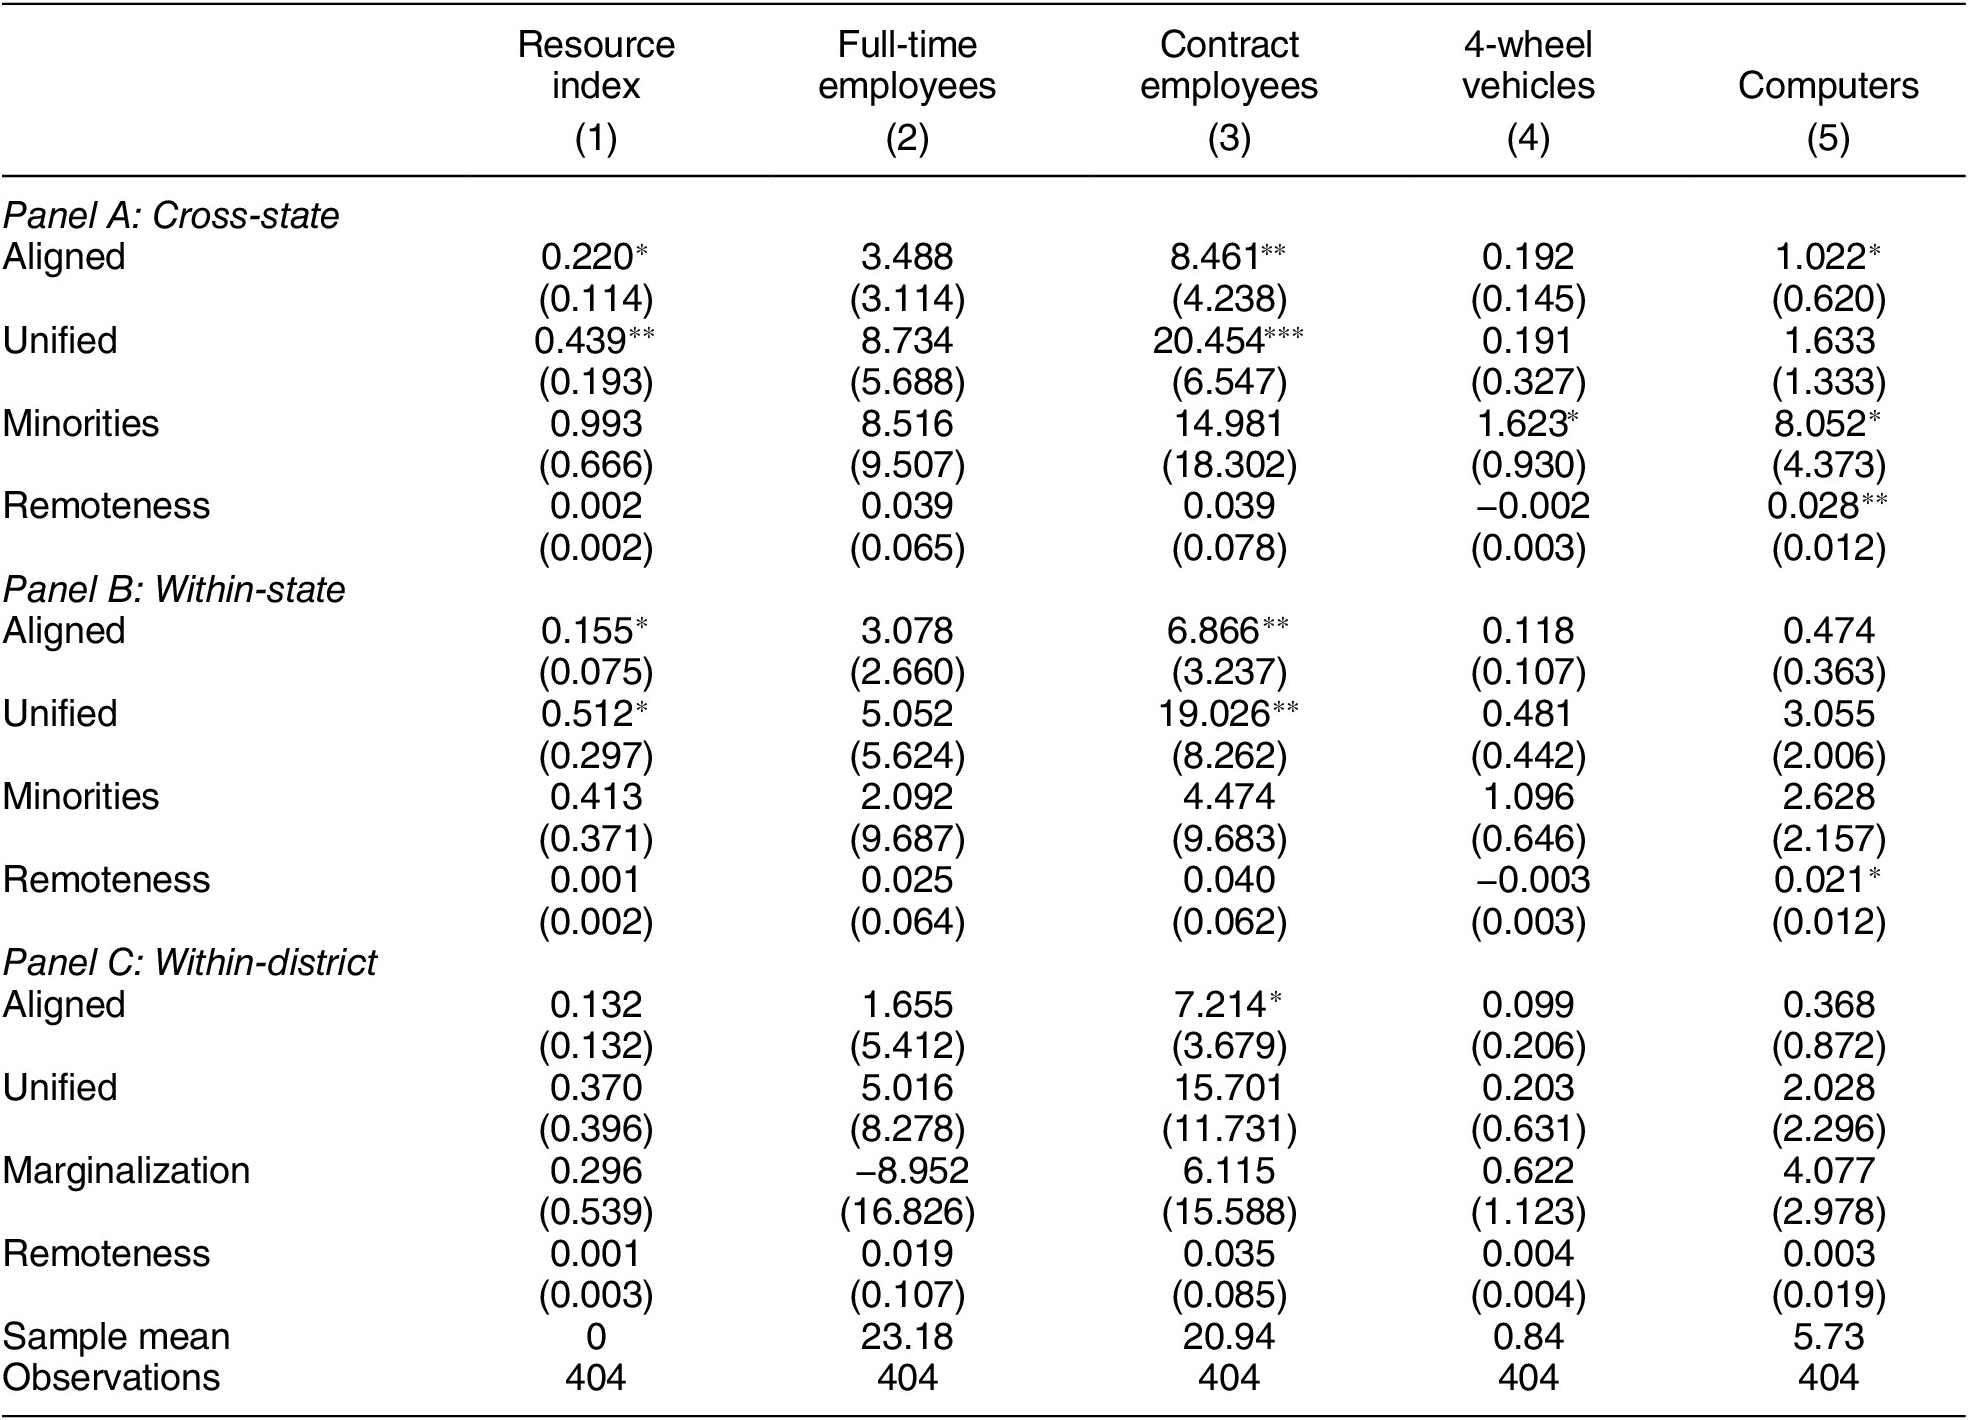
A similar pattern is found in Panel B, which includes state fixed effects and therefore only compares blocks within the same state. According to these estimates, going from a block where none of the population is represented by an aligned legislator to one where all of the population is represented by an aligned legislator is associated with a 0.16-standard-deviation improvement in bureaucratic resources, an effect driven mainly by improvements in contract employees. Similarly, going from a block where representation of the rural population is evenly split between two legislators to a block that is completely represented by a single legislator is associated with a 0.25-standard-deviation improvement in the bureaucratic resource index, which is also driven primarily by improvements in contract staffing levels.
Panel C, the most demanding specification including district fixed effects, also reveals a very similar pattern of coefficients. Although some coefficients are no longer statistically significant, this is driven largely by the fact that this specification prunes many districts from the analysis that contain no within-district variation in the degree of party alignment or unified representation. Yet even this demanding specification suggests that aligned blocks are better resourced, especially in terms of contract employees. Going from a block where none of the population is represented by an aligned legislator to one where all of the population is represented by an aligned legislator is associated with 7.21 additional contract employees per 100,000 rural residents. A comparable pattern is found in the case of more unified blocks that are represented by a single legislator, although the coefficients are not statistically significant. Together, the estimates suggest that ruling parties invest in additional bureaucratic resources when electoral incentives are stronger due to greater clarity of responsibility, as measured with the degree of vertical party alignment and the degree to which representation of a block is concentrated in a single legislator
To explore the effect of party alignment in greater depth, we examine a natural experiment based on close elections. We use a close-elections fuzzy regression discontinuity design, in which we instrument for the share of the population located in an aligned constituency with the narrow election (as though by coin flip) of a ruling-party legislator in the constituency containing the block headquarters, to study the effect of alignment on bureaucratic resources. Instrumenting in a two-stage least squares or “fuzzy” RDD framework adjusts for imperfect compliance with the “treatment” of narrowly electing an aligned legislator in the block headquarters constituency arising from the imperfect congruence of block and headquarters constituency boundaries.Footnote 14
Figure 6 illustrates the identification strategy, depicting the first-stage relationship in the top panel and the reduced-form relationship in the bottom panel. The running variable is the win/loss vote share margin of (eventual) ruling party’s candidate in the constituency containing the block headquarters. The fuzzy RDD estimand represents the local impact of an increase in the population share located in an aligned constituency due to the narrow election of an aligned legislator in the block headquarters constituency, which is computed by taking the ratio of the reduced-form and first-stage RDD estimates. The top panel indicates that the population share located in an aligned constituency jumps sharply at the discontinuity. The bottom panel indicates that there is also a jump in the bureaucratic resources index at the same discontinuity. The effect appears to be localized, consistent with an electoral calculus in which ruling parties concentrate investments in local state capacity in aligned constituencies especially when elections are competitive as opposed to comfortable margins of victory.

Figure 6. Close Elections Regression Discontinuity Design
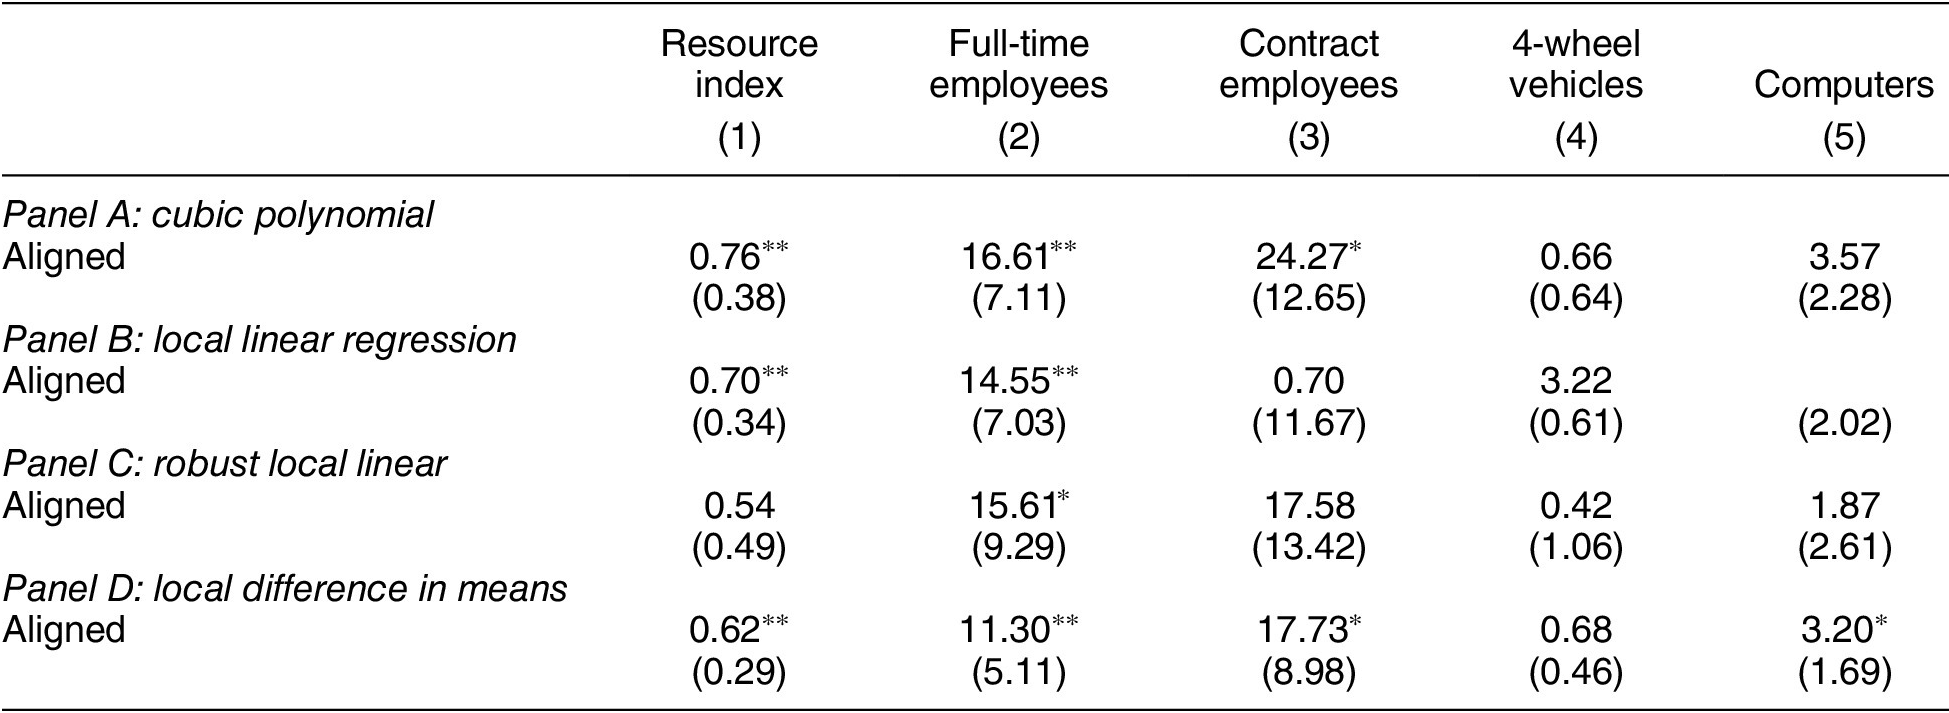
To compute the fuzzy RDD estimates, we take four commonly used estimation approaches: a global polynomial regression-based approach, a local linear regression approach with a triangular kernel scheme (weighting observations closer to the discontinuity more heavily) and bandwidth selected on the basis of a data-driven algorithm proposed by Imbens and Kalyanaraman (Reference Imbens and Kalyanaraman2012), a robust local linear regression approach with data-driven bandwidth selection and triangular kernel along with bias correction procedure proposed by Calonico, Cattaneo, and Titiunik (Reference Calonico, Cattaneo and Titiunik2014), and finally, a local difference in means conducted within a bandwidth half of that selected with the robust local linear approach.
The results are reported in Table 6. Across specifications, the fuzzy RDD estimates suggest that increases in the share of the block population located in an aligned constituency are associated with large improvements in bureaucratic resources. According to panel A, based on a global polynomial regression, going from a block where none of the population is represented by an aligned legislator to one where all of the population is represented by an aligned legislator results in a 0.76-standard-deviation improvement in the bureaucratic resource index, driven mainly by improvements in full-time and contract employees. The estimates are similar using alternative estimation approaches. In the Online Appendix, we additionally perform placebo tests by running the same regressions on placebo discontinuities on either side of the true discontinuity; none of these placebo tests is associated with a statistically significant estimate, bolstering the credibility of the design. The estimates are considerably larger than those from the fixed effects analyses reported in Table 5. This is potentially consistent with an electoral calculus explanation in which ruling parties invest more heavily in the bureaucratic resources of aligned constituencies when elections are close.
Table 6. Fuzzy RDD Estimates
We examine balance on covariates in Table 7. Across specifications, consistent with the identifying assumptions, the fuzzy RDD estimates of the effect of party alignment on various placebo outcomes are small and statistically insignificant. For instance, party alignment is not associated with structural features of rural development blocks including the size of the rural population, share of disadvantaged communities in the population, remoteness, literacy rate, the number of villages in a block, or the degree to which representation of the rural population in a block is concentrated in a single legislator.
Table 7. Fuzzy RDD Estimates of Balance on Covariates

Party alignment is also not associated with measures of the type of bureaucrat appointed to more or less aligned blocks. This not only indicates balance but also helps to rule out the possible alternative channels. For instance, we find no differences in gender, age, or years in the civil service, ruling out the possibility that more “networked” (typically older and male) bureaucrats are posted to more aligned rural development blocks. We find no evidence that more “competent” bureaucrats are posted to aligned rural development blocks either, as measured with method of bureaucrat entry into the civil service or educational levels.
We also find that more or less aligned blocks do not differ on other attributes that have been hypothesized to affect bureaucratic performance including survey-based measures of the strength of career incentives (probability of promotion linked to performance), flexibility of organizational norms (probability of reallocating funds for a hypothetical approved public works project that has been cancelled by unexpected rains), and bureaucratic autonomy from political interference (share of list of politicians over whom the BDOs expects to prevail in a hypothetical dispute about where to allocate a project across villages).Footnote 15 In the Online Appendix, we also report a list experiment on corruption and office-selling, which does not indicate differences in levels of corruption across blocks primarily overseen by aligned or opposition-party legislators, although the standard errors from this analysis are large.
Conclusion
What explains poor local implementation of government programs? Drawing on an original survey of rural development officials in India, this article has provided evidence for a pathology we have termed bureaucratic overload, characterized by a lack of adequate resources relative to responsibilities. Bureaucratic overload is detrimental to implementation because it tends to crowd out managerial focus, making it especially difficult to implement managerially complex programs. Despite its deleterious consequences for implementation, bureaucratic overload occurs, we argue, because of a lack of adequate electoral incentives originating from unclear political responsibility for implementation.
Do the findings travel beyond India? Our framework applies to democracies, where elections provide the primary performance incentive to politicians. Since weak electoral incentives to invest in local bureaucracy originate with an absence of clarity of responsibility, bureaucratic overload is more likely in contexts that share some of India’s institutional characteristics, including a high level of administrative decentralization combined with party system fragmentation. Bureaucratic overload is also more likely in fiscally constrained contexts, where the opportunity cost of spending scarce fiscal resources on local bureaucracy are high. These are conditions which are often, but not exclusively, found in developing countries (see e.g., Besley and Persson Reference Besley and Persson2014).
The findings provide a micro-level perspective on the political economy and bureaucratic behavior underpinning weak state capacity. Macro-historical work suggests that state-builders invest in building the capacity of bureaucracy as part of a centuries-long process of war-making and internal consolidation of authority over rivals (see e.g., Ertman Reference Ertman1997; Geddes Reference Geddes1994; Tilly Reference Tilly, Evans, Rueschemeyer and Skocpol1985). Our findings suggest that in a contemporary, democratic context, elected governments and politicians make these investments when they expect to electorally internalize the benefits, which is often not the case—to the detriment of implementation.
Supplementary Materials
To view supplementary material for this article, please visit http://dx.doi.org/10.1017/S0003055420000477. Replication materials can be found on Dataverse at: https://doi.org/10.7910/DVN/N1JX6Y.


Comments
No Comments have been published for this article.