


The allocation of budgetary resources is an essential feature of American government, and scholars have long been interested in the political determinants of this process. Work in this area tends to examine which legislators direct a disproportionate share of benefits to their districts or states. Substantial disagreements exist on who benefits and why. According to distributive theory, legislators organize Congress into committees to facilitate the flow of benefits to their districts (Mayhew Reference Mayhew1974; Weingast and Marshall Reference Weingast and Marshall1988), while party theories posit that majority party members are the main beneficiaries (Cox and McCubbins Reference Cox and McCubbins2005; Kiewiet and McCubbins Reference Kiewiet and McCubbins1991; Rohde Reference Rohde1991). Informational theory, on the other hand, asserts that Congress is organized for informational efficiency, and legislators are less likely to engage in distributive activities (Krehbiel Reference Krehbiel1991).
Distributive, partisan, and informational theories all posit a relationship between legislative organization and public policy. However, when testing these theories on the allocation of budgetary resources, multiple policy measures exist. Scholars face a choice between using measures of funding and measures of spending as their outcome of interest. Funding data reflect the legislative appropriations (i.e., budget authority) that are adopted by Congress and signed by the President, while spending data represent funding that has achieved certain milestones, such as being committed to a contract (i.e., obligations) or executed from government coffers (i.e., outlays). Although legislators may care most about the downstream benefits of delivered spending, they directly control funding levels. Thus, for studies that examine the impact of political actors on the congressional budget process, such as whether a committee position allows legislators to secure additional pork for their districts, we argue the outcome of interest should be appropriations, not spending.Footnote 1 On the other hand, for studies that examine the impact of political actors on the budget execution process, such as whether political appointees distribute pork to potentially vulnerable copartisan congressional districts (e.g., Gordon Reference Gordon2011), the outcome of interest should be spending, not appropriations. This is also true for studies that examine the effect of budgetary resources on other downstream measures, such as whether voters reward politicians for bringing additional pork to their districts (e.g., Kriner and Reeves Reference Kriner and Reeves2012).
However, appropriations data are not without their limitations. Federal appropriations are largely program based, not location based, and it has proven difficult to acquire appropriations data by congressional district. As a result, the studies using appropriations data have focused on programmatic areas thought to be laden with pork, such as rivers and harbors (Ferejohn Reference Ferejohn1974), transportation (Lee Reference Lee2003), federal research (Payne Reference Payne2007), and academic earmarks (Balla et al. Reference Balla, Lawrence, Maltzman and Sigelman2002). Apart from the congressional literature, scholars of the presidency have also used appropriations data to show that presidents use public appeals to influence appropriations decisions (Canes-Wrone Reference Canes-Wrone2006) and that legislators may defer to presidential preferences more during wartime than peacetime (Howell, Jackman, and Rogowski Reference Howell, Jackman and Rogowski2013).
In an effort to conduct comprehensive tests, a number of scholars have turned to widely available measures of spending. In the congressional literature, these studies examine the effect of committee position (Berry and Fowler Reference Berry and Fowler2016), gender (Anzia and Berry Reference Anzia and Berry.2011), ideology (Alexander, Berry, and Howell Reference Alexander, Berry and Howell2015), and majority party status (Albouy Reference Albouy2013; Carroll and Kim Reference Carroll and Kim2010) on particularistic benefits, while studies in the presidency literature examine executive influence over the distribution of spending (Berry, Burden, and Howell Reference Berry, Burden and Howell2010; Dynes and Huber Reference Dynes and Huber2015; Hudak Reference Hudak2014; Kriner and Reeves Reference Kriner and Reeves2015).Footnote 2 The underlying source for much of this work is an impressive data set compiled by Bickers and Stein (Reference Bickers and Stein1991, Reference Bickers and Stein2000). Using the Federal Assistance Award Data System (FAADS), the authors collect annual spending by program across congressional districts from FY1983 to FY1997, which others extend to FY2010 (Alexander, Berry, and Howell Reference Alexander, Berry and Howell2015; Berry, Burden, and Howell Reference Berry, Burden and Howell2010). FAADS primarily records federal obligations, or the federal government’s legally binding commitment to make payment in the future.Footnote 3 However, FAADS data are not comprehensive, and certain program areas (e.g., defense) have a substantial amount of missingness.
In this paper, we argue that spending outcomes may serve as a poor test of the research questions scholars seek to answer, since spending data conflate competing influences on the budget, are downstream measures of the appropriations that originated them, and induce measurement error, which increases the likelihood of a null result and may produce biased estimates. To test our claim, we compare the spending data used in a recent prominent study (Berry and Fowler Reference Berry and Fowler2016) with an original data set of military construction appropriations covering the same time period. While an analysis of the spending data produces a null result, the same analysis using the appropriations data provides strong evidence that the pork barrel was alive and well during this period. Our findings have broad implications for studies that use measures of spending in the congressional and presidency literatures.
THE FEDERAL BUDGET PROCESS
The federal budget process occurs in three distinct phases. In the first phase, the executive branch internally develops funding levels that comprise the President’s annual budget request to Congress. In the second phase, congressional committees and their parent chambers consider this request, act upon its recommendations, and approve appropriations bills for the President’s signature. In the third phase, the executive branch manages legislative appropriations and allocates funding within the authority provided by Congress. It is on this last phase, often called the budget execution process, that we focus our attention.
When Congress appropriates money to the executive branch, it is actually providing government agencies with budget authority to enter into obligations of a specified amount for specific purposes. When an agency takes any action using its appropriation that makes the government liable to make payment in the future, such as entering into a contract, it incurs an obligation. When an agency spends money on an obligation, such as paying a contractor, it outlays the funding. The rate at which an appropriation is obligated during a given year is the obligation rate, and the rate at which an appropriation is outlaid is the outlay rate. Funds may obligate and outlay over several years.
Table 1 presents estimated obligation and outlay rates for select appropriations accounts of the FY2009 Military Construction, Veterans Affairs, and Related Agencies appropriations bill.Footnote 4 The percentages shown signify how much of an appropriation will be obligated or outlaid in each year, and we have divided the accounts into two categories: those that legislators historically earmarked from FY1984 through FY2010, which we label pork accounts, and those legislators did not, which we label non-pork accounts. We highlight that the majority of accounts do not obligate at 100%, that no account outlays at 100%, and that pork accounts seem to systematically spend at a lower rate, both in obligations and outlays, than non-pork accounts.
TABLE 1. Obligation & Outlay Rates for FY2009 Military Construction Appropriations

Obligation and outlay rates vary greatly among appropriations accounts and among programs, projects, and activities within the same appropriations account. In accounts with high first-year rates, most of an appropriation is obligated or outlaid during the first year in which funding is made available; in accounts with low first-year rates, most of an appropriation is not obligated or outlaid during that fiscal year. Consequently, measures of spending in a given year are a function of spending from new appropriations and spending from prior-year appropriations, a point also observed by other scholars (e.g., Alvarez and Saving Reference Alvarez and Saving1997, 58–9; Krehbiel Reference Krehbiel1998, 191).
THE PROBLEMS WITH SPENDING DATA
We argue that measures of spending conflate competing budgetary influences, are downstream measures of the appropriations that originated them, and induce measurement error. First, spending measures, whether obligations or outlays, do not allow scholars to disentangle presidential, congressional, and bureaucratic influences over the budget. Presidents exert ex ante influence in their annual budget requests; legislators exert influence in the drafting of appropriations bills; and bureaucrats exert ex post influence in the management of legislative appropriations. To disentangle these competing influences, we collect location-based appropriations data for military construction projects, which we discuss in detail in the following section and in the appendix. These data allow us to isolate congressional influences over the budget by distinguishing between presidentially requested and congressionally directed appropriations. Further, our data are free from ex post bureaucratic influence, since Congress specifies the recipient of each military construction project in the annual appropriations bill and report.
Second, as noted in the previous section, measures of spending are a function of spending from new appropriations and spending from prior-year appropriations. Yet, a standard assumption in political science scholarship is that spending in a given year can be tied to the budget adopted in the preceding year. Tying measures of spending in year t to political variables in year t − 1 only accurately measures this mechanism when the budget execution phase lasts one year, which implies that spending equals appropriations.Footnote 5 As demonstrated in Appendix Table A.1, this is rarely the case. Instead, if the way in which legislators influence the federal budget is in the drafting of appropriations bills, then using spending rather than appropriations may serve as a poor test of the causal mechanism, such as whether legislators direct a disproportionate share of benefits to their districts or states.
Third, spending data, such as FAADS, exclude certain categories of spending (e.g., federal wages and salaries) and suffer from incomplete reporting by agencies, which has been noted by a number of Government Accountability Office audits.Footnote 6 This missingness in the data tends to underestimate spending and thereby induces measurement error, since scholars typically assume that a district receives no spending if it is not represented in the data. The resulting measurement error may lead to imprecise estimates and larger standard errors, making a null result more likely. Furthermore, since many political variables may be correlated with the measurement error, this missingness may result in omitted variable bias. For example, if distributive theory were correct, then committee members should procure more pork than non-committee members. In turn, this would induce larger measurement error in committee members’ districts and states, producing downward-biased estimates.
DATA & METHODOLOGY
We compare the spending data used in a recent prominent study (Berry and Fowler Reference Berry and Fowler2016) with an original data set of military construction appropriations covering the same time period (FY1984 to FY2010). We compile the appropriations data from conference reports that accompany each enacted appropriations bill and classify enacted appropriations as either presidentially requested or congressionally directed (i.e., earmarks). We describe our data more fully in the appendix.
Figure 1 presents a comparison of the two data sets with spending, appropriations, and earmarks shown. Earmarks here represent a subset of appropriations. Two points bear mentioning. First, there are substantial differences in the data due in large part to missingness. In all but one year, appropriations exceed spending, and this discrepancy is particularly pronounced during the first nine years of the panel: appropriations average $3.36 billion per year and spending averages $374 million per year. In addition, the FAADS data record no military construction spending in any House districts from FY1984 through FY2005.Footnote 7 Second, the spending data systematically vary less than the appropriations data, since spending measures represent a weighted rolling average of the appropriations that originated them. For research designs that rely on year-to-year variation to identify the causal effect of political variables on the allocation of budgetary resources, such as panel designs, using the appropriated amount is especially important.
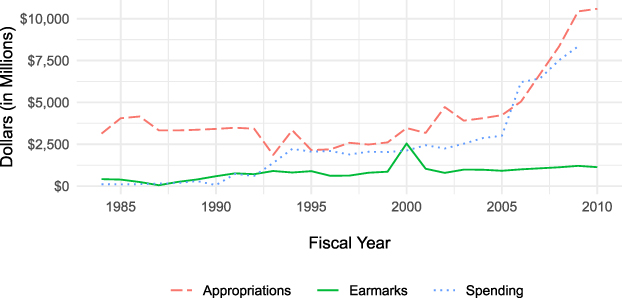
FIGURE 1. Comparison of Military Construction Spending, Appropriations, and Earmarks
To examine the effect of committee membership on appropriations, we adopt the same two-way fixed effects design and model specifications as Berry and Fowler:
 $$Por{k_{it}} = \beta \;Committee\;Membe{r_{it}} + \alpha {X_{it}} + {\gamma _i} + {\delta _t} + {\varepsilon _{it}},$$
where Committee Member it is a binary indicator of whether a legislator serves on the authorizing committee/appropriations subcommittee with jurisdiction over military construction, γ i is a legislator/state fixed effect, δ t is a year fixed effect, and X it is a vector of other covariates: majority party membership and seniority. This within-member design compares appropriations when legislators are on committee to when they are not on committee, rather than comparing committee members to non-committee members.
Provided that legislators follow parallel trends over time, β represents the average effect of committee membership on pork.Footnote 8 Models are estimated separately for the House and Senate. For the House, we analyze spending and appropriations at the legislator level. For the Senate, we analyze spending and appropriations at the state level. In the appendix, we include a committee position analysis, placebo tests, and robustness checks, as well as demonstrate that the parallel trends assumption appears to hold.Footnote 9
RESULTS & DISCUSSION
In their analysis, Berry and Fowler find no evidence of a committee effect on spending, a finding we replicate using their data. However, estimating the same model with appropriations data provides strong evidence that legislators use their seats on appropriations subcommittees to distribute pork. Table 2 shows the effect of House committee membership on military construction spending, appropriations, and earmarks.
TABLE 2. Effect of House Committees on Spending, Appropriations, and Earmarks
Note: Standard errors clustered by state.
* p < 0.05; ** p < 0.01; *** p < 0.001.
Columns 1 and 2 of Table 2 replicate Berry and Fowler’s analysis using spending data, Columns 3 and 4 perform the same analysis on the $106.9 billion of military construction appropriations, and Columns 5 and 6 re-estimate the analysis exclusively on the $21 billion of legislative earmarks. Using appropriations rather than spending, we find that appropriations subcommittee members’ districts receive nearly nine times more in appropriations when they are on the subcommittee and 22 times more in earmarks.Footnote 10
With respect to the Senate, Table 3 shows the effect of Senate committee membership on spending, appropriations, and earmarks at the state level. The columns of Table 3 are presented in the same manner as Table 2. We find that states represented by at least one Senate appropriations subcommittee member receive nearly 60% more in appropriations and four times more in earmarks.Footnote 11
TABLE 3. Effect of Senate Committees on Spending, Appropriations, and Earmarks
Note: Standard errors clustered by state.
* p < 0.05; ** p < 0.01; *** p < 0.001.
Our analysis of military construction spending and appropriations makes several contributions. First, we show that using spending as opposed to appropriations may produce starkly different results. We argue that this discrepancy is largely due to missingness in the data and to tying spending outcomes in year t to political variables in year t − 1. However, this issue is not unique to military construction programs. Less than three-quarters of all appropriations outlay in the first year, and foreign operations (35%), transportation (35%), homeland security (55%), energy and water (59%), and defense (59%) programs have particularly low outlay rates.Footnote 12 Hence, our broader argument that spending data may serve as a poor test of certain research questions should be generalizable to all program areas to varying degrees.Footnote 13 As a result, our findings have broad implications for studies that use measures of spending in the congressional and presidency literatures. Second, we demonstrate that measurement error in the spending data increases the likelihood of a null result. The null findings using the spending data, compared with our strong findings using the appropriations data, are consistent with this interpretation. Third, we find substantial evidence in favor of distributive theory. Contrary to Berry and Fowler’s analysis, we find that the pork barrel was alive and well for appropriators during this period.
SUPPLEMENTARY MATERIAL
To view supplementary material for this article, please visit https://doi.org/10.1017/S0003055419000881.
Replication materials can be found on Dataverse at: https://doi.org/10.7910/DVN/UN3KML.


Comments
No Comments have been published for this article.