


The increased focus on political leaders arguably represents the most important recent development in conflict scholarship. Where the initial wave of this research typically focused on leaders’ desire to remain in power, an increasingly popular approach argues interstate conflict processes are driven by attributes related to leaders’ underlying willingness to use force. Scholarship in this tradition explains a range of conflict-related outcomes in terms of a range of leader characteristics, including prior military service (Horowitz, Stam, and Ellis Reference Horowitz, Stam and Ellis2015), time in office (Wu and Wolford Reference Wu and Wolford2018), foreign policy beliefs (Saunders Reference Saunders2011), resolve (Kertzer Reference Kertzer2016), political orientations (Heffington Reference Heffington2018), a revolutionary past (Colgan and Weeks Reference Colgan and Weeks2015), and perceptual biases (Yarhi-Milo Reference Yarhi-Milo2013). This research program has led to an accumulation of knowledge about the effects of particular leader attributes, but it has made relatively little progress on how leaders’ general willingness to use force, or latent hawkishness, influences conflict processes.
Arguably the principal reason for the lack of empirical research on the consequences of leaders’ general hawkishness is that no measure of the concept with broad coverage constructed independently of conflict participation exists. This article introduces a framework that produces such indicators. We use Bayesian latent variable models to develop measures of the underlying hawkishness of 2,965 political leaders between 1875 and 2004 based on their background experiences, political orientations, and psychological traits.
Our indicators provide meaningful improvements over existing variables used to proxy leaders’ willingness to use force along multiple dimensions, including coverage, construct validity, predictive validity, and measurement uncertainty. We demonstrate that modeling leaders’ latent hawkishness based on experiences closely related to conflict or risk tolerance produces better measures than indicators built on a wide range of personal attributes. Importantly, our approach allows other scholars to incorporate additional data and make alternative modeling assumptions that could yield more predictive measures in the future.
Underlying Determinants of Leaders’ Willingness to Use Force
Scholars typically explain variation in leaders’ hawkishness using one of three approaches. The first argues leaders’ psychological characteristics underlie their willingness to use force. This research argues foreign policy is driven by leaders’ dispositional traits, perceptions, and beliefs about how the political world operates and the methods that will allow them to obtain their goals (e.g., Keller Reference Keller2005; Saunders Reference Saunders2011). A second approach links leaders’ willingness to use force with their political orientations. This tradition argues leaders of right-leaning governments are more hawkish and more likely to initiate interstate conflicts than leaders of left-leaning governments (Bertoli, Dafoe, and Trager Reference Bertoli, Dafoe and Trager2019; Heffington Reference Heffington2018). A third research program focuses on leaders’ personal experiences. In general, previous experiences have a larger influence on a leader’s willingness to use force when they are directly relevant to conflict and/or reward risk taking (Carter and Nordstrom Reference Carter and Nordstrom2017; Horowitz, Stam, and Ellis Reference Horowitz, Stam and Ellis2015). An important variant of this approach uses multiple experiences to construct indicators of leaders’ general orientation towards the use of force. Most notably, Horowitz, Stam, and Ellis (Reference Horowitz, Stam and Ellis2015, 67) create a measure that identifies a leader’s underlying risk of initiating a conflict by estimating conflict initiation as a function of thirty-three background experiences. Unfortunately, this measure should not be used to estimate conflict initiation, as it is derived from the probability that a leader will initiate a conflict.
Leaders’ background experiences, political orientations, and psychological traits have been shown to influence interstate conflict processes. This suggests measures used in each tradition contain information about leaders’ underlying hawkishness. Existing indicators, though, are based exclusively on characteristics from one of the three approaches. This implies measures of leaders’ willingness to use force based on information associated with each tradition will have greater construct validity and, likely, greater predictive validity than existing proxies.
Modeling Leaders’ Willingness to Use Force
There are two substantial challenges to constructing measures of leaders’ general willingness to use force. First, leader hawkishness is not directly observable. Second, data on leaders’ experiences, political orientations, and psychological traits vary considerably in their spatial and temporal coverage. A measure based on data from each of the three research traditions with broad coverage therefore requires a method of construction that can incorporate sparsely available information. We first describe the data underlying our measures before outlining our approach.
Table 1 presents the data used to construct our indicators of leaders’ latent hawkishness. The LEAD project (Horowitz, Stam, and Ellis Reference Horowitz, Stam and Ellis2015) provides information about the background experiences of 2,965 national political executives from 1875 to 2004. Seki and Williams’ (Reference Seki and Williams2014) Annual Government Partisanship data set includes measures of leaders’ political orientation (Right-Left), support for peaceful international relations (International Peace), and net support for military engagement with other countries (Hawk) based on the policy platforms of 398 political executives from 37 democracies between 1944 and 2004. The Heads of Government (HoG) project (Brambor and Lindvall Reference Brambor and Lindvall2018) codes leaders’ ideology as “left,” “right,” or “center” based on their economic positions and covers 1,199 leaders from 33 countries between 1870 and 2004. We identify the psychological willingness to challenge constraints of 42 leaders between 1937 and 1998 based on their underlying “need for power,” “task emphasis,” “distrust of others,” and “nationalism” with a measure developed by Keller (Reference Keller2005).
TABLE 1. Variables and Data Sources
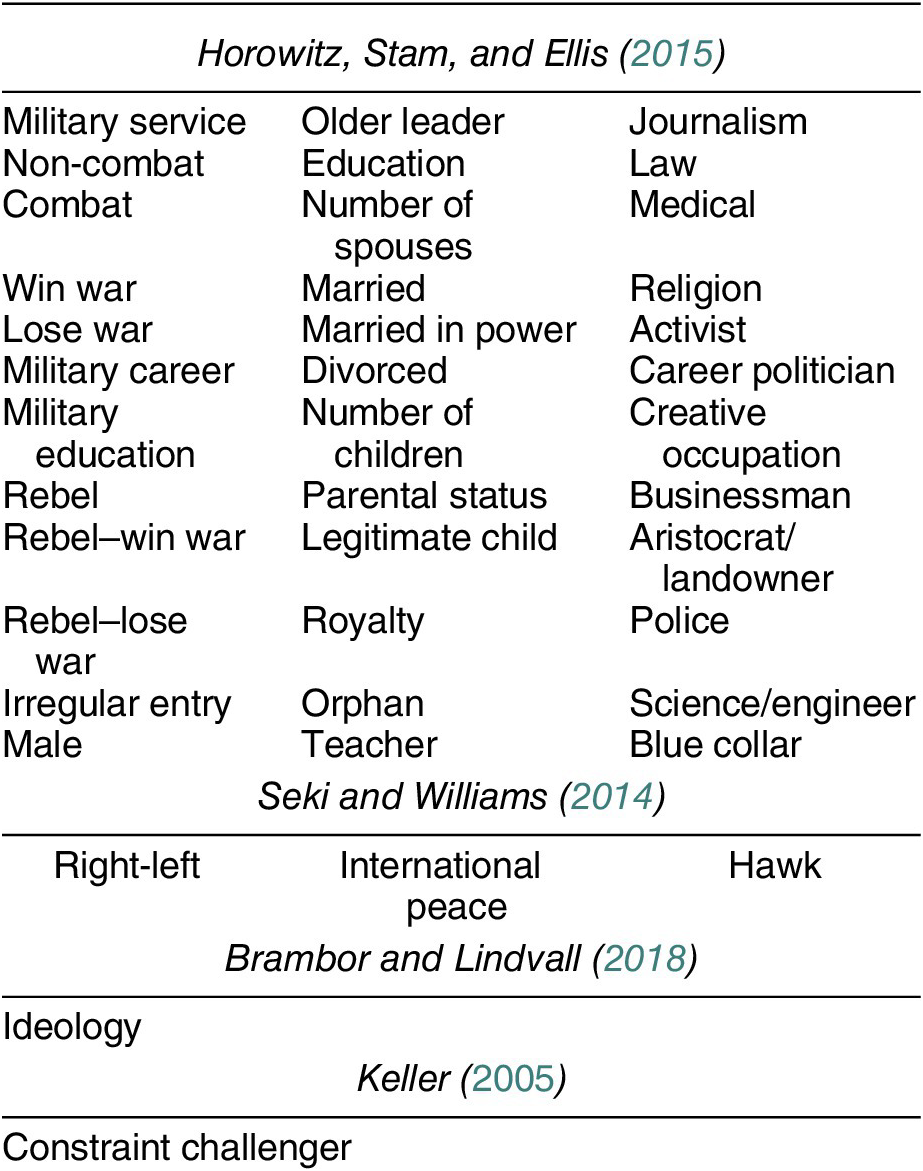
Figure 1 presents the number of leaders covered by each source. Leaders’ inclusion in multiple data sets is relatively rare. Indeed, the LEAD project is the only source of information for 1,638 leaders and only 10 leaders are covered by all four sources.

FIGURE 1. Leaders Covered by Each Data Set
International relations scholars increasingly use latent variable models to measure concepts that are not directly observable (e.g., Smith and Spaniel Reference Smith and Spaniel2020). For our purpose, the substantial variation in the availability of data on leaders’ personal attributes precludes the use of standard measurement models. We address this issue by estimating Bayesian item response theory models based on the broadly available data on leaders’ background characteristics that, when available, use the relatively sparse data on leaders’ political orientations and psychological traits as partially informative priors. We estimate four models of leaders’ latent hawkishness that differ in terms of the background experiences upon which the measures are based and whether the measures are influenced by leaders’ political orientation and psychological traits. Each model was estimated via RStan (Stan Development Team 2018), the R implementation of Stan (Carpenter et al. Reference Carpenter, Gelman, Hoffman, Lee, Goodrich, Betancourt, Brubaker, Guo, Li and Riddell2017), by running four Hamilton Monte Carlo chains with 2,000 iterations, half dedicated to “warmup.” Diagnostics revealed no estimation issues.
Our first model (M1) is a variation on the standard Rasch model and is based on the first eleven variables in the first column of the LEAD panel in Table 1 (Military Service-Irregular Entry). We refer to these background experiences as “theoretically relevant” or “risk related” as all are directly related to conflict and/or risk taking. The model takes the following form:
 $$ {\displaystyle \begin{array}{c}\Pr \left({Y}_{ij}=1\right)={logit}^{-1}{\upbeta}_j\left({\uptheta}_i-{\upalpha}_j\right)\\ {}\upalpha \sim \mathrm{N}\left(0,10\right)\\ {}\upbeta \sim \mathbf{Beta}\left(\frac{1}{2},\frac{1}{2}\right)\\ {}\uptheta \sim \mathrm{N}\left(0,1\right)\\ {}{\uptheta}_i\sim \left(\mathbf{X}\ \upepsilon +v\right),\end{array}}$$
where  $$ Pr\left({Y}_{ij}=1\right) $$ is the probability that the
  $$ ith $$ leader (
 $$ n=\mathrm{2,965} $$) has the
  $$ jth $$ background characteristic (
 $$ J=11 $$).
Most aspects of this model are common for use on student test score data—questions scored as correct (1) or incorrect (0)—in educational testing research. The  $$ logi{t}^{-1} $$ term represents the inverse of the logistic function. In the education tradition,
  $$ {\uptheta}_i $$ represents the ability of the student, and the
  $$ {\upalpha}_j $$ terms form cutpoints on the ability dimension around which the
  $$ {\uptheta}_i $$ terms float. Again in testing terminology, the
  $$ {\upalpha}_j $$ terms should increase in value according to the increasing difficulty of the questions. A good example from M1 is whether a leader previously served in the military. This is equivalent to the easiest question on a test, as relatively more leaders have prior military experience than have any of the other items in the model, and therefore is associated with a low
  $$ {\upalpha}_j $$. The
  $$ {\upbeta}_j $$ term is a discrimination parameter that takes high values on items that do well grouping similarly-situated leaders on the latent dimension (θ) to the right and left of the cutpoints (
 $$ {\upalpha}_j $$). Using the testing analogy,
  $$ {\upbeta}_j $$ is a weight that takes high values on questions that do well discriminating those who score high and low on the rest of the test. Our assignments of a normally distributed prior to α and a Jeffreys prior over a Bernoulli distribution to β are relatively common.Footnote 1
The model includes two priors on θ. First, θ is unit normal, which mitigates identification problems associated with scale invariance (Gelman and Hill Reference Gelman and Hill2007, 318). The second prior on θ is leader-specific and resolves a second identification problem (reflection invariance). This prior identifies two leaders as being on different sides of θ’s mean. Gelman and Hill (Reference Gelman and Hill2007, 318–319) illustrate this procedure using an item response theory model of U.S. Supreme Court voting (Bafumi et al. Reference Bafumi, Gelman, Park and Kaplan2005). In their model, ϵ is constrained to be positive and  $$ \mathbf{X} $$ is a vector of zeroes, save for two justices unambiguously on different sides of the ideological divide: Antonin Scalia (+1) and William Douglas (−1). We use Adolf Hitler (+1) and the Dalai Lama (−1), with all other leaders scored zero, to implement this prior. The coefficient (ϵ) is assumed unit normal and positive while the error term (υ) is assumed normal.
Our second model (M2) is based on the same risk-related background characteristics as M1. However, M2 expands M1 by including political orientation and psychological characteristic information. What differentiates the models is that M2 assumes  $$ \mathbf{X} $$ is a 2,965 × 6 matrix and ϵ is a 6 × 1 vector of coefficients. The additional structure emerges by treating the available political orientation and psychological trait data as leader-level priors over θ. These variables are first scaled unit normal and then treated in the identifying regression in accordance with the strategy described for M1 with respect to Hitler and the Dalai Lama: where information from a variable is nonzero, its value appears in the corresponding vector in the matrix (
 $$ \mathbf{X} $$).Footnote 2
Our third and fourth models are identical to M1 and M2, respectively, except for one feature: they estimate leader hawkishness as a function of all 36 variables from the LEAD project in Table 1. These models reflect the idea that incorporating information on a wide range of experiences produces better indicators of leaders’ willingness to use force (Horowitz, Stam, and Ellis Reference Horowitz, Stam and Ellis2015).
Figure 2 presents our four measures and reveals two noteworthy patterns. First, leaders generally appear to be more dovish with measures based on theoretically relevant experiences (M1 and M2) than with measures that consider a wider range of leaders’ background experiences (M3 and M4). This is because the holistic approach includes more background experiences that can identify a leader as relatively hawkish (e.g., whether (s)he was a teacher). Second, incorporating political and psychological trait information into the models has a larger influence on the measures produced with the theoretically motivated specification. This is most easily seen by looking at the distributions’ rug plots. These observations are consistent with a set of Kolmogorov–Smirnov tests of the equality of the four measures: the distributions of M1 and M3, M2 and M4, and M1 and M2, respectively, are significantly different from one another, but the distributions of M3 and M4 are not. Thus, our four measures differ as a function of the background experiences they are based upon and whether they are informed by leaders’ political and psychological characteristics.

FIGURE 2. Distributions of Latent Measures of Leaders’ Willingness to Use Force
Figure 3 reports the effects of leaders’ political and psychological traits on M2 and M4. Constraint Challenger and International Peace have more influence on leaders’ willingness to use force than do Hawk, Ideology, and Right-Left.

FIGURE 3. Effects of Political Orientation and Psychological Variables on M2 and M4 with 95% Credible Intervals
To provide a sense of how the information incorporated into each model can influence the estimates of individual leaders, Figure 4 presents the latent hawkishness (with 95% credible intervals) of two pairs of consecutive national leaders: British Prime Ministers Neville Chamberlain and Winston Churchill (Panel A) and U.S. Presidents Bill Clinton and George W. Bush (Panel B). Figure 4 reveals three important patterns. First, the estimates fit the conventional wisdom about each pair of leaders, with Churchill and Bush estimated to be more hawkish than Chamberlain and Clinton, respectively. Second, each of the four leaders considered here are estimated to be relatively more hawkish by the models based on a wider range of background experiences (M3 and M4) than the models based on risk-related experiences (M1 and M2). Third, incorporating information on leaders’ political and psychological traits influences estimates of their latent willingness to use force. This is most easily seen in the estimates of Clinton’s and Bush’s latent hawkishness yielded by M1 and M2. Allowing their respective political orientations and psychological willingness to challenge constraints to inform their latent hawkishness implies that Clinton is relatively more dovish and Bush is relatively more hawkish than when only their background experiences are considered (M2 vs. M1).
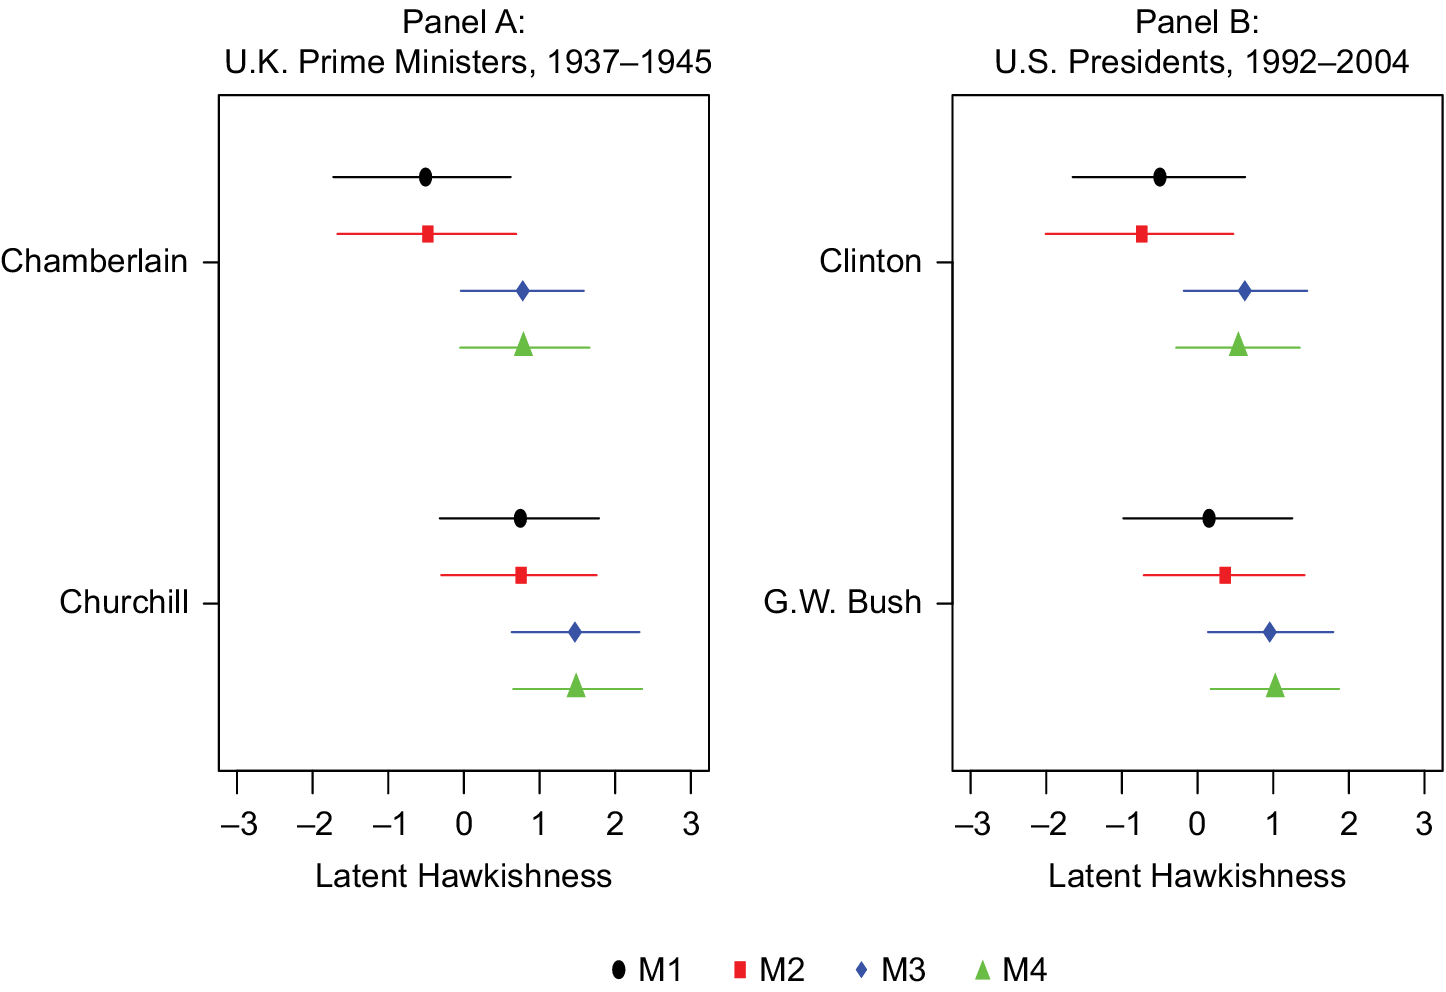
FIGURE 4. Latent Hawkishness of Neville Chamberlain, Winston Churchill, Bill Clinton, and George W. Bush with 95% Credible Intervals
Validation
We assess whether the differences in our measures influence their ability to predict interstate conflict with three dependent variables: the initiation of a crisis per the International Crisis Behavior (ICB) project (Brecher and Wilkenfeld Reference Brecher and Wilkenfeld1997), the initiation of any militarized interstate dispute (MID) (Ghosn, Palmer, and Bremer Reference Ghosn, Palmer and Bremer2004), and the initiation of a MID in which a state and its opponent used force.Footnote 3 We use Debs and Goemans’s (Reference Debs and Goemans2010) leader-year data set for our ICB analyses and the leader-year data set from Horowitz, Stam, and Ellis (Reference Horowitz, Stam and Ellis2015) for our MID analyses.
We compare our measures’ performances against a variable identifying whether a leader served in the military before obtaining office.Footnote 4 Prior military service is a good baseline for comparison, as it is “the single leader background experience most plausibly relevant to the initiation of military conflict” (Horowitz, Stam, and Ellis Reference Horowitz, Stam and Ellis2015, 130) and available for substantially more cases than variables identifying leaders’ political or psychological traits.
We formally evaluate the performance of our measures with a set of Vuong (Reference Vuong1989) tests, which assess the comparative fit of non-nested models. Table 2 reports the Vuong statistics associated with pairwise comparisons of bivariate logits with our four measures and prior military service, respectively, predicting interstate conflict initiation. Positive and significant Vuong statistics indicate the “column” model performed better than the “row” model while negative and significant Vuong statistics indicate the “row” model performed better than the “column” model.
TABLE 2. Vuong Statistics for Assessing Measures’ Performance
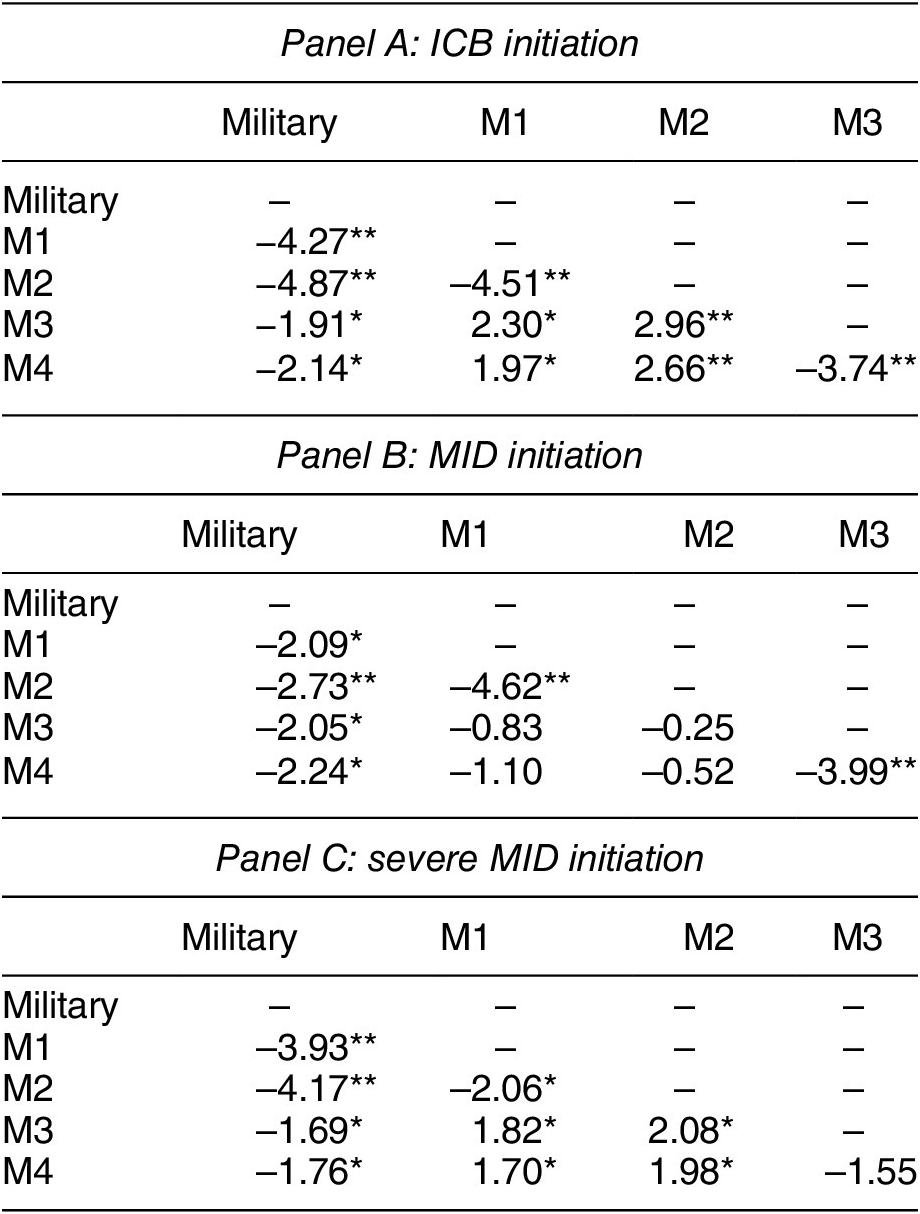
Note: *p < 0.05; **p < 0.01.
Our validation analyses suggest four important points. First, as all of the Vuong statistics in the first column of each panel are negative and significant, Table 2 indicates our measures do a better job at proxying leaders’ willingness to use force than prior military service. Vuong tests assess whether our measures offer a statistical improvement over prior military service when predicting conflict initiation, but they provide little insight with respect to the magnitude of the improvement. We therefore calculated the relative improvement in model fit (measured by Akaike information criterion statistics) that our best statistically performing measure (M2) offers over prior military service as compared with a null logit model for each of our three dependent variables. Compared with a null model, M2 offers a 104.2% relative improvement in model fit over prior military service when estimating the initiation of an ICB crisis, a 28.6% relative improvement when estimating MID initiation, and an 82.6% relative improvement when estimating the initiation of a severe MID. Thus, our measures offer statistically significant and substantively meaningful improvement over the existing proxy for leaders’ willingness to use force with the greatest spatial and temporal coverage.
Second, measures incorporating information about leaders’ political and psychological characteristics outperform measures based exclusively on leaders’ background experiences. One can see this by comparing M1 versus M2 (Row 3, Column 2) and M3 versus M4 (Row 5, Column 4) in each panel of Table 2. The Vuong statistic in each of these cells is negative and it is statistically significant in five of the six cells. This suggests measures of leaders’ willingness to use force incorporating information from multiple research traditions do a better job at predicting conflict initiation than measures derived from any single research tradition. Methodologically, these results demonstrate that our approach to incorporating sparsely available information into latent measures can improve indicators’ predictive validity.
Third, measures based on risk-related background experiences generally outperform measures built upon a wider range of experiences. The relevant comparisons here are between M1 and M3 (Row 4, Column 2) and M2 and M4 (Row 5, Column 3). M1 and M2 perform significantly better than M3 and M4, respectively, when estimating the initiation of interstate crises and severe MIDs, but we find no significant differences in their respective performances when estimating the initiation of all MIDs. These results imply measures based on leader experiences directly relevant to risk tolerance do a better job at predicting the initiation of disputes that involve military force than indicators based on a more holistic set of experiences.
Fourth, M2 is our best performing measure. M2 significantly outperforms prior military service and our other measures when predicting the initiation of an ICB crisis or a severe MID. M2 also outperforms prior military service and M1 and does not do statistically worse than M3 or M4 when predicting the initiation of all MIDs. M2 therefore strictly dominates all other measures when predicting the initiation of ICB crises and severe MIDs and weakly dominates all other measures when predicting all MIDs. Accordingly, our best performing measure of leader hawkishness is based on background experiences directly related to conflict or risk taking and incorporates information on leaders’ political and psychological characteristics.
Conclusion
Leaders’ willingness to use force is commonly used to explain foreign policy and conflict processes, yet no comprehensive measure of this concept with broad coverage constructed independently of leaders’ initiation of a conflict exists. We address this issue by using Bayesian Rasch-like models to develop measures of latent hawkishness for 2,965 leaders between 1875 and 2004 based on their background experiences, political orientation, and psychological willingness to challenge constraints. Our approach produces measures that improve upon existing indicators in multiple ways and introduces a method of incorporating sparse information from multiple data sources into measurement models that should prove useful to scholars estimating latent variables when substantial variation in data coverage exists.
Our measures will allow scholars to analyze a range of relationships among political leaders, international relations, and domestic politics. Yet, they should not be used uncritically. Broadly speaking, we see our measures being most useful for research focused on how having relatively hawkish or dovish leaders influences political outcomes or how the political consequences of some outcomes might vary as a function of incumbents’ hawkishness. In contrast, it will be challenging to make credible inferences about the nonrandom selection of hawkish or dovish leaders or how potential hawkish or dovish successors might influence conflict outcomes with our raw measures. Analysts also should bear in mind that our measures are estimates of leaders’ latent hawkishness. The uncertainty associated with our estimates should be accounted for when the measures are used in statistical models.Footnote 5 Importantly, this uncertainty also can be used to analyze how incomplete information over leaders’ willingness to use force influences conflict processes.
An important feature of our framework is that it allows others to easily generate measures of leaders’ latent hawkishness. We think there are six things scholars should consider when seeking to improve upon our measures. First, our validation analyses suggest scholars are likely to improve upon our measures by adding variables that have a clear link to leaders’ willingness to use force. Second, experimenting with whether variables enter into the model via leader-level priors or as manifest indicators might yield stronger measures. Third, analysts can alter all of the assumptions used to produce our measures. For example, modeling the latent variable with a nonnormal distribution or directly modeling the covariance between the item-level terms might produce more predictive measures. A fourth extension would be to allow leaders’ latent hawkishness to change over the course of their tenures. The largest challenge to this is the lack of systematic time-varying indicators independent of conflict involvement. Fifth, analysts could allow relationships between the latent variable and manifest variables to vary by contextual factors. Finally, we strongly believe additional data on leaders’ psychological traits will allow analysts to construct better measures of leaders’ latent willingness to use force.
Supplementary Materials
To view supplementary material for this article, please visit http://dx.doi.org/10.1017/S0003055420000313. Replication materials can be found on Dataverse at: https://doi.org/10.7910/DVN/7WFX1K.


Comments
No Comments have been published for this article.