


Introduction
Historical backdrop
Bengal Chemicals and Pharmaceuticals Ltd. (BCPL), formerly known as Bengal Chemical and Pharmaceutical Works Ltd., was established on April 12, 1901, by eminent scientist and entrepreneur Acharya Prafulla Chandra Ray which is the first Chemical and Pharmaceutical Company in India. From humble beginning with one factory at Maniktala (Kolkata) in 1905, three more factories were established – one at Panihati (North 24 Parganas District of West Bengal, India) in 1920, one in Mumbai (Maharastra State, India) in 1938, and one in Kanpur (Uttar Pradesh State, India). In 1949 the company had formed its Registered Office at 6, Ganesh Chunder Avenue, Kolkata (previously Calcutta), West Bengal State, India. Besides, the company was having 11 sales outlets and ten C&F (clearing and forwarding) agencies spread all over India. In the initial stage the company started manufacturing quality chemicals, drugs, pharmaceuticals and home products, employing indigenous research and development (R&D), skill, and raw materials.
Innovation and intellectual property rights (IPR) protection in India
Intellectual property is a property that arises from human intellect. It is a product of human creation. Patent is an important arena of IPR which is conferred on the inventor (the patentee) for enjoying exclusive rights to prevent others from using their innovation. In India, the concept of patent protection, which originated in 1856, finds its eventual place in the Indian Patent Act, 1970.
Up until 2005, the Act only applicable for process patents for certain industries such as food, pharmaceuticals, and chemicals; and abolished product patents in these sectors completely. However, in 2005, India amended the Act to reintroduce the product patent regime so as to meet its obligations under the Agreement for Trade Related Aspects of Intellectual Property Rights (TRIPS). India, along with other developing countries, attempted to incorporate TRIPS flexibilities in their domestic law for fostering innovation in Indian soil.
New Chemical Entity (NCE) and drug innovation
An NCE is a molecule developed by an innovator company in the early drug discovery stage, which after undergoing subsequent clinical trials could translate into a drug that could be a treatment for some known or unknown diseases to cater the unmet needs of the needy patients suffering from different diseases and disorders. Synthesis of an NCE is the first step in the process of drug development. Once the synthesis of the NCE has been completed, companies have two options before them. They can either go for clinical trials on their own or license the NCE to another company. In the latter option, companies can avoid the expensive and lengthy process of clinical trials, as the licensee company would be conducting further clinical trials and subsequently launching the drug in the market place. Companies adopting this model of business would be able to generate high margins in the form of as they get a huge one-time payment for the NCE as well as entering into a revenue sharing agreement with the licensee company. Under the Food and Drug Administration Amendments Act of 2007, all new chemical entities must first be reviewed by an advisory committee before the US Food and Drug Administration (USFDA) can approve these products.
Drug innovation and Indian pharmaceutical industry (IPI)
The global pharmaceutical market is changing rapidly due to pressure on prices, drying pipelines, and increasing costs of drug development. This is forcing the industry to produce new models with efficiency and profitability. Blockbuster models no longer seem to be the future of pharmaceutical industry, instead future lies in the novel drug delivery systems, expanding label indications, partnerships, and entering the new emerging markets. With the support of Government of India's (GOI) different initiatives such as Atal Innovation Mission (AIM), tax exemption, duty free imports, and many others, innovation is fostering in the Indian pharmaceutical sector. With “Make in India” (GOI initiative) philosophy, Indian pharmaceutical companies are focusing on “Innovate in India and Sale to the World” concept and constantly taking endeavor for conducting different R&D activities to provide innovative healthcare solutions. Growing Indian companies' ability in biology, chemistry, and genetics coupled with low cost clinical trial operability is making India a favored destination for drug discovery and outsourced R&D. This process has progressed significantly since 2005, when India became WTO/TRIPS compliant and started recognizing product patents.
Drug innovation and business sustainability
Business sustainability is often defined as managing the triple bottom line – a process by which companies manage their financial, social and environmental risks, obligations, and opportunities. These three impacts are sometimes referred to as profits, people, and planet.
Nidumolu (September 2, Reference Nidumolu2009) in his interview published in The New Work Times blog defined business sustainability as “A mind-set of sustainability = innovation” which is essential for making a real transition to this new economy.
There are a number of Indian pharmaceutical companies engaged in various types of drug discovery such as lead generation, target identification, and conducting safety and toxicological studies. Although Indian companies are cashing in on the outsourcing opportunity, innovation of new drugs is the way forward for the pharmaceutical industry. Considering the current situation, Indian companies are trying their level best with the help of GOI schemes to produce a new molecular entity (NME) as well as based on their own research efforts backed by the state-of-the-art infrastructure. The Indian pharmaceutical companies have also learnt the art of patience for investing quality time of 10–12-year-long period of drug discovery by deploying qualified scientists with the required skills for providing innovative healthcare solution to the needy patient.
Indian pharmaceutical companies in the recent times have increased spending on R&D specifically in specialty drugs and complex generics. This trend has been prominent in top drug makers such as Sun Pharma, Dr. Reddy's, Lupin, as these drugs are expensive to develop. These specialty drugs are used to treat complex conditions such as cancer, multiple sclerosis, and rheumatoid arthritis. Ideally these drugs entail investments of US$5 million as against US$1–2 million for developing simpler dosage forms. Investments are just however, only one part, with commercialization being the other key component. Therefore, acquisitions have been the natural choice for companies. Pharma companies have been making acquisitions in USA, Europe, and Japan to cut time to bring these specialized products to market.
Research and development (R&D) activities of Indian pharmaceutical companies for business sustainability
The Indian pharmaceuticals market is the third largest in terms of volume and 13th largest in terms of value, and it accounts for 20% in terms of volume and 1.4% in terms of value of the global pharmaceutical industry. IPI is the largest provider of generic drugs globally with the Indian generics accounting for 20% of global exports in terms of volume. The Indian pharmaceutical market size is expected to grow to US$100 billion by 2025, driven by increasing consumer spending, rapid urbanization, and raising healthcare insurance among others.
The country also has a large pool of scientists and engineers who have potential to take forward the industry to an even higher level and this R&D task force is constantly dedicating their lives to search for the answer of unanswered questions for providing innovative healthcare solutions for meeting the unmet needs of needy patients. Some accomplishments of the IPI are as follows:
(a) Presently more than 80% of the antiretroviral drugs used globally to combat AIDS (Acquired Immune Deficiency Syndrome) are supplied by Indian pharmaceutical firms.
(b) The UN-backed Medicines Patent Pool has signed six sub-licenses with different reputed Indian pharmaceutical companies Aurobindo, Cipla, Desano, Emcure, Hetero Labs, and Laurus Labs, which has enabled them to make generic anti-AIDS medicine Tenofovir Alafenamide (TAF) for 112 developing countries.
(c) Some of the well regarded Indian pharmaceutical companies received 55 Abbreviated New Drug Application (ANDA) approvals and 16 tentative approvals from the US Food and Drug Administration (USFDA) in Q1 of 2017. The USFDA approvals are expected to cross 700 ANDA in 2017, thereby recording a year-on-year growth of 17%. The country accounts for around 30% (by volume) and about 10% (by value) in the US$70–80 billion US generics market.
Business in the US market has suffered by most of the pharma companies due to pricing pressure and currency fluctuations, with the shift toward increased spending on R&D being natural. For the duration of the past 6 years, the R&D spending by top Indian pharmaceutical companies grew by three–six times in comparison with sales which rose by two–four times. For the financial year 2017–18, expected R&D investments of some reputed Indian pharmaceutical companies are provided here.
From Table 1 we can visualize that Sun Pharma will approximately have an R&D expenditure of 10–11% of sales, while Lupin is likely to incur expenditure to the tune of 14–15% of sales on R&D. Cipla's R&D is expected to reach 14–15% of sales, Dr. Reddy's expected spending would be to the tune of about 12–13% of sales on R&D whereas Aurobindo Pharma will be spending around 10–11% of its sales on R&D in the financial year 2017–2018. Indian R&D centric pharmaceutical companies are also increasing expenditure on manufacturing capacities. Some of the endeavors taken by India's leading pharmaceutical companies toward innovation through R&D infrastructural development are presented in Table 2.
Table 1. Pharmaceutical company-wise R&D expenditure allocation

Source: Company-wise Annual Budget Plan.
R&D Expenditures are calculated based on the predictive sales of the companies as per the budget plan.
Allotted R&D Expenditure has been collected from the company's annual budget plan.
Table 2. R&D infrastructure development type (company-wise)

Source: Company-wise annual reports.
From Table 3 we can visualize in greater detail what types of R&D activities are performed by the Indian pharmaceutical companies for bringing innovation and market the innovative healthcare solution across the world. This trend toward development and marketing specialty drugs would be the next step for Indian pharmaceutical companies to move ahead in the value chain with good returns for ensuring business sustainability.
Table 3. Description of R&D activities and Research breakthrough (company-wise)
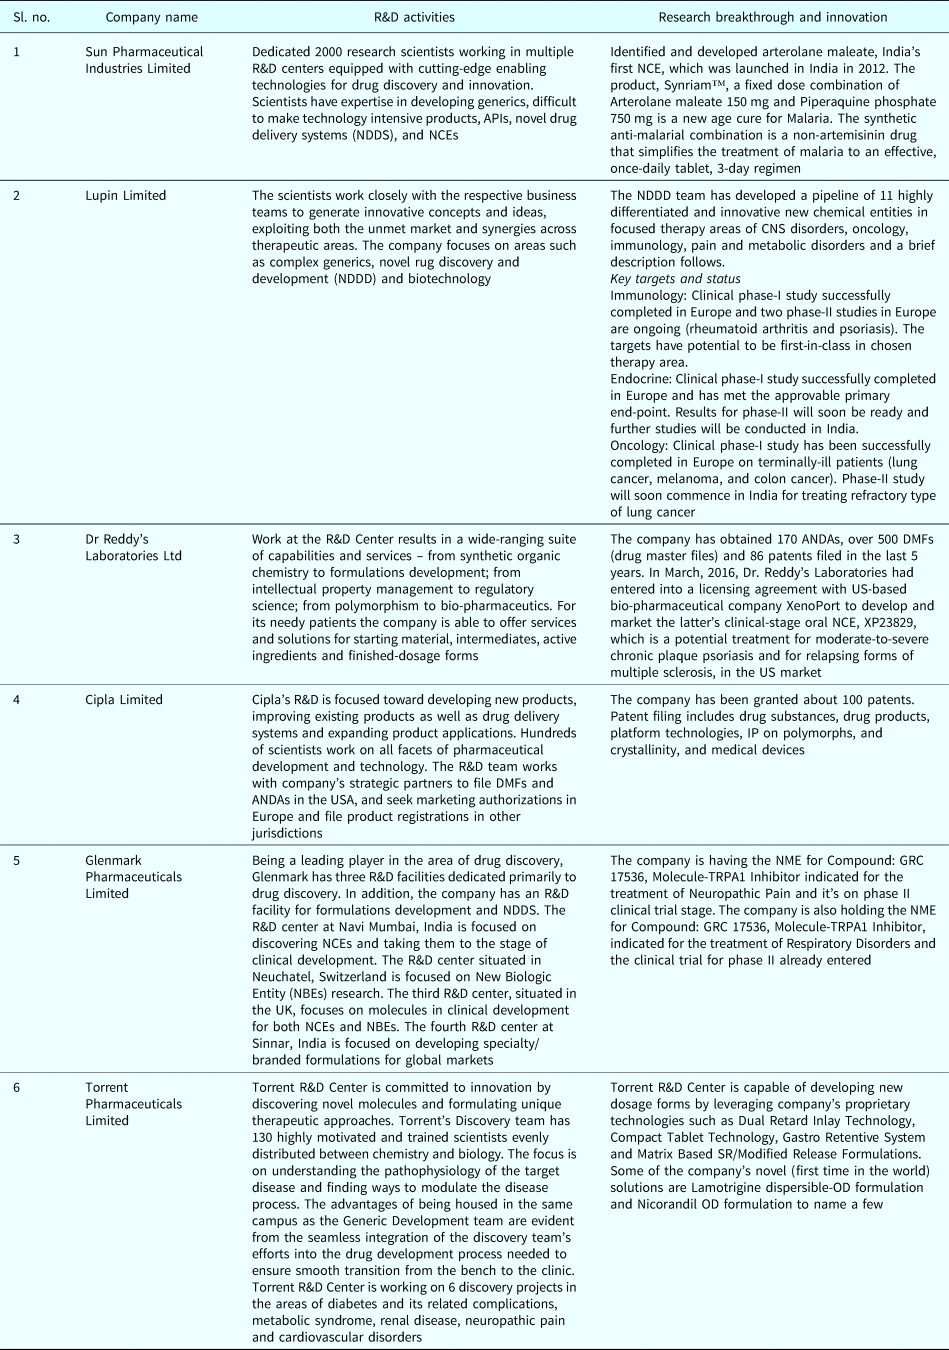
Source: Company-wise websites.
Review of literature
A number of literature studies have been conducted to serve our purpose out of which a few have been mentioned as under. Prior studies have shown the relationship between “Innovation” and “Business Sustainability”.
The study performed by Hayes and Abernathy (Reference Hayes and Abernathy1980) explains their point of view that in order to succeed, the firms have an organizational commitment to compete on technological grounds. The firms therefore should offer superior products to earn profits in the long run.
Erickson and Jacobson (Reference Erickson and Jacobson1992) in their study confirmed that innovation plays a significant role in gaining an edge over current and potential competitors of the firms. The specific nature of R&D expenses for brining innovation would determine its advantage. Innovation enables the firms to prevent imitation by the rivals and earn adequate or above average profits which ensures business sustainability.
Bhagwat et al. (Reference Bhagwat, DeBruine and Gondhalekar2001) in their study experienced that a 1% increase in R&D investment resulted in one-quarter percent increase in earnings per share (EPS) for publicly traded pharmaceutical companies for the period 1989–98 in USA.
Drucker (Reference Drucker2002) wrote in his seminal work that the basic function of a business is to bring innovation to earn profits. Thus, in order to gain a competitive edge, more resources should be spent on R&D activities for brining innovation which enables the organizations to enjoy business sustainability.
Shankaran (Reference Shankaran2016) made a comparative study between the Indian origin pharmaceutical companies and multi-national companies (MNCs). In his study he had considered return on assets (ROA) and return on equity (ROE) as explanatory variables. The study shows that Indian companies are becoming more aggressive to be at par with MNCs.
Cooper et al. (Reference Cooper, Gulen and Schill2008) in their study have shown a significant positive relationship between investment in R&D and future returns in the accounting literature. Most studies in accounting and finance explained a positive relationship between investment in R&D and future returns toward business sustainability.
Ray and Chittoor (Reference Ray and Chittoor2007) in their study propose a conceptual model of internationalization for emerging economy firms through a combination of exploitation and exploration strategies through new products and new markets in the context of liberalized economies.
Cooper in his study experienced a positive relationship between R&D investments and firm earnings.
The research work conducted by Ehie and Olibe (Reference Ehie and Olibe2010) showed that after controlling for firm size, industry concentration, and leverage, R&D investment positively affects firm performance.
Wang (Reference Wang2011) in his study confirmed that the level of performance of a firm will be a function of its resources of R&D activities. The firms which allocate higher R&D expenditures are expected to earn more than those that do not.
A study conducted by Kiran and Mistra (Reference Kiran and Mistra2011) focuses on the changed scenario due to Amended Patent act 2005. Researchers have clearly mentioned that Indian pharmaceutical companies have understood the need of research activity to survive in market and nowadays most of them are changing from imitation to innovation by increasing R&D activity to sustain in the market place.
In a study conducted by Christina Sheela and Karthikeyan (Reference Christina Sheela and Karthikeyan2012) found that Cipla pharmaceutical Company's financial performance is high, followed by Dr Reddy's Laboratories and then Ranbaxy Pharmaceutical. The three companies are significant at their level. In conclusion, researchers have expressed that ROE and return on investment are the most comprehensive measure of profitability of a firm.
Kafouros and Forsans (Reference Kafouros and Forsans2012) in their study explain that the knowledge acquisition from foreign countries results in superior performance and assists firms in unlocking their innovation potential.
In a study, Donelson and Resutek (Reference Donelson and Resutek2012) have expressed that the level of R&D and the changes in it are not related to the profits. From the perspective of an investor, R&D costs are thought of as an expense whereas in reality, these are the investments which will generate future revenues in the form of profits.
Atalay et al. (Reference Atalay, Sarvan and Anafarta2013) in their study have found that technological innovation has significant and positive impact on firm performance in Turkish automotive supplier industry.
Rao et al. (Reference Rao, Yu and Cao2013) in their study discuss that nowadays, technique innovation is the precondition that companies, especially technology intensive companies, can survive and progress further followed by an investment effect analysis with empirical method and comparative method on the technique innovation in the context of China and Japan.
In the study conducted by Tyagi et al. (Reference Tyagi, Mahajan and Nauriyal2014) recommends encouragement to public-private R&D partnership in the realm of basic and applied research, which could be commercially harnessed by the interested private sector partner(s).
Zambad and Londhe (Reference Zambad and Londhe2014) in their study discuss the amended patent act and its effect on Indian pharmaceutical companies with respect to innovation.
Ayaydin and Karaaslan (Reference Ayaydin and Karaaslan2014) in their study focused their investigation on the study of the effect of R&D investment on firm's financial performance. The authors have used ROA as a measure of financial performance. Their study have revealed the positive effect of R&D intensity on the firm performance by using Generalized Method of Moments (GMM) system estimators for a sample of 145 manufacturing firms registered BIST for the period of 2008–2013 with respect to manufacturing firms in Turkey.
Xin (Reference Xin2015) in his study has found that technologically innovative products have a statistically significant positive effect on operating performance.
A study by Geoffrey and Pal (Reference Geoffrey and Pal2015) investigates the R&D impact on the financial value of the company. Their study focuses on the relationships between R&D and earnings, operational performance, revenue growth, and market value. Their study also includes the empirical analysis using a sample of 103 companies which registered high values of R&D, between 1979 and 2013. Overall, researchers have assumed a positive impact of R&D on the corporate value, using a new variable that includes both decision and outcome features.
Nandy and Pal (Reference Nandy and Pal2017) in their study established that R&D activities create significant impact on the financial performance of MNCs pharmaceutical companies operating in India. In their study they had measured financial performance through ROA and had used research and development intensity (RDI) and advertising and marketing intensity (AMI) as independent variables (IV). With the help of panel regression analysis the authors found the significant positive impact of RDI and AMI on ROA and the effect was statistically significant at 5% level and 1% level, respectively.
Jui et al. (Reference Jui, Yen, Cheng and Chieh2017) in their study entitled have explored that the firms with a high level of innovative energy have better stock returns and net sales, but such firms do not have an advantage in terms of operating income. The empirical results of their study indicate that higher R&D expenses increase operating costs which, in turn, decreases operating income despite increased net sales.
Freihat and Kanakriyah (Reference Freihat and Kanakriyah2017) in their study empirical study have incorporated simple linear regression analyses to discover the effect of R&D on company performance. The authors have used ROA, ROE, and EPS as a proxy to measure company performance, and to measure R&D expenditure we considered the following items: research, experiments, studies, and courses. They have found that there is a significant impact of R&D expenditure on company performance as measured by ROA, ROE, and EPS, which is consistent with the results for developed countries.
Research gap
All prior studies indicate that there is an impact of R&D activities on the financial performance of the pharmaceutical companies. But, none of the studies so far conducted has established the link between “Innovation” and “Business Sustainability” and hence we are taking an endeavor for further study to bridge the gap between “innovation” and “business sustainability” by establishing a link between the two in the context of IPI.
Theoretical foundation of study
Innovation can be a catalyst for the growth and success of business organization, and helps the organizations to adapt and grow in the marketplace. Being innovative does not only mean inventing. Innovation can mean changing the business model and adapting to changes in the environment to deliver better products or services. The successful exploitation of new ideas is crucial to a business being able to improve its processes, bring new and improved products and services to market, increase its efficiency and, most importantly, improve its profitability. The profitability can also be in the form of ROA or ROE. Emerging markets like India are facing rapid growth of chronic “Western” diseases such as diabetes, hypertension, chronic respiratory problems, cancer, heart disease, and neurological disorders. In some cases, conditions such as diabetes are turning into near-epidemic situations. In India, for example, the prevalence of diabetes and cancer is projected to rise in many fold in the years to come. In the current scenario, innovation is the need of the hour in the IPI, having the large and diverse patient pool, rising cost of treatments, and increasing risk factors of chronic diseases due to changing lifestyles in emerging countries like India. The GOI and the IPI have both shown growing focus to boost innovation. Multiple initiatives by the GOI to boost innovation and protect IPR and the increasing R&D spend by the corporate segment highlight this.
The framework pertains to theoretical foundation of the study is shown in Figure 1.

Fig. 1. Innovation and business sustainability framework (IBSF)
From Figure 1 we come to know that, in IPI, R&D activities are undertaken for the purpose of the innovation. An innovative healthcare solution is extremely helpful for taking care of the unmet healthcare needs where the speedy recovery of different diseases and disorders of needy patient fraternities are being ensured. It is possible to market innovative healthcare solution for the benefit of society at large. As a result Indian pharmaceutical companies adapting R&D activities for bringing “innovation” is for catering the contemporary healthcare needs as well as enjoying the satisfactory financial returns which has been measured in the form of ROA and ROE in our study. Satisfactory financial returns always acts as a catalyst to help the organization to continue its business operation in the long run which basically ensures “business sustainability”.
Objective of the study
The objective of our study is mentioned as follows:
(1) To investigate how innovation is taking place through R&D activities of listed Indian pharmaceutical companies to provide innovative healthcare solution.
(2) To establish the relationship between innovation and business sustainability with financial performance of listed Indian pharmaceutical companies.
Hypotheses
We are interested in observing whether innovation is having any relation with business sustainability or not. “Innovation” is measured by R&D expenses and “business sustainability” is measured by financial performance.
With respect to the research presented above, we propose the following hypotheses.
Hypothesis 1:
Innovation and business sustainability (IBS) with respect to ROA.
H01:
Innovation has no relation with ROA.
H11:
Innovation has relation with ROA.
Hypothesis 2:
Innovation and business sustainability (IBS) with respect to ROE.
H02:
Innovation has no relation with ROE.
H12:
Innovation has relation with ROE.
Research methodology
A research methodology is the specification of methods and procedures for acquiring the information needed. It is the over-all operational framework of a study that stipulates what information is to be collected from which sources and by what procedures. Complete stepwise procedures what we have followed during the study have been discussed in the following as per the systematic order.
Data collection
The study is based on the secondary data only. The data relating to sales turnover, market capitalization, R&D expenses, advertisement and marketing expenses, capital intensity, leverage ratio, and operating expenditure to total assets ratio pertain to Indian pharmaceutical companies listed in India's National Stock Exchange (NSE) have been collected from different sources as mentioned in Table 4.
Table 4. Secondary data sources

Source: Different Secondary Data Collection Sources.
The name of Indian pharmaceutical companies considered for the study is shown in Table 5.
Table 5. List of Indian pharmaceutical companies

Source: Capital Market Publishers India Ltd. Database.
Sampling technique and sample size
In our study total number Indian pharmaceutical companies have been considered as population size. After a careful overview of the annual reports of different pharmaceutical companies, we have identified 115 Indian pharmaceutical companies. Amongst them we have found that 37 Indian pharmaceutical companies have been incurring R&D expenditure regularly for brining innovation and ensuring business sustainability. Thus we consider 37 Indian pharmaceutical companies for our study based on the stratified sampling technique.
Study period
We have selected the study period from 1995 to 2015 for the following reasons.
(a) To develop a NME or NCE as part of R&D activities, long duration is required. Most of the time it takes approximately 15–20 years.
(b) In 2005, India fully implemented the product patent regime in the country and The Patents (Amendment) Act, 2005 is the third of three amendments to the Patents Act of 1970, to bring India's patent regime into compliance with the WTO (World Trade Organization) TRIPS (Trade Related Intellectual Property Rights) Agreement.
(c) To obtain better measure of “innovation” through R&D activities on “business sustainability” through financial performance during pre-patent amendment and post patent amendment period as well as to get the combined effect.
Variables specification and empirical model
Variable specification
To establish the relationship between “innovation” and “business sustainability” we have used the following variable names under the purview of dependent variable (Y), independent variable (X), and control variable (X). Nomenclature of the variables with detailed explanation is provided in Table 6.
Table 6. Description of different variables used in the study

Variable Description Source: Evidence from Existing Literatures.
From Table 6 we come to know the details of the variables which we have used in our study.
Empirical model
We are proposing herewith two different empirical models by incorporating all dependent, independent, and control variables which have been considered for our study and already discussed in detail in the previous section.
The two different empirical models of our study are as follows:
 $${\rm RO}{\rm A}_{{\rm it}} = \alpha + \beta _1{\rm RD}{\rm I}_{{\rm it}} + \beta _2{\rm AM}{\rm I}_{{\rm it}} + \beta _3{\rm C}{\rm I}_{{\rm it}} + \beta _4{\rm L}{\rm R}_{{\rm it}} + \beta _5{\rm OE}{\rm R}_{{\rm it}} + E_{{\rm it}}\comma \,$$
 $${\rm RO}{\rm E}_{{\rm it}} = \alpha + \beta _1{\rm RD}{\rm I}_{{\rm it}} + \beta _2{\rm AM}{\rm I}_{{\rm it}} + \beta _3{\rm C}{\rm I}_{{\rm it}} + \beta _4{\rm L}{\rm R}_{{\rm it}} + \beta _5{\rm OE}{\rm R}_{{\rm it}} + E_{{\rm it}}\comma \,$$
where ROAit, Return on Assets; ROEit, Return on Equity; RDIit, Research and Development Intensity; AMIit, Advertisement and Marketing Intensity; CIit, Capital Intensity; LRit, Leverage Ratio; OERit, Operating Expenditure to Total Assets Ratio; and E it, error term.
Statistical tools and techniques
For the accomplishment of the research objective we have used the following statistical tools and techniques for data analysis and interpretation:
(A) Descriptive Statistics
(B) Correlation Matrix and
(C) Regression Analysis
We have used Application Software STATA 12 for data analysis. The complete data analysis and results are discussed in the following section.
Data analysis and results
After collecting cross-sectional and time series data from the sample, a strongly balanced panel dataset has been arranged for the analysis of our study. After that, descriptive statistics has been presented as per the following for all DV, IV, and CV to know the nature of sample properly.
Now, with the help of correlation matrix we will be able find out the presence of partial correlation if any and through variation inflation factor (VIF) result we can ensure the presence of multicollinearity in our strongly balanced dataset. These two diagnostic tests result would enable us to include the variables which are having less VIF values (<0.10) and have less (<0.80) partial correlation and finally with these tests result we will take forward the study.
In the next stage multivariate regression analyses have been performed by incorporating the dependent variables (Ln_ST and Ln_MC) one by one. In our study, we have applied two models associated with panel data analysis and the models are:
(a) fixed effect model (FEM) and
(b) random effect model (REM)
In last stage we have applied the Hausman specification test (popularly known as Hausman test) for selecting the appropriate model of panel regression analysis between FEM and REM and the detailed interpretation of the appropriate model as per the Hausman test has been discussed in our study.
Descriptive statistics
In this section we have dealt with the basic statistical values of the variables which are calculated. In our study we have applied descriptive statistics to describe the basic features of the data. With the help of descriptive statistics we also come to know the simple summaries about the sample and the measures.
Table 7 reveals the complete description of 777 observations which is the product of 37 Indian pharmaceutical companies for the period of 21 years (from 1995 to 2015). The average amount of R&D expenditure for brining innovation toward providing innovative healthcare solution, deployed by the sample Indian pharmaceutical companies is 0.76 crore. There is a wide variation in case of R&D expenditure where the minimum amount is 0.22 crore and maximum amount is 1.39 crore. This dispersion is also supported by standard deviation of 0.29 crore. We can observe that the sample Indian pharmaceutical companies are incurring 2.37 times less in the areas of advertising and marketing expenditure in comparison with R&D expenditure since the average advertising and marketing expenditure is 0.32 crore. In case of AMI the values are highly spread with minimum of 0.22 crore and maximum of 0.55 crore where the standard deviation is 0.07 crore. The average amount of capital intensity employed by the sample companies is 0.31 crore. The values of CI is also dispersed where the minimum is 0.06 crore and maximum is 5.22 crore and this dispersion is well supported by standard deviation 0.72 crore. The sample Indian pharmaceutical companies also utilized leverage ratio 56.94% where minimum is 0.26 and maximum is 1.07. In case of LR the dispersion is supported by standard deviation 0.22. The sample Indian pharmaceutical companies have employed operating expenditure with an average spending amount of 0.35 crore and this spending is highly dispersed where the minimum spending is 0.01 crore and maximum spending is 5.79 crore. This OER spending dispersion is also supported by standard deviation 0.62 crore. By deploying R&D expenditure and different other expenditures, the sample companies can find the path of business sustainability by obtaining favorable financial performance with respect to ROA as 88.38% and ROE as 100.89% for the study period. This type of exceptional financial performance can well be anticipated when different listed Indian pharmaceutical companies takes risks and spends substantial amount of R&D expenditure for brining innovation toward enjoying business sustainability with high margins.
Table 7. Descriptive statistics of different variables (DV, IV, and CV)

Source: Authors processing in Stata Software (Version-12).
Bivariate correlation matrix
Bivariate correlation is the analysis of the relationship between the two variables and the bivariate correlation matrix will help us know the existence of partial correlation in our dataset if any. Before conducting our panel regression analysis we are using bivariate correlation matrix as an econometric test to ensure that there is no serial correlation (>0.80) in our strongly balanced panel dataset.
The bivariate correlation matrix is shown in Table 8.
Table 8. Bivariate correlation matrix for pair-wise correlation

Source: Authors processing in Stata Software (Version-12).
*Denotes at the 5% level of significance.
From the bivariate correlation matrix presented in Table 8, we can find the bivariate correlation between DV versus IV and CVs. In this bivariate correlation matrix financial performance related DV are ROA and ROE which basically ensures business sustainability. RDI is an IV which has been used to measure innovation in our study and the CV which we have used for our study are AMI, CI, LR, and OER for the robustness of the test. In our strongly balanced dataset there is no serial correlation found since all the correlation coefficients in the abovementioned bivariate correlation matrix falls <0.80. We can find that ROA is having significant positive correlation with RDI, AMI, CI, LR, and OER. We have also observed that RDI, AMI, CI, LR, and OER are having statistically significant positive correlation with ROE. All coefficient estimates are statistically significant at the 5% level. Overall this bivariate correlation matrix is favorable for the study.
Variation inflation factor (VIF)
The VIF and tolerance are both widely used measures of the degree of multicollinearity of the ith IV with the other IVs in a regression model. VIF measures how much variance of the regression coefficient is inflated by multicollinearity.
In our study, we would like to perform VIF as an econometric test before running the panel regression model. In this econometric test we want to ensure that our strongly balance panel data set is totally free from multicollinearity and the test has applied for all explanatory variables (IV and CV) taken for our study.
From Table 9 we have observe the VIF values of RDI, AMI, CI, LR, and OER are 1.66, 2.25, 1.67, 1.12, and 2.28 respectively. All VIF values are <4 and are nowhere near to the rule of thumb (the maximum acceptable cut-off value for the VIF is 10 and minimum cut-off value for tolerance that is, 1/VIF is 0.10 as per the different econometric literature studies available). For our study all the variables RDI, AMI, CI, LR, and OER will be considered since all these variables are free from multicollinearity as per VIF Result.
Table 9. VIF test results for multicollinearity

Source: Authors processing in Stata Software (Version-12).
Empirical model and panel data multivariate regression analysis for empirical model-1
After testing the multicollinearity problem in our independent (IV) and CV we have applied FEM and REM taking all two DV ROA and ROE of our study one after another. At first we will run the following empirical model-1 by incorporating ROA as DV:
 $${\rm RO}{\rm A}_{{\rm it}} = \alpha + \beta _1{\rm RD}{\rm I}_{{\rm it}} + \beta _2{\rm AM}{\rm I}_{{\rm it}} + \beta _3{\rm C}{\rm I}_{{\rm it}} + \beta _4{\rm L}{\rm R}_{{\rm it}} + \beta _5{\rm OE}{\rm R}_{{\rm it}} + E_{{\rm it}}.$$
Table 10 shows the result of panel regression analysis taking ROA as a DV.
Table 10. Panel regression results under FEM and REM (Y = ROA)

Source: Authors processing in Stata Software (Version-12).
***Denotes significant at 1%, **at 5% and *at the 10% level of significance.
From Table 10 we can find panel data regression results for both FEM and REM under empirical model-1. We have carried out the Hausman test in order to have a robust selection between FEM and REM. The result of Hausman test is shown in Table 11.
Table 11. Hausman test results for appropriate model selection

Source: Authors processing in Stata Software (Version-12).
From Table 11 we can visualize the p value of χ2 is 0.09 which is >0.05 or 5%. Since p value of χ2 is >0.05 or 5%, the result is statistically insignificant and the null hypothesis (H0) is accepted and the alternate hypothesis (H1) is rejected. Finally REM is found to be most appropriate for the panel dataset used in our study.
The results of REM are as follows.
The value of χ2 is 1.48 and its corresponding p value is 0.00 (<0.05) which means that the model is good fit for interpretation. The value of R 2 is 1.00. It signifies that the model can predict 100% variability. Explanatory variable: RDI is having positive effect on ROA and the effect is statistically significant at the 1% level. We have also observed that all CVs: AMI, CI, LR, and OER are having a positive effect on ROA but the effect is not statistically significant.
Empirical model and panel data multivariate regression analysis
Empirical model-2
In this section we would like to estimate the following panel data regression analysis by incorporating ROE as a DV:
 $${\rm RO}{\rm E}_{{\rm it}} = \alpha + \beta _{1{\rm it}}{\rm RD}{\rm I}_{{\rm it}} + \beta _{{\rm 2it}}{\rm AM}{\rm I}_{{\rm it}} + \beta _{{\rm 3it}}{\rm C}{\rm I}_{{\rm it}} + \beta _{{\rm 4it}}{\rm L}{\rm R}_{{\rm it}} + \beta _{5{\rm it}}{\rm OE}{\rm R}_{{\rm it}} + E_{{\rm it}}.$$
From Table 12 we can find panel data regression results for both FEM and REM under empirical model-2. We have carried out the Hausman test in order to have a robust selection between FEM and REM.
Table 12. Panel regression results under FEM and REM (Y = ROE)

Source: Authors processing in Stata Software (Version-12).
***Denotes significant at 1%, **at 5% and *at the 10% level of significance.
Table 13 shows the result of Hausman test. From the table we can visualize the p value of χ2 is 0.00 which is < 0.05 or 5%. Since p value of χ2 is <0.05 or 5%, the result is statistically significant and the null hypothesis (H0) is rejected and the alternate hypothesis (H1) is accepted. Finally FEM is found to be most appropriate for the panel dataset used in our study.
Table 13. Hausman test results for appropriate model selection

Source: Authors processing in Stata Software (Version-12).
The results of FEM are as follows.
The value of F statistics is 8025.62 and its corresponding p value is 0.00 which is <0.05. It means that the model is good fit for study. The value of R 2 is 0.9820 which signifies that the model can explain 98.20% variability. IV: RDI is having positive effect on ROE and the effect is effect is statistically significant at the 1% level. CV: AMI, CI, and OER have a positive effect on ROE and the effect is statistically significant at the 1% level. We have also found that CV: LR is having negative effect on ROE but the effect is statically significant at the 10% level.
Conclusion and implications
After analyzing and interpreting the data we can come to conclusion that by holding the hands of innovation through R&D activities satisfactory financial performance is achieved which in turn ensures business sustainability for the listed Indian pharmaceutical companies. Our study has revealed that innovation through R&D activities in IPI are yielding satisfactory ROA and ROE which is highly beneficial to strengthen the financial capabilities for business sustainability. Apart from RDI, Indian pharmaceutical companies should take AMI, Capital Intensity (CI), LR, and operating expenditure to the total assets ratio (OER) into their business model for ensuring IBS since we have found that all these factors are having positive impact on the financial performance. Innovation will not only impact the business sustainability but also these innovative healthcare solution will certainly improve the quality of living of the needy patient fraternities and will bring smile in their faces by taking away the pain of sufferings from the different diseases and disorders toward ensuring saving of human lives which is need of the hour for the emerging economy like India.
Limitations
Our study employs sample size of 37 Indian pharmaceutical companies listed with NSE and it is considered not to be the sufficient for detailed analysis. Further, the study has considered the tools and techniques for analysis which may have its own limitations. The study does not consider the impact of lagging effect of the R&D activities on financial performance.
Social implications
The continuous efforts rendered by Indian pharmaceutical companies in the areas of R&D activities, innovation, and research breakthrough are constantly taking place and these breakthrough with the help of innovation will not only impact the financial performance for ensuring business sustainability but also these innovative healthcare solution will certainly improve the quality of living of the needy patient fraternities and will bring smile in their faces by taking away the pain of sufferings from the different diseases and disorders toward saving human lives. Innovation also ensures quality healthcare solutions by taking care of different unmet healthcare needs of the human being.
Scope of further research
Since we have conducted the study pertaining to the pharmaceutical industry, researcher fraternities can look forward further research work in any of the following areas to bring the innovation through R&D activities for ensuring business sustainability.

As far as the “innovation” is concerned with the help of R&D activities in IPI, there may be the possibilities of certain risks and uncertainties associated with R&D activities and “innovation” which may affect the financial performance of the different Indian pharmaceutical companies which in turn may act as an obstacle for “business sustainability.” Therefore, studies can further be performed for measuring and minimizing the risks and uncertainties associated with R&D activities and “innovation” pertain to IPI toward improving the financial performance of the Indian pharmaceutical companies for ensuring “business sustainability”.
Author ORCIDs
Brajaballav Pal, 0000-0002-0501-0158.
Dr. Brajaballv Pal is a full Assistant Professor in the Department of Commerce with Farm Management at Vidyasagar University. He has been awarded with a PhD degree by Vidyasagar University. He is having vast teaching experience at the post graduate level. Under his guidance and supervision different research scholars are pursuing their doctoral studies in the arena of Research and Development, Compensation Management, Banking, and Health Care. He has published several papers in reputed journals. He is the life member of Indian Accounting Association, Indian Commerce Association, and Indian Accounting Association Research Foundation.
Mr. Mithun Nandy is Assistant General Manager (AGM-Sales) at Hegde and Hegde Pharmaceutica LLP, Mumbai. He is directly responsible for the domestic market operation which covers different states of India as well as international market – Nepal. He has been associated with the company since April 2005 and held various positions which have given him experience and expertise in Sales, Marketing, Business Development, and Market Forecasting. He is a full time MBA (Marketing) and currently pursuing PhD from the Department of Business Administration, Vidyasagar University. He holds the life membership of Calcutta Management Association.


