


Introduction
Constraints in design ideation
There is a dichotomy in using freedom or constraints in design ideation. Freedom provides conditions to explore new experiences without limitations (Tversky and Chou, Reference Tversky and Chou2011). Constraints are essential in design ideation in order to introduce the limitations related to situational realities of design problem (Lawson, Reference Lawson2006; Clinton and Hokanson, Reference Clinton and Hokanson2012). Constraints cover a broad range of concepts such as time, cost, social, and organizational issues or seeing any representations that can be used for design solution (Onarheim, Reference Onarheim2012). These can be classified as visual and non-visual constraints.
Non-visual representations can be written language (Eastman, Reference Eastman and Eastman2001), so a number of studies investigated the effect of textual representations on design ideation. Gonçalves et al. (Reference Gonçalves, Cardoso and Badke-Schaub2012) studied the impact of texts with different levels of abstraction on design ideation of bachelor and master students. Goldschmidt and Sever (Reference Goldschmidt and Sever2011) compared the effect of different types of textual representations based on their similarity to a problem domain. Zahner et al. (Reference Zahner, Nickerson, Tversky, Corter and Ma2010) studied textual representations by focusing on the instructions for using those representations. While the role of non-visual representations should not be underestimated, the process of designing involves the creation and use of images, and designers prefer to use visual representations more than non-visual because less cognitive effort is needed to process the information in pictorial images than words (Gonçalves et al., Reference Gonçalves, Cardoso and Badke-Schaub2016).
As designing is situational, designers have interactions with the environment, including representations. Empirical studies of design behaviors show that representations play important roles during design ideation and designers produce design solutions by interpreting those images (Purcell and Gero, Reference Purcell and Gero1992; Schon and Wiggins, Reference Schon and Wiggins1992). Both students (novice designers) and experts generate design solution using representations. Experts generate less drawings with more cognitive behavior related to the interpretation of representations, while novices generate more drawings with less interpretations (Suwa and Tversky, Reference Suwa and Tversky1997). This implies that experts think about more attributes of representations. Prompting designers to use particular representations during designing is likely to affect their perception. The effect of representations on students’ perception could change their interpretation of further representations (Webster, Reference Webster2015). As such, students need to develop skills in interpreting representations during the ideation phase of design, which can be provided by prompting them through design practices with representations (Casakin and Goldschmidt, Reference Casakin and Goldschmidt2000; Heylighen and Verstijnen, Reference Heylighen and Verstijnen2003; Goldschmidt and Smolkov, Reference Goldschmidt and Smolkov2006; Casakin, Reference Casakin2010; Fu et al., Reference Fu, Cagan and Kotovsky2010).
In design education, constraints are presented in the design brief. Teachers provide design briefs generally in a form of text to explain the task statement to students (Hocking, Reference Hocking2014). A design brief describes a set of requirements related to the design task that needs to be followed. Any changes in the design brief can influence design experiences and constraints in a design task could change participants’ design behavior (Williams et al., Reference Williams, Lee, Gero and Paretti2013). Biskjaer et al. (Reference Biskjaer, Christensen, Friis-Olivarius, Abildgaard, Lundqvist and Halskov2019) showed that different levels of constraint have different effects. In their research, in each level of constraint, participants could choose different types of visual images as their source of inspiration. While the results suggested that each type of constraint can prompt participants to choose specific types of visual images, the effect of using a visual constraint on design cognition was not considered. In the next section, the impact of different visual constraints and their effects on design behavior are outlined.
Visual constraints and students’ design behavior
There is design education research about the effect of visual constraints on students’ design behavior. In some of these studies, participants could freely use different representations during their design process (Heylighen and Verstijnen, Reference Heylighen and Verstijnen2003; Ozkan and Dogan, Reference Ozkan and Dogan2013). The results showed that provoking students to use visual constraints could influence their design behavior and improved the quality of their design solutions. In some studies, participants could choose from different types of visual images without any limitations. Participants preferred to use those examples with superficial similarity (Heylighen and Verstijnen, Reference Heylighen and Verstijnen2003; Ozkan and Dogan, Reference Ozkan and Dogan2013); this means that their design experiences would be constrained by using limited types of representations.
Different types of representations can have different impacts on design behaviors, so the effect of each type has been explored (Linsey et al., Reference Linsey, Wood and Markman2008). In one research study, each group of participants was given different representations of a specific type (ambiguous or obvious) (Goldschmidt and Smolkov, Reference Goldschmidt and Smolkov2006). Using a visual constraint in this situation could affect students’ design performance; however, they might not be inspired by representations when they are instructed to use images with structural similarities to their developing design.
Research has shown that instruction for using images caused more positive effects on design performance than using those images without any instructions (Casakin and Goldschmidt, Reference Casakin and Goldschmidt2000; Casakin, Reference Casakin2010). In these experiments, participants could freely choose from different types of images and the instruction for using those representations led them to consider the structural relationship between the given images and design solutions. However, in that experiment, it was not possible to observe the effect of each specific type of representation on their design behaviors.
There are studies which involve a constraint of a specific type of representation in the design process (Fu et al., Reference Fu, Cagan and Kotovsky2010). Participants of each group were given a design task: the control group was without any visual constraints and two experimental groups each experienced one type of the visual constraint. Results suggested that a visual constraint might improve the quality of design solutions or led participants to imitate some features of the given visual information for design solutions which had a negative effect on their design behavior and decreased the quality of design solutions. However, the focus of that research was on team convergence and quality of solutions, and the design behavior of individuals was not mentioned. A summary of some related visual constraint research is shown in Table 1.
Table 1. A summary of recent research on the visual constraint

Since using a visual constraint could have a negative impact on participants’ design behavior, the characteristics of representations that might prevent designers from this effect were investigated. It was suggested to use examples with a remote association to any design solution (Purcell and Gero, Reference Purcell and Gero1992). In this condition, participants might be led to produce new knowledge which then would be used in design ideation and prevent the example from being applied directly as a solution of the proposed problem (Goldschmidt, Reference Goldschmidt2011). By using remote examples designers do not focus just on an existing set of behaviors and they may create new interpretations (Purcell and Gero, Reference Purcell and Gero1992). Ambiguity can facilitate new interpretations of a representation (Goel, Reference Goel1995). An ambiguous image may affect the designers’ reinterpretation (Ball et al., Reference Ball, Ormerod and Morley2004) and generate more novel ideas in comparison to a condition of using an obvious representation (Cardoso and Badke-Schaub, Reference Cardoso and Badke-Schaub2011). It is not important that the ambiguous image be used to generate a design solution but rather to provide the insight to that representation, which would lead participants to think about a wider range of possible designs (Muth et al., Reference Muth, Hesslinger and Carbon2015).
The role of a visual constraint can be the same as an anchor which leads participants to search using it as a starting point. Although multiple examples may motivate participants to think about different concepts and produce more innovative solutions, one example may direct them to a deep investigation of the representation which decreases the variety but increases the quality of the ideas (Sio et al., Reference Sio, Kotovsky and Cagan2015). In the following sections, the effect of the order of experiencing design sessions, and students’ gender which might affect students' design behavior when using a visual constraint are outlined.
Visual constraint and order of experiencing design sessions
There are other factors which might have an impact on a visual constraint experiment. Since in this research, a within-subject design experiment design is used, the sequence of experiencing the design sessions might affect the participants’ design behavior. In order to control this variable, a counterbalanced within-subjects design is applied (Mitchell and Jolley, Reference Mitchell and Jolley2012). Participants are randomly assigned to two different sequences of conditions: half of the participants do task A first and the other half do task A second (Self et al., Reference Self, Evans and Kim2016). Then, by analyzing the results of the two groups, the impact of order can be determined (Mitchell and Jolley, Reference Mitchell and Jolley2012).
Bilda and Gero (Reference Bilda, Gero, Gero and Goel2008) examined the order of carrying out two design sessions on the design behavior of participants. The time between the two design sessions was about 1 month. The order, with this time gap, had no effect on their behavior (Bilda and Gero, Reference Bilda, Gero, Gero and Goel2008). The same result was observed in another study which the time between two design sessions was 2 weeks (Camba et al., Reference Camba, Kimbrough and Kwon2018). As visual constraints can be used in design education and the time between different design practices might be less than 2 weeks, the knowledge of the first designing activity might have an influence on the next design session. The time between the two design sessions in the research described in this paper is less than 2 weeks and the effect of the order on design behavior is investigated.
Visual constraint and students’ gender
Most of the research studying the effects of visual constraints have not included gender as a variable (Heylighen and Verstijnen, Reference Heylighen and Verstijnen2003; Goldschmidt and Smolkov, Reference Goldschmidt and Smolkov2006; Casakin, Reference Casakin2010). However, in the studies which have focused on this issue, inconsistent results were reported (Suits and Lagowski, Reference Suits and Lagowski1994; Felder et al., Reference Felder, Felder, Mauney, Hamrin and Dietz1995; Goldschmidt and Sever, Reference Goldschmidt and Sever2011; Xie et al., Reference Xie, Zhang, Nourian, Pallant and Hazzard2014; Lu, Reference Lu2015; Alelyani et al., Reference Alelyani, Yang and Grogan2017). In the research based on the students' grades, no difference related to gender was found (Whigham, Reference Whigham1988). Goldschmidt and Sever (Reference Goldschmidt and Sever2011) tested the effect of examples and reported that the gender of students had not changed the quality of their designs in different conditions (with and without using examples).
However, other studies found differences between male and female students. It was important to identify the impact of participants’ gender particularly in design education (Magolda, Reference Magolda1992). Gender can affect some types of spatial abilities (Newcombe et al., Reference Newcombe, Bandura and Taylor1983). These abilities also can be used in problem solving. Female and male students had different focuses on some types of cognitive activities related to problem solving (Suits and Lagowski, Reference Suits and Lagowski1994). They also had different tendencies toward solution-driven design cognition (Lu, Reference Lu2015). Other studies showed that while female students produce a more suitable solution, males explored possibilities that were not essentially related to design specification and generated more complex solutions (Xie et al., Reference Xie, Zhang, Nourian, Pallant and Hazzard2014). It was observed that male participants preferred greater risk taking than females (Byrnes et al., Reference Byrnes, Miller and Schafer1999). Bannerot (Reference Bannerot2006) found that different tasks might have different effects on male and female perceptions. Newcombe et al. (Reference Newcombe, Bandura and Taylor1983) suggested that measuring the effect of gender is also important and could change the result, so there is a continuing need to study the effect of gender on design behavior.
Aim and research questions
This research focuses on the distributions of cognitive effort with and without a visual constraint, as previous research has not focused on this. Also, the effect of gender and order of experiment on design behavior is investigated by analyzing the distributions of cognitive effort. The main goal of the research reported in this paper is to explore further the effect of a visual constraint on the design cognition behaviors of students. The primary research question that motivates this work is:
• How does the design behavior of students vary when designing with and without a visual constraint?
The results provide a step toward understanding the effect of a visual constraint in design education particularly if order and gender are potentially important factors. So, two further questions are investigated:
– How does the order of design sessions, one with a visual constraint and the other without, affect students’ design behavior?
– Are there gender differences in design behaviors with and without a visual constraint?
In this research, these three questions are explored using statistical tests of the distributions of measured cognitive effort.
Method
Experimental design
To examine the three research questions, a 2 × 2 within-participant experiment was set up. For each component of the experiment, the first variable consisted of the two conditions: non-visual constraint and visual constraint. The second variable consisted of the two conditions: the order of the two design sessions and gender of participants. Each group produced designs under each of the conditions. The experiment was carried out in a room with no wall adornments. Several blank sheets of A4 paper and pencils were provided for participants. They were told that all their design activities were to be recorded. A camera was positioned above the paper in the way to not obscure the participant's view but to record all the marks that were made. Participants were asked to read the design brief and ask their questions before starting to design. The experiment data collected through a protocol analysis consisted of videoed retrospective verbal reports and design sketches.
The verbal data was coded and this coded data formed the basis of statistical testing for differences to determine answers to the three research questions. Only 24 volunteers were available, which while satisfactory for an exploratory study limits the generalizability of the results.
Protocol analysis
In order to examine the effect of a visual constraint on students’ design process, the design behaviors of students are studied using protocol analysis. The verbalized data that indicate the participant's thoughts during the experiment is gathered and analyzed. Two types of reports can be used depending on when participants verbalize their thoughts. Participants can report their thoughts during the design session which is called “concurrent” or “think-aloud” protocol analysis or after finishing the design session which is called “retrospective” protocol analysis (Ericsson and Simon, Reference Ericsson and Simon1993). While the think-aloud method is widely used, there is still some debate about whether it might interfere with the participants’ thinking activity (Chu et al., Reference Chu, Hung, Wu and Te Liu2017). In retrospective report, participants might not remember their thoughts (Gero and Tang, Reference Gero and Tang2001) particularly 30 min after the event (Stones and Cassidy, Reference Stones and Cassidy2010). However, the mature development of visual technology can be applied to help participants to better remember their design decisions (Chu et al., Reference Chu, Hung, Wu and Te Liu2017). Retrospective reporting was used in this research.
Retrospective protocol analysis consists of the following sequential tasks:
-
Videoing of design session: Participants' sketching activities are videoed. Immediately after the design session, each participant is asked to report on what they were thinking about while viewing the video of themselves designing along with their sketches. The process of reporting is videoed. During the retrospective protocol session, if participants were silent, two questions were asked: what were you thinking, then? and where did that idea come from? (Stones and Cassidy, Reference Stones and Cassidy2010). No other questions were asked because they could prompt participants to generate misleading data. Also, no comments prompting the participant to focus on the specific process were made (Stones and Cassidy, Reference Stones and Cassidy2010).
-
Transcription of utterances to text: Transcription of the retrospective report consists of two steps: first, all the verbalizations of participants are transcribed (by the first author) and second, since participants might not report design behaviors chronologically, each transcription is reviewed and modified to match the time sequence of the video.
-
Segmentation/coding the protocol: Segmentation consists of dividing the verbalization into smaller units, called segments, and assigning a code to each segment. Each segment should contain only one design issue (Kan and Gero, Reference Kan and Gero2017). In this way, the protocol is transformed into a sequential set of codes for later analysis. The processes of segmentation and coding are done simultaneously so that each segment contains only one code.
-
Arbitration of segmentation/coding: The process of segmentation and coding was carried out multiple times by a single coder (the first author). In order to increase the robustness of coding, there was a 10-day separation between the first and second segmentation and coding and other sessions were coded during those 10 days to reduce the priming effect of the first coding (Kan and Gero, Reference Kan, Gero, McDonnell and Lloyd2009). Then, the two codings for each session were arbitrated by the first author (Kan and Gero, Reference Kan, Gero, McDonnell and Lloyd2009). The arbitrated coding was used in all later analyses.
Coding scheme
To examine the three questions, the function–behavior–structure (FBS) ontology-based coding scheme was used in the protocol analysis (Kan and Gero, Reference Kan and Gero2017). This coding scheme was chosen as it has been found to have been used in multiple other design cognition studies (Hofmeister et al., Reference Hofmeister, Kruchten, Nord, Obbink, Ran and America2007; Masclet and Boujut, Reference Masclet and Boujut2010; Hamraz et al., Reference Hamraz, Caldwell, Ridgman and Clarkson2015; Milovanovic and Gero, Reference Milovanovic, Gero, Marjanovic, Clarkson, Lindemann, McAloone and Weber2018) and has been used to code over 10,000 h of designing in the industry (Bott and Mesmer, Reference Bott and Mesmer2019). The foundational papers for the FBS ontology (Gero, Reference Gero1990; Gero and Kannengiesser, Reference Gero and Kannengiesser2004) have been cited over 3500 times (Google Scholar, January 31, 2020).
The coding scheme is based on three classes of ontological variables: function (F), behavior (B), and structure (S) (Gero, Reference Gero1990). Function is the purpose of the artifact. Behavior can be expected to be exhibited by the structure or can be derived from the structure, thus splitting behavior into two codes (Be and Bs). All external requirements are coded as R and the external description is coded as D, as shown in Figure 1. Both R and D are expressible in F, B, or S and do not require additional ontological classes.

Fig. 1. The FBS ontology showing the six design issues and eight design processes (numbered): R = Requirement, F = Function, Be = Expected behavior, Bs = Structure behavior, S = Structure, D = Description, and 1 = Formulation, 2 = Synthesis, 3 = Analysis, 4 = Evaluation, 5 = Documentation, 6 = Reformulation 1, 7 = Reformulation 2, and 8 = Reformulation 3 (Gero and Kannengiesser, Reference Gero, Kannengiesser, Chakrabarti and Blessing2014).
The six design issues that map onto the codes are described and presented below:
• Requirement (R): Derived from a brief which is given to designer.
• Function (F): Purposes and goals of design.
• Behaviors (Be, Bs): Expected behavior is the behavior which can be expected from the structure (Be). Structure behavior is behavior derived from structure (Bs). This type of behavior can be interpreted from an existing structure. In the architecture, light levels or circulation are examples of behavior.
• Structure (S): The structure refers to object components and their relationships (Gero and Kannengiesser, Reference Gero, Kannengiesser, Chakrabarti and Blessing2014). In the architecture, the structures are spaces or the elements which construct the spaces.
• Description (D): Any external depiction of the design.
In each protocol, there might be utterances that are not related to any of the six issues and they are coded as “other” (O). These include general statements about the method of design or architecture, and participant's intentions about their own future actions are coded as O.
It is assumed that different thinking activities during designing are related to each other, these activities in FBS ontology are associated with the six design issues, the transformation between two design issues is a design process. There could be different processes between various issues but eight of them are identified and measured. The eight processes, numbered in Figure 1, include (Gero and Kannengiesser, Reference Gero, Kannengiesser, Chakrabarti and Blessing2014):
– Formulation: To transform design requirements into functions and functions into expected behaviors (process 1, Fig. 1);
– Synthesis: To produce a structure based on expected behavior (process 2);
– Analysis: To derive behavior from the structure (process 3);
– Evaluation: To compare the behavior derived from the structure to the expected behavior (process 4);
– Documentation: To describe the design externally (process 5);
– Reformulation 1: To reframe the structure state space (process 6);
– Reformulation 2: To reframe the behavior state space (process 7); and
– Reformulation 3: To reframe the function state space (process 8).
Examples of design issues and processes are presented in Table 2. The distribution of cognitive effort is measured by the distribution of the coding variables derived from the FBS ontology (Gero and Kannengiesser, Reference Gero, Kannengiesser, Chakrabarti and Blessing2014; Kan and Gero, Reference Kan and Gero2017).
Table 2. Examples of design issues and the processes of Evaluation (segment 105 > 106), Reformulation 3 (segment 127 > 128), Reformulation 2 (segment 174 > 175), Synthesis (segment 175 > 176), Reformulation 1 (segment 176 > 177), Documentation (segment 178 > 179), and Analysis (segment 182 > 183)

Experiment
Participants and context
Twenty-four undergraduate architecture students from Shahid Bahonar University of Kerman volunteered. They were in second year and had passed all introductory design studio courses and started their first design experience in architecture design studio I. The subject of design studio I is related to designing an education building. The experiment was in the last month of the semester because participants had to have fundamental knowledge about the design brief (e.g., functions and behaviors) which was related to designing an educational building. In order to choose participants, the experiment had been explained to teachers of that course and asked them to invite students to volunteer.
Participants were instructed on the purpose of the research and their role. They signed the written consent form. Half of them were male and the other half were female. Each participant received a gift of a book after completing the two design sessions.
Each participant executed two design tasks, one without any visual constraint (control) and the other with a visual constraint (experiment). Since participants of the two design sessions were the same, they were divided into two groups. One group did the constraint design session first and the other group did it second. The time between each design session was about 7 days. First, the process of the experiment was explained to each of the participants. Then, they did a 5-min pre-test for warm up. For the experiment group, a simple pre-test was done by each participant in order to become familiar with designing with a visual constraint. The design brief was provided as a written document. Each participant had to read it and ask any questions before commencing designing. The time for each of design sessions was 1 h. Each design task was conducted individually in the same closed room. An example of one of participant's resulting drawings is shown in Figure 2.

Fig. 2. An example of one of participants’ drawings for without the visual constraint design session.
Design brief
In this research, each student worked individually on the design task. They presented all their design activities on A4 sheets of papers. In both of the design briefs, the design tasks were related to education buildings. The requirements of the two tasks were functionally close to each other (Figs. 3 and 4). Similar to previous research (Suwa and Tversky, Reference Suwa and Tversky1997; Suwa et al., Reference Suwa, Purcell and Gero1998), the design brief consisted of the list of spaces that should be arranged in the site and also the orientation and dimensions of the site.

Fig. 3. Design brief of without the visual constraint group (control).
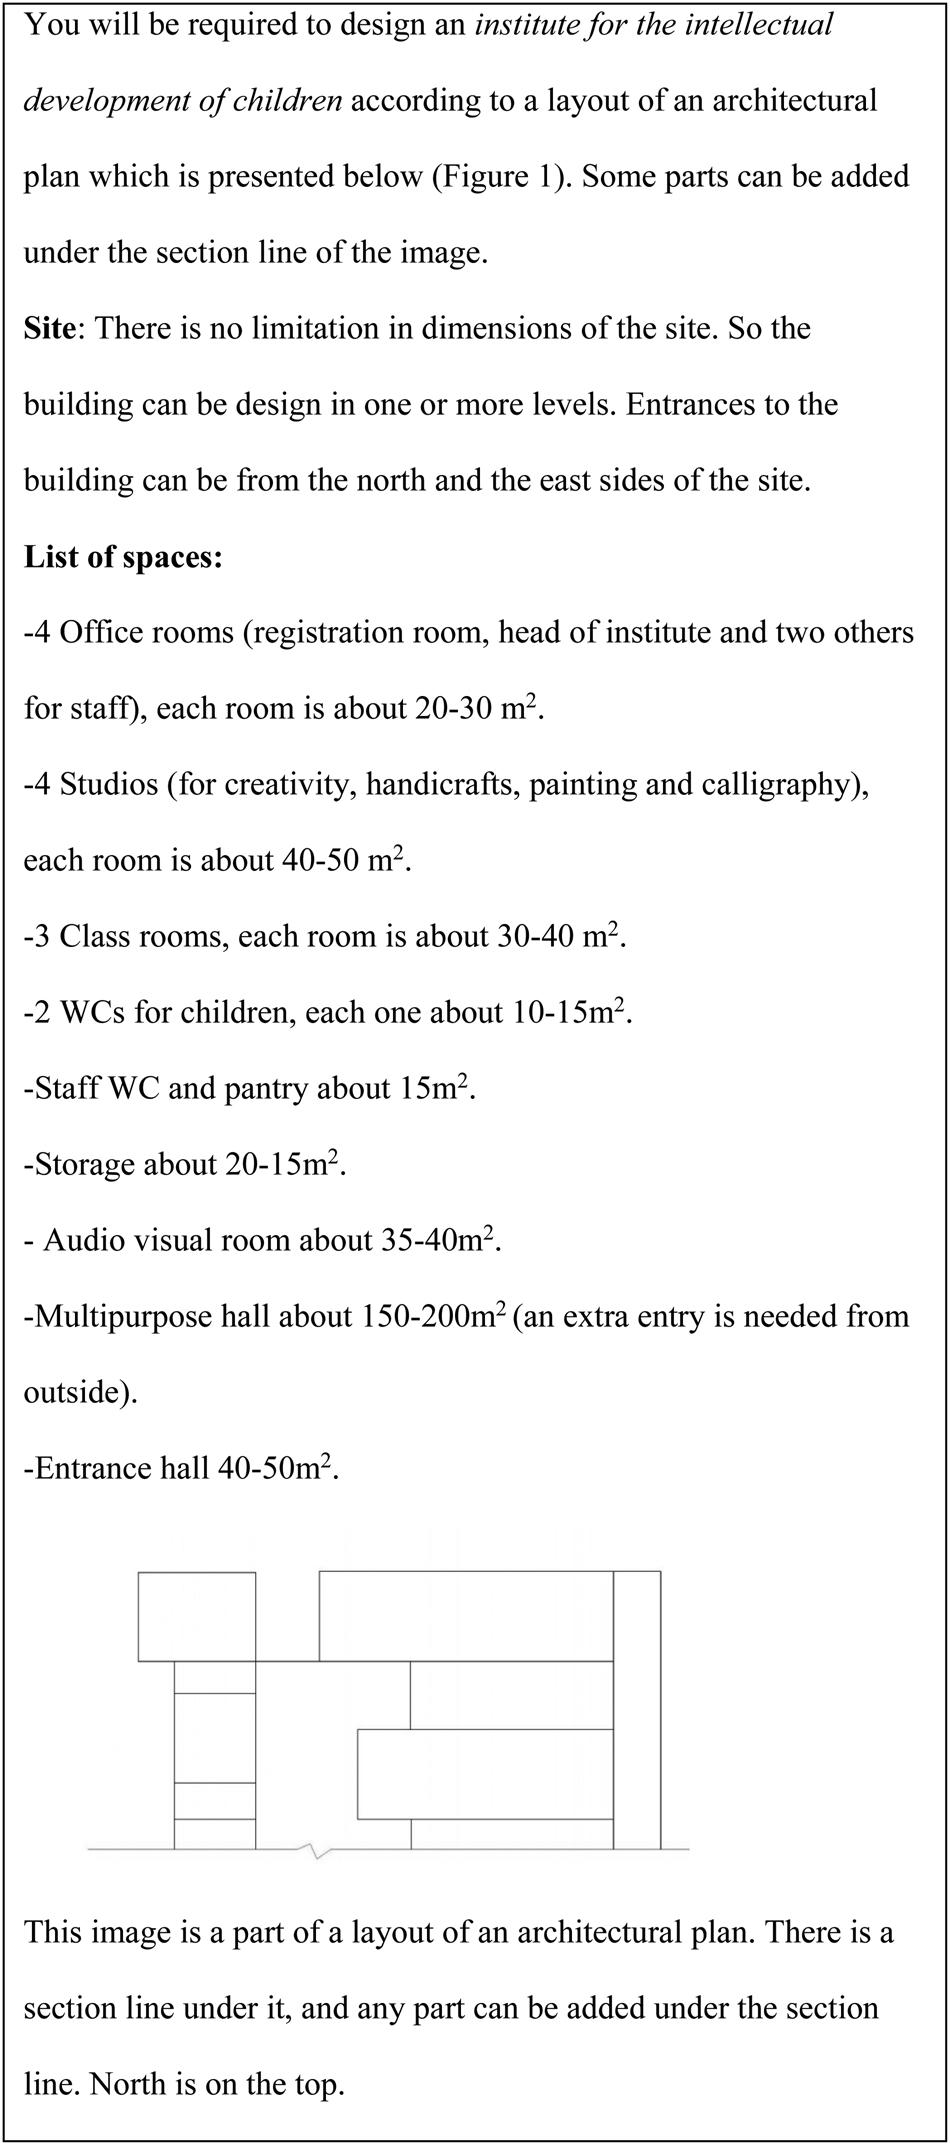
Fig. 4. Design brief of the visual constraint group (experiment).
In the second design brief (experiment group), a task was added which was to use an ambiguous image of an architectural layout, as shown in Figure 5. The image related to the plan of “After-School Child Care Gistel” in Belgium which was designed by Xavier Nolf. The building had a similar function to the design task. An ambiguous image was produced based on the ground floor plan of that building and then a part of it was used in the experiment. To provide an ambiguous drawing, the symbolic features (e.g., elements or analogies like wall or window) were omitted from the plans (Fig. 5). The result was a composition of different formal features (e.g., geometrical or physical characters like rectangle or square) that had the potential to be interpreted as different types of symbolic references. Also, a part of the image was omitted to increase its level of ambiguity and prompt participants to consider a wider range of possible designs (Fig. 5). Each participant had to interpret the image, add some of the required spaces in it as part of meeting the design requirements (Fig. 4).

Fig. 5. (a) Architectural plan of After-School Child Care GistelFootnote 1 and (b) the ambiguous image produced from the abstracted plan (on the left), the part of the image that used for design brief (on the right).
Results and analysis
All design sessions were coded twice and then arbitrated. To measure inter-rater agreement, Cohen's kappa coefficient was used (Cohen, Reference Cohen1960). There may be some issue about using Cohen's kappa with the arbitrated coding as these were the results of an arbitration and were not produced by an individual rater. However, that result is presented here. The agreement for codings 1 and 2, coding 1 and arbitrated result, and coding 2 and arbitrated result was calculated. The average for each pair is presented in Table 3. Each design session was 1 h, and the final protocols ranged from 14 to 28 min of retrospective reporting and produced between 178 and 358 segments. The average duration of debriefing session for without constraint design session was 21.45 min (SD = 3.42) and for the visual constraint condition was 21.36 min (SD = 3.42). The average for the number of segments is 270.19 (SD = 48.50) and the average report duration is 21.40 min (SD = 3.95).
Table 3. Results of coding agreement Cohen's kappa coefficient

a Strong agreement.
b Excellent agreement.
LINKODER is a protocol analysis software tool designed to perform a variety of quantitative analyses based on the FBS coding scheme (Pourmohamadi and Gero, Reference Pourmohamadi, Gero, Culley, Hicks, McAloone, Howard and Reich2011). The normality of the distributions of the percentage occurrences of design issues and processes was tested using the Shapiro–Wilk test. Since a number of the distributions were not normally distributed, all the comparisons were carried out using the Wilcoxon rank sum test. The effect of the visual constraint can be analyzed by measuring statistical distributions related to the different design issues and processes. In this paper, three measurements based on the FBS coding distributions were applied. First, each design issue and each design process was analyzed individually. Then, at the meta-level, the problem–solution (P–S) issue index was used to measure when participants focus on the problem or the solution (Section “Meta-level analysis”). A further index was proposed to measure the effect of the given layout in the visual constraint by comparing the behaviors related to the pre- and post-structure (Section “Meta-level analysis”). Finally, a correspondence analysis was carried out to investigate the qualitative relationships of the variable categories.
Design issues
The percentage occurrence of design issues for the control (without a visual constraint) and experiment group (with a visual constraint) are presented in Figure 6. In Figure 6 and all the following bar graphs, the error bars show the within-subject standard error. The means of issues for each group are presented in Table 4. The results indicate that there is a significant difference in the distribution of cognitive effort spent on expected behavior only. This result implies that when participants design with a visual constraint they focus less on expected behavior. From the results shown in Table 4, it can be seen that there are no significant differences between the distributions of structure and structure behavior related to both conditions which means the visual constraint did not affect the cognitive focus on these issues.

Fig. 6. Percentage occurrences of design issues for control and experiment groups.
Table 4. Design issues: Means, standard deviations, and results of Wilcoxon rank sum test for control and experiment groups

a Insufficient data for analysis.
* P < 0.001.
The effect of the order of tasks on distributions of design issues was measured. Group A was exposed to the visual constraint in their second design session and group B was given it in their first session. The means and standard deviations and Wilcoxon rank sum test results for two design sessions for group A and B are presented in Tables 5 and 6. It can be observed that there are no significant differences between the groups, which means that the order of design tasks does not affect the distribution of design issues.
Table 5. Task order: Means, standard deviations, and results of Wilcoxon rank sum test of design issues for without the visual constraint group

a Insufficient data for analysis.
Table 6. Task order: Means, standard deviations, and results of Wilcoxon rank sum test of design issues for the visual constraint group

a Insufficient data for analysis.
The effect of gender on the distribution of design issues was measured. The results of 12 male participants were compared to those of the 12 female participants for each of design sessions. The means and their standard deviations and Wilcoxon rank sum test results are presented in Tables 7 and 8. The results show that gender does not alter the distributions of design issues. The comparison between the results of design issues indicates that the order of design sessions and gender have no effect on the distributions of design issues.
Table 7. Gender: Means, standard deviations, and results of Wilcoxon rank sum test of design issues for without the visual constraint group

a Insufficient data for analysis.
Table 8. Gender: Means, standard deviations, and results of Wilcoxon rank sum test of design issues for the visual constraint group

a Insufficient data for analysis.
Syntactic design processes
In this analysis, it is assumed that each segment in the protocol is related to the one preceding it. This relation is a transformation from one issue in one segment to the issue in the following segment, which identifies a design process. The percentage occurrences of design processes for control and experiment groups are presented in Figure 7.

Fig. 7. Percentage occurrences of design processes for the control and experiment groups.
Means and standard deviations of design processes and the Wilcoxon rank sum results are presented in Table 9. Significantly less cognitive effort was focused on synthesis and on reformulation 2 by the experiment group than the control group. A significant effect was also found related to reformulation 1.
Table 9. Design processes: Means, standard deviations, and results of Wilcoxon rank sum test for the control and experiment groups

a Insufficient data for analysis.
* P < 0.05.
** P < 0.001.
The distributions of design processes for with and without the visual constraint groups were studied by comparing the averages of Groups A and B. The significance for each design process is calculated in Tables 10 and 11. Since among all the processes there is only one that is significantly different, reformulation 2 in Table 11, the order of design sessions has a small effect on the distribution of design processes between these two groups.
Table 10. Design processes: Means, standard deviations, and results of Wilcoxon rank sum test for without the visual constraint group

a Insufficient data for analysis.
Table 11. Design processes: Means, standard deviations, and results of t-test for the visual constraint group

a Insufficient data for analysis.
* P < 0.01.
To determine further any effect of order, the results of two design sessions were studied within-groups for Groups A and B. The results from Tables 12 and 13 show that synthesis and reformulation 2 are significantly different for both groups. This result is similar to the result of Table 9, except for reformulation 1.
Table 12. Design processes: Means, standard deviations. and results of significance tests for the control and experiment groups (Group A)

a Insufficient data for analysis.
* P < 0.01.
Table 13. Design processes: Means, standard deviations, and results of significance tests for the control and experiment groups (Group B)

a Insufficient data for analysis.
* P < 0.05.
** P < 0.01.
To measure the effect of gender on students’ design behavior, the design processes of the 12 males and 12 females were analyzed for the two design sessions (Tables 14 and 15). No significant difference was found between male and female students in the visual and non-visual constraint group, although there is a close to significant different for synthesis in the visual constraint group.
Table 14. Design processes: Means, standard deviations, and results of significance test for the non-visual constraint group for female and male participants

a Insufficient data for analysis.
Table 15. Design processes: Means, standard deviations, and results of significance test for the visual constraint group for female and male participants

a Insufficient data for analysis.
Meta-level analysis
P–S index
The distribution of cognitive effort can be compared using a different scale. In this method, the results of FBS coding are divided into two categories and then compared. The first category measures the ratio of cognitive effort expended on the problem to that on the solution, which is called the problem–solution Index (Jiang et al., Reference Jiang, Gero, Yen and Gero2014). Based on the FBS ontology, shown in Figure 1, requirement, function, and expected behavior are related to the problem space. The structure and the behavior which is derived from a structure are related to the solution space. The problem to solution issues index measure is the ratio of cognitive effort of problem to cognitive effort of solution. The equation is
 $${\rm P}{-}{\rm S} \,{\text {issue index}}=\frac{{\rm Requirement }+ {\rm Function} + {\rm Expected\, Behavior}}{ {\rm Structure} + {\rm Structure \, Behavior}}.$$
Design processes also can be classified into those which focus on problem framing or problem solving. Formulation, reformulation 2, and reformulation 3 are transformations belong to problem space. Analysis, evaluation, synthesis, and reformulation 1 are design processes that belong to the solution space. To measure the P–S index for FBS design processes, the following equation is used:
 $$\eqalign{&{\rm P}{-}{\rm S}\,{\rm process}\,{\rm index} \cr &\quad= \displaystyle{{{\rm Formulation} + {\rm Reformulation}\,2 + {\rm Reformulation}\,3} \over {{\rm Analysis} + {\rm Evaluation} + {\rm Synthesis} + {\rm Reformulation}\,1}}}.$$
Designing is a dynamic process, so the P–S index is explored temporally. Each protocol is divided into time quintiles. For each quintile, an independent calculation for the P–S issue index and the P–S process index is carried out, then the results of each group are averaged. The sequence of the five averages can provide knowledge about the dynamic behavior of each group. By plotting the results of each group, the changes in P–S indices during designing are presented. The graphs produce knowledge for a qualitative comparison of two cohorts based on the P–S index.
The P–S issue index graph for the control and experiment groups is shown in Figure 8. It can be observed that the control group spent more time on the problem in the first and last quintiles of the design session than the experiment group.

Fig. 8. P–S issue index for the control and experiment groups in quintiles.
The P–S process index was calculated and plotted in Figure 9. The graph for the experiment group is nearly horizontal with only a small change in slope across time. For the control group, there are large changes across the design sessions and they have a different temporal behavior from the experiment group. During design sessions for all quintiles except the third, the control group has higher P–S process index values, which means that participants spent more time framing the problem than the experiment group. The two groups have different distributions of cognitive effort related to problem framing and solving. While in the control group, the focus on problem and solution is changed during designing, and in the experiment group, the ratio of focus on problem and solution is near invariant during the design session.

Fig. 9. P–S process index for the control and experiment groups in quintiles.
P–P index
In the FBS coding scheme, the processes which can be derived from an existing structure are analysis (S > Bs), reformulation 1 (S > S), reformulation 2 (S > Be), and reformulation 3 (S > F) (Fig. 1). Another process which might be linked to an existing structure but does not directly relate to it is evaluation. This process would only be used after a structure behavior is generated by analysis. Formulation and synthesis are processes which are not used for reasoning about an existing structure but to generate a new structure. By formulation, a function can be produced, and a function can also be transformed to an expected behavior in a formulation process. In synthesis, a structure is produced through an expected behavior. In order to measure the impact of a visual constraint on students’ design behavior, the FBS-based design processes can also be categorized into those which are used before a structure is generated, and those which occur after a structure is produced. Each of the two groups of processes is iteratively repeated during design sessions. The processes relating to an existing structure can be connected to problem or solution space. While reformulations 2 and 3 can be used for problem framing, problem solving is related to analysis, reformulation 1, and evaluation.
To study the effect of visual constraint on the distribution of cognitive effort, the two categories can be measured for the control and experiment groups. A dynamic process which measures the changes of design behaviors is used to understand how and when the visual constraint affects the distribution of cognitive effort related to the structure. A simple measurement is proposed: a ratio that computes the total occurrences of the cognitive effort concerned with the pre-structure to those which are the post-structure. The pre-structure–post-structure (P–P) index is given as follows:
 $${\rm P}{-}{\rm P}\,{\rm index} = \displaystyle{{{\rm Formulation} + {\rm Synthesis}} \over {{\rm Analysis} + {\rm Evaluation} + {\rm Reformulation}\,1 + {\rm Reformulation}\,2 + {\rm Reformulation}\,3}}.$$
The P–P index averages for the two groups across quintiles are shown in Figure 10. The control group has an average negative slope through the session which shows that the processes associated with the generating structure are high in the beginning but decrease during the design session. The slope for the experiment group shows very small changes during the design session which suggests that both types of processes are unchanged during the design session. Comparing the values of the P–P index of the two groups shows that participants in the control group spent more time on producing structure than the experiment group. The difference between the two groups narrows over time.

Fig. 10. P–P index for the control and experiment groups.
Correspondence analysis
Multiple correspondence analysis is used to determine qualitative relationships between the five categories of: males with and without the visual constraint, females with and without the visual constraint and all participants. In this method, the variables are illustrated by points in a two-dimensional graph where their locations are used to determine the relationships between the categories. The results are shown in Figure 11, where the two axes refer to dimensions in hyperspace rather than dimensions in terms of variables in the experiment. The percentages on the axes refer to the amount of data variance covered. Here, the coverage at 87.59% is high. The locations of the categories: all males in both the control and experiment groups as a single category and all females in both the control and experiment groups as a single category are on opposite sides in Dimension 2, implying that these two categories are qualitatively different. This categorical difference, which is related to the gender of the participants, was not picked up by the statistical testing. However, both females and males without the visual constraints lie on the same positive side of Dimension 1, while both males and females with the visual constraint lie on the same negative side of Dimension 1. This implies that there is no categorical gender difference between the control group and the experiment group with a visual constraint and also no categorical gender difference between the control group and the experiment group without a visual constraint in this dimension. This difference between the two dimensions implies that the effect of gender is multifaceted and requires further investigation to untangle.

Fig. 11. Joint plot of the five categories after a multiple correspondence analysis.
In order to determine the effect of the temporal dimension on cognitive behavior, the codings of the retrospective protocol of each design session were divided into two halves with a similar number of segments. The five variables were considered in each half, resulting in doubling the number of categories to 10. A multiple correspondence analysis was carried out for these 10 categories, as shown in Figure 12. Between the two dimensions, 95.85% of the variance in the data is covered. This is a high level of coverage. Note that the dimensions in Figure 12 bear no relation to those in Figure 11 as correspondence analysis recalculates the optimal dimensions for each data set.

Fig. 12. Joint plot of the 10 categories after a multiple correspondence analysis.
The first halves for all categories are located on the positive side of Dimension 1, while the second halves are all located on the negative side. This implies that for both groups the distributions of cognitive effort related to design issues changed during the design session. For the first half, the difference can be observed between the control and experiment groups in Dimension 2. In the first half, the locations related to female and male students who experienced the visual constraint are near each other. This corresponds to their categories being similar in design behavior. The same relation can be observed for the control group. In the second half, based on Dimension 2, the locations of male and female students of the control group are on opposite sides. It can be observed that the female participants of the control group have the same focus on cognitive effort as all participants of experiment groups. Both the control and the experiment groups’ positions are in the fourth quadrant, implying that as a category they have something in common. The relations between different points in the first and second halves show a more nuanced behavior than the statistical analysis provided and imply that gender has an influence on the cognitive behavior of students in this experiment.
Discussion
In this paper, the effect of a visual constraint on design behavior of architecture students was studied using retrospective protocol analysis. In order to observe the changes of design activities, the FBS ontology was used to code the protocols of the two groups: one designing without a visual constraint and the other designing with a visual constraint. The results of statistical analyses showed that in the visual constraint condition, participants expended less cognitive effort on behavior which was used before the structure. Also, the cognitive effort expended on synthesis and reformulation 2 as two design processes related to expected behavior decreased. These results showed that a visual constraint changed the design behavior of participants. The investigation of temporal changes of design processes showed that in the non-visual constraint condition, participants changed their attention to problem framing and problem solving several times during the design session. In the visual constraint condition, the focus on problem framing and problem solving did not change during the design session. In other words, in this visual constraint condition, participants increased their focus on solutions from the beginning of the design process. This result can be compared to another study which showed that a design brief with fewer constraints provides for more possible options so it becomes harder to generate solutions (Pauwels et al., Reference Pauwels, Strobbe and De Meyer2015). A new index was introduced in this paper to demonstrate the sequential change of design behavior based on the structure. In this index, the ratio of the pre-structure to post-structure design processes (P–P index) is measured during design sessions. It was expected that the distribution of cognitive effort related to the processes before and after the structure might be affected when participants used an example during designing. The P–P index was calculated for the two groups. It was observed that in the visual constraint condition, participants did not alter their focus on the pre- and post-structure design processes which was different from the non-visual constraint group that spent more time on producing a design.
The results of the statistical analyses related to the first research question (how does the design behavior of students vary when designing with and without a visual constraint?) suggest that design behavior was changed by a visual constraint. In previous research, Sio et al. (Reference Sio, Kotovsky and Cagan2015) showed that using one example led participants to deep investigation of design ideations, so our findings also contribute to that result by describing how distributions of cognitive effort changed.
In a previous study, the time between the two design sessions was about 1 month (Bilda and Gero, Reference Bilda, Gero, Gero and Goel2008) and based on that result, the order did not affect design behaviors of participants. In other studies (Chu et al., Reference Chu, Hung, Wu and Te Liu2017; Camba et al., Reference Camba, Kimbrough and Kwon2018), the time between design sessions was less than 1 month; however, the effect of order was not considered. In our research, participants experienced two design sessions with an interval of 1 week. The two groups of participants did visual and non-visual design sessions in a different order. The result of statistical analysis showed only a small difference in their design behavior, thus answering the second research question (how does the order of design sessions, one with a visual constraint and the other without, affect students’ design behavior when they experience two design sessions?).
The results of the statistical analyses related to the third research question (are there gender differences in design behaviors with and without a visual constraint?) implied that the design behaviors of male and female participants were not significantly different. However, the correspondence analysis indicated that in the non-visual constraint condition, female students did not exhibit the same behavior as the male students, specifically in the second half of the design sessions. This result contributed to the previous study that showed that female design performance was influenced by task (Bannerot, Reference Bannerot2006). In contrast, Goldschmidt and Sever (Reference Goldschmidt and Sever2011) showed that there was no difference between male and female students when designing with and without examples. Our findings contradict that study, but other studies have shown that there is an effect of gender on design behavior (Newcombe et al., Reference Newcombe, Bandura and Taylor1983; Suits and Lagowski, Reference Suits and Lagowski1994; Lu, Reference Lu2015; Alelyani et al., Reference Alelyani, Yang and Grogan2017; Milovanovic and Gero, Reference Milovanovic, Gero, Eriksson and Paetzold2019). An important aspect of our study was the method of measuring the effect of gender. The importance of the method of analysis on measuring the effect of gender was previously demonstrated by Newcombe et al. (Reference Newcombe, Bandura and Taylor1983). In our research, different tests were carried out. As a consequence, the difference in the result of this study might be due to the more nuanced analyses undertaken.
The design processes, which are the result of the FBS ontology coding, are transition processes between two design issues. Classifying them into the pre- and post-structure can provide a different insight when studying the design behaviors. The proposed P–P index can describe the distribution of cognitive effort during the design session based on the structure.
Using an ambiguous image as a visual constraint for second-year architecture students could be a limitation of this research. The participants experienced two design sessions during the second year. While they finished the introductory design solutions they were still novice designers, which means that possibly they had insufficient experience to use a visual constraint (Casakin and Goldschmidt, Reference Casakin and Goldschmidt2000; Casakin, Reference Casakin2010). However, the source of the image was an ambiguous architectural layout. An ambiguous image leads to multiple interpretations and potentially evokes insights (Muth et al., Reference Muth, Hesslinger and Carbon2015). However, other research that investigated the effect of visual constraints on design students showed that only advanced students could benefit from the representations that were not superficially similar to design solutions and had expert-like design behaviors (Casakin and Goldschmidt, Reference Casakin and Goldschmidt2000; Casakin, Reference Casakin2010). In other studies, students in different academic year levels showed differences in using representations with superficial similarities (Heylighen and Verstijnen, Reference Heylighen and Verstijnen2003; Ozkan and Dogan, Reference Ozkan and Dogan2013). A visual constraint can be used as an educational tool because it has the potential to change the design behavior of students. However, in order to extend the role of the visual constraint in education, different types of visual images and their effects on different level of students need to be investigated in further studies.
The results of this study are limited by the relatively small number of participants in the experiment. A larger study is needed to be confident that the findings can be generalized. In similar research, the number of protocols in each group was 12 or less (Yilmaz et al., Reference Yilmaz, Daly, Seifert and Gonzalez2015; Gonçalves et al., Reference Gonçalves, Cardoso and Badke-Schaub2016; Chu et al., Reference Chu, Hung, Wu and Te Liu2017), so this experiment fits within the standard set by previous research. Similar research with three or four variables has been conducted with a fewer number of design protocols (Yilmaz et al., Reference Yilmaz, Daly, Seifert and Gonzalez2015; Gonçalves et al., Reference Gonçalves, Cardoso and Badke-Schaub2016; Strimel et al., Reference Strimel, Kim, Bartholomew and Cantu2018). This may be because verbal protocol analysis is a very time-consuming technique (Atman and Bursic, Reference Atman and Bursic1998). Another limitation is in the use of the retrospective protocol because participants may not adequately remember their design thoughts after the design session. The retrospective session commenced immediately following the design session (Self et al., Reference Self, Evans and Kim2016) and participants watched the video of their design session and concurrently talked about their thoughts.
Conclusion
In this exploratory research about the effect of a visual constraint on design cognition, three variables were studied by analyzing verbal protocols. The main question of the research was how the design behavior of architecture students was affected by visual constraints, the other two questions were about the role of order of experiencing two design sessions and gender of participants. This study provides the results for the three questions by applying statistical and other methods that can be used in further research.
A visual constraint changed the distribution of cognitive effort. A visual constraint serves as a pedagogical strategy that leads students to focus more on the solution. It appears that in a visual constraint condition, participants do not spend more time on generating forms and shapes but in interpreting them as parts of a design solution. The order in which the constraint was presented had a small effect on students’ design behavior. Gender changed students’ design behavior. The methods of analysis have an important role in exploring the effect of gender on students’ design behavior.
Mohammadali Ashrafganjouei is an Assistant Professor of Architecture and Chairman of the Architecture Department in Saba Faculty of Art and Architecture at Shahid Bahonar University of Kerman. His PhD was about visual imagery and the effect of visual representations on the creativity of design students. He was in the University of North Carolina at Charlotte as a Visiting Researcher from October 2016 to April 2017. His current research interests include design cognition, design education, design creativity, and the effect of visual representations on students’ design behavior.
John S. Gero is a Research Professor in computer science and architecture at the University of North Carolina, Charlotte. He has authored or edited 54 books and over 700 papers and book chapters in the fields of design science, design computing, artificial intelligence, design cognition, and design neurocognition. His research has been cited over 23,000 times. He has been a Visiting Professor of architecture, civil engineering, cognitive science, computer science, design and computation, and mechanical engineering in the USA, UK, France, and Switzerland. He is the Chair of the conference series Design Computing and Cognition and a Co-Editor-in-Chief of the journal Design Science.


