


1. INTRODUCTION
In the jewelry industry, design and conventional model-making stages are major bottlenecks in the jewelry design and production process, especially for mass production and consumer markets (Wannarumon & Bohez, Reference Wannarumon and Bohez2004). Jewelry design involves various aspects such as investigation, analysis, creativity, and development. In the design process, designers have to deal with all of these aspects to balance beauty and usability of products. Several computer-aided design (CAD) packages have been developed to facilitate the designers' activities; nevertheless, there are only a small number of CAD tools that can support designers' activities since conceptual design.
A method that links designers and CAD systems is based on artificial intelligence (AI) techniques such as expert systems, case-based reasoning, and rule-based reasoning (Wann arumon et al., Reference Wannarumon, Unnanon and Bohez2004). During the development of the design tools, the researchers are able to learn and better understand the cognitive processes of designers' judgments and activities (Cross, Reference Cross2001). These tools are still limited in the design database and variety of designs, due to the difficulties in developing a knowledge base and design database. One of the possible ways to overcome such limitations is evolutionary design. Wannarumon and Bohez (Reference Wannarumon and Bohez2006) introduce a new evolutionary design approach to create art forms for jewelry design.
In this paper, we propose an interactive user-centered design system that involves an aesthetic-driven evolutionary algorithm, an iterated function system (IFS) design-lookup library, and a user–system interaction. The system is aimed at supporting users during the design of jewelry. Users are human designers and customers. Art forms used in jewelry design are represented by IFS fractals. The system works as an “art form generator” for creating the ornaments of a jewelry ring. Because human designers are good at aesthetic evaluation and process guidance, we take this into account to develop the system. The system offers two modes, automatic mode and manual mode, in initialization, selection, and termination.
The art form generator allows users to collaborate with it during design. The users can input their requirements and partial specifications in seeding the initial populations. The system assists users in discovering good forms and generating new forms. The algorithmic aesthetics is based on scientific theory. It supports users in evaluating the generated designs during the evolutionary design process. Users can select the existing forms to reproduce a new set of favorite alternatives in the next generations. Users can terminate the process or allow it repeat. The ultimate forms are selected either by the users or the system. The new evolved designs can be added into the design library.
The design system is integrated with manufacturing. Physical prototypes are automatically produced from the design by using Computer Numerical Control (CNC) and Rapid Prototyping (RP) machines. The integration reduces the design and manufacturing time. The overview of the design system is shown in Figure 1.

Fig. 1. Overview of the proposed design system. [A color version of this figure can be viewed online at www.journals.cambridge.org]
The paper is structured as follows. In the next section, the literature review is divided into three areas: evolutionary art and design, aesthetic measure theory, and fractal geometry. Section 3 presents the aesthetic-driven evolutionary algorithm. Section 4 describes the formulation of aesthetic measure and the analysis of aesthetic fitnesses. Section 5 provides the parametric study of genetic control parameters. The proposed genetic algorithm (GA) is demonstrated and discussed in Section 6. Finally, conclusions and future research directions are given in Section 7.
2. LITERATURE REVIEW
2.1. Evolutionary art and design
Evolutionary art and design is rooted in mimicking natural evolution, starting nearly 20 years ago. There has been some research in these areas that are used in design applications (e.g., Bentley & Wakefield, Reference Bentley, Wakefield and Rayward-Smith1996; Gero, Reference Gero1996; Rosenman, Reference Rosenman, Dasgupta and Michalewicz1996; Eckert et al., Reference Eckert, Kelly and Stacey1999; Rowland & Biocca, Reference Rowland and Biocca2000; Wloch & Bentley, Reference Witbrock, Neil-Reilly and Bentley2004; Bentley et al., Reference Bentley, Cox and Bentley2005; Koile, Reference Koile2006; Poirson et al., Reference Poirson, Dépincé and Petiot2006), including the creations of artistic images and forms (see literature on evolutionary art system in Table 1). This research proved that evolutionary art is an effective approach that can be used in design for supporting human design activities to create new artistic forms from scratch. Evolutionary art consists of the algorithms that create endless alternatives, which inherit good characteristics from existing ones and maintain variability of alternatives at the same time. Therefore, users are able to explore more alternatives based on their preferences.
Table 1. Summary of literature review on evolutionary art systems

NP, Not provided in the article. User interaction: 1, system allows user to input requirements to seed evolved shapes; 2, system allows user to define or adjust genetic parameters; 3, system allows user to assign fitness scores to individuals or select favorite individuals.
aThe processing time that the system needs to compute and generate the results.
The evolutionary art and design systems are based on evolutionary strategies (ES), evolutionary programming (EP), GA, and genetic programming (GP). Comparisons of ES, EP, GA, and GP are provided in Table 2. More details of evolutionary algorithms are described in Bentley (Reference Bentley and Bentley1999).
Table 2. Comparisons among ES, EP, GA, GP, and the proposed GA

ES, evolutionary stategies; EP, evolutionary programming; GA, genetic algorithm; GP, genetic programming.
Artificial evolution is based on the basic concepts of genotype and phenotype. It applies natural evolution mechanisms, such as genetic operator, mapping from genotype to phenotype, survival of the fittest, and selection to solve problems.
Genotype is a genetic representation that codes a chromosome as a basic unit of evolution to create individuals that are called phenotypes. Phenotypes have been represented in various ways such as forms, shapes, and images, depending on the systems' purposes (see Table 1).
Two classical genetic operators are crossover and mutation. They are used to reproduce new genotypes from existing ones. Crossover takes two or more selected parents, and randomly recombines their parts of chromosomes to create a new offspring. The power of crossover is the way in which the desirable genetic characteristics of parents can be combined and inherited in subsequent generations. The mutation operator involves generating a random variable for each allele in a sequence (an allele is an alternative form of genes that occupy a specific position on a specific chromosome). The variable points to whether or not a particular allele will be modified. Mutation is used to maintain population diversity during evolution. Several types of crossover and mutation are described in Michalewicz (Reference Michalewicz1996).
Fitness is a measure of phenotypes' abilities or properties. It is used to select and keep a set of fittest individuals for the successive generations. Selection gives force to the direction of evolutionary process. The selection processes are categorized into several types; see more details in Bäck and Hoffmeister (Reference Bäck, Hoffmeister, Belew and Booker1991).
Most evolutionary art systems generate new forms from random initial populations. New offspring is reproduced by using crossover and mutation. These offspring then inherit characteristics from their parents. Each individual in a population is evaluated for its fitness, which is typically based on aesthetic appeal, by human artists. User interfaces are developed to facilitate users to evaluate individuals' fitnesses, rank, or select favorite individuals for the next generation.
The interaction between humans and evolutionary systems is known as interactive evolutionary computation (IEC), which is a general term of EC. It optimizes systems and generates results, fitting the subjective human evaluation. It is popularly used in visual appeal such as attractiveness or aesthetic selection, which depends on a particular user preference. Various applications in IEC were surveyed and analyzed in Takagi (Reference Takagi2001). Several evolutionary art systems have been developed as interactive evolutionary design systems to support human designers (e.g., Eckert et al., Reference Eckert, Kelly and Stacey1999; Cho, Reference Cho2002; Wiens & Ross, Reference Wiens and Ross2002; Grundler & Rolich, Reference Grundler and Rolich2003; Greenfield, Reference Greenfield2005; Machado et al., Reference Machado and Cardoso2005).
2.2. Aesthetic measure theory
Aesthetics and aesthetic measure have been researched in various ways. Birkhoff (Reference Birkhoff1933) introduces the well-known aesthetic measure theory based on the analyses of aesthetic experience. He claims that “aesthetic feelings arise primarily because of an unusual harmonious interaction within the object.” He defines aesthetic measure as the ratio of complexity of the object and degree of order. Moles (Reference Moles and Cohen1966) presents a remarkable possibility to apply information theory to the study of aesthetic perception. He examines and analyzes the formal distinction between semantic and aesthetic information. Semantic information is the message contained in sequence. Aesthetic information is sensory, and restricted to the preferential choices of individuals.
Arnheim (Reference Arnheim1969) describes artistic activity as a form of reasoning, perceiving, and thinking. He explains visual thinking via three functions: pictures, symbols, and signs. Berlyne (Reference Berlyne1974) establishes the relation of complexity to visual preference as an inverted U-curve, with the preference peaks at some moderate amount of complexity. Machado and Cardoso (Reference Machado and Cardoso1998) found that visual aesthetic value is directly related to visual image perception, image complexity, and interpretation.
Remko and Rens (Reference Remko and Rens1993) review several aesthetic measure theories. They suggest that building formal models of human perceptual processes are the basis of any empirical aesthetic measure.
Fechner's investigations prove that the measurements that reflect golden ratios are the most satisfying to men's eyes (Huntley, Reference Huntley1970). From his surveys, the golden rectangles were chosen preferentially by over 75% of participants. Several researchers have attempted to explain the golden ratio and identify its psychological significance and human perception (e.g., Mahon & Battin-Mahon, Reference Machado, Romero, Cardoso and Santos1984; Green, Reference Green1995; Mainzer, Reference Mahon and Battin-Mahon2005). The golden ratio is associated with aesthetic appeal in art and architecture (Green, Reference Green1995; Sudweeks & Simoff, Reference Sudweeks, Simoff and Gammack1999; Mainzer, Reference Mahon and Battin-Mahon2005), sculptures (Rowland & Biocca, Reference Rowland and Biocca2000), furniture designs and graphic designs (Elam, Reference Elam2001), human proportion (Mainzer, Reference Mahon and Battin-Mahon2005), and the human face (Fett, Reference Fett2006).
Weyl (Reference Weyl1952) and Rosen (Reference Rosen1998) describe symmetry theory and the beauty of symmetry. Field (Reference Field2001) illustrates symmetrical patterns that play a major role in the aesthetics of wallpaper. There exist several types of symmetry such as rotational symmetry, mirror symmetry, and so forth. One more type of symmetry found in nature and chaos is logarithmic spiral symmetry (Tacha, Reference Tacha2002).
Staudek (Reference Staudek2003) studies visual patterns and perceptions. He presents a system with algorithmic aesthetics, which integrates a computer into artistic creation and aesthetic evaluation. His work involves mathematics, geometry, perceptual psychology, theory of communication, and computer graphics to classify and assess aesthetics. His system can generate algorithmic arts from a set of abstract images, textures, and patterns. Aesthetic functions evaluate aesthetics in terms of order, complexity, harmony, variety, entropy, and redundancy.
Aks and Sprott (Reference Aks and Sprott1996), Spehar et al. (Reference Spehar, Clifford, Newell and Taylor2003), Minita and Abraham (Reference Mitina and Abraham2003), and Sprott (Reference Sprott2004) prove that aesthetic appeal of fractals depends on fractal dimensions and the Lyapunov exponent. Complex forms and structures reflect aesthetic expression via emergent organizing properties, self-organizing behavior, and chaotic dynamic (Galanter & Levy, Reference Galanter and Levy2003).
The literature reviews on aesthetic measure theory are summarized in Table 3.
Table 3. Literature review on aesthetic measures
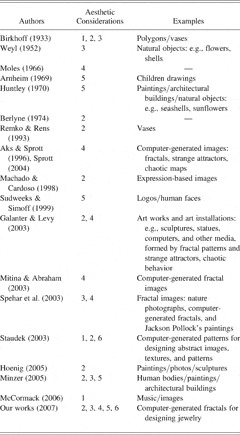
Aesthetic considerations: 1, proportion; 2, complexity; 3, symmetry; 4, unpredictability; 5, golden ratio; 6, computational aesthetics.
2.3. Fractal geometry and the IFS
An IFS is a set of affine transformations, which are defined by any combination of scaling, rotation, shearing, and translation of point sets. IFS is an effective method for modeling and generating self-similar fractals (Barnsley, Reference Barnsley1993, pp. 80–81). The advantage of IFS is image compression into a compact set of numbers.
An IFS fractal is made up of the union of several copies of itself, each copy being transformed recursively by an affine transformation. Fractals produced by IFS functions are often found in aesthetic image generation. IFS is an easy way to generate self-similar aesthetic patterns with minimal time and space complexity.
IFS consists of a complete metric space (X, d) together with a set of contraction mappings with contractivity factors s n, |s n| ≤ 1 for n = 1, 2, … , N, where n is the index for each affine map. Affine transformation of a point set in the Euclidean plane is defined as a map w: ℝ2 → E 2 and w(x, y) = (ax + by + e, cx + dy + f), where real numbers a, b, c, d ∈ [−1, 1] and e, f ∈ (−∞, ∞).
An IFS consists of a finite number of contraction maps; IFS is rewritten in matrix form as
IFS can be written in the form of a polar coordination such as
where (r 1, θ1) is the polar coordinate of point (a, c) and (r 2, (θ2 + π/2)) is the polar coordinate of point (b, d) . IFS rewritten in Eq. 2 is to measure IFS's similitude, which relates to rotational and logarithmic spiral symmetry. The real numbers a, b, c, and d control scaling, rotation, and shearing. The real numbers e and f control translation.
IFS consists of at least two affine transformations. Each transformation has its own selection probability, pi. This probability determines the frequency with which the affine transformation is selected from the IFS to be applied to the point set in the random iteration algorithm (RIA; Barnsley, Reference Barnsley1993, pp. 87–88).
To render the resulting fractal from IFS codes, Barnsley (Reference Barnsley1993, p. 85) introduced the approximation of selection probability p i of each affine transformation A i by

and ∑i=1Np i = 1 and p i > 0. This equation is based on fast convergence to render corresponding fractal.
There is some research that uses fractals in artistic design applications. Neves et al. (Reference Neves, Neves and Janssens1994) introduced fractal geometry in textile design applications. Sprott (Reference Sprott1994) uses IFS to represent nonfunctional forms in his system. Goldman et al. (Reference Goldman, Schaefer and Ju2003) applied IFS in turtle geometry and turtle programming in computer graphics and CAD. Browne and Wamelen (Reference Browne and Wamelen2006) describe a simple method for creating artistic-connected spiral sets as fractals. Nikiel (Reference Nikiel2006) uses IFS combined with vector graphics to create new artistic forms. Soo et al. (Reference Soo, Yu and Chiu2006) applied IFS fractals to model jewelry and hand-carved furniture.
IFS is still not widely used in evolutionary art and design. IFS genotypes appear in a few evolutionary art systems (e.g., Rowley, Reference Rowley and Bentley1999; Joye, Reference Joye2005). IFS is applied to generate the shape of antenna elements in GA optimization (Pantoja et al., Reference Pantoja, Ruiz, Bretones, Martín and Romeu2003). Other types of fractal are also used in evolutionary art systems, for example, Julia sets and Mandebrot sets. The researches of IFS applications in evolutionary art are included in Table 1.
As can be observed from the literature review, IFS is noticeably successful in art and design, due to its important geometric and mathematical properties including image compression. In this paper, IFS is further explored to represent art forms in the design of jewelry.
3. AESTHETIC-DRIVEN EVOLUTIONARY ALGORITHM
The major characteristics of GA are close to our system architecture. We develop a core of the system based on GA and apply the special characteristics of other evolutionary algorithms (see Table 2) to break through some limitations of GA. This aims to easily encode chromosomes and make them flexible, to simplify develop and handle genetic operators, and to decrease processing time.
We propose the GA for increasing diversity of solutions, achieving maximum aesthetic values in a short time, but at the same time preventing too fast a convergence. The proposed GA is based on a multiple parent system. Therefore, an individual is reproduced by two or more parents. Our assumption is that offspring inherit at least one affine transformation from their parents. The multiple parent system offers more diversity of art forms. The proposed GA is illustrated in Figure 2.

Fig. 2. The proposed genetic algorithm for the interactive user-centered design system.
The proposed GA acts as a human–machine interaction system that allows users to work together with the system through an IEC interface (Takagi, Reference Takagi1998) in three stages: process initialization, aesthetic selection, and process termination. The system is to speed up EC convergence with a small population size and a few generations.
3.1. IFS genotype
The IFS described in Section 2.3 is encoded in a GA genotype as a one-dimensional (1-D) chromosome with a variable length. We apply this structure, because it is easy to handle, to extend the length of chromosome, and to develop genetic operator.
An IFS consists of at least two affine transformations. Each affine transformation is encoded in six alleles {a, b, c, d, e, f}, where the real numbers a, b, c, d ∈ [−1, 1] and e, f ∈ [0, 1], represent one gene. The length of the chromosome string then depends on the number of affine transformations (or genes).
FDESIGN, Fractal Designer software developed by Nelson (Reference Nelson2004), is used to produce IFS fractals and to generate the resulting IFS codes. IFS chromosomes are stored in an IFS design-lookup library. The library will be used for seeding the initial population.
Another method for generating a new design based on the existing IFS is the use of the “condensation set theorem” (Barnsley, Reference Barnsley1993, pp. 91–94). By selecting the point to which IFS affine transformations are applied from a predefined condensation set, we can embed any figure into the result. Accordingly, users can integrate any two-dimensional (2-D) shapes in the existing designs. A set of IFS codes and the resulting starlike fractal are shown in Figure 3a. An example of applying a condensation set to the fractal illustrated in Figure 3b.

Fig. 3. An example of applying the condensation set: (a) an integrated function system fractal and (b) a condensation set applied to the fractal.
3.2. Mapping the IFS genotype to the fractal phenotype
In our evolutionary art, each individual must be evaluated based on eight fitness characteristics (aesthetic variables). Three characteristics (mirror, rotational, and logarithmic spiral symmetry) are measured directly from genotypes (IFS codes) before the mapping process. The rest of the characteristics (capacity and correlation dimension, largest Lyapunov exponent, golden ratio, and fractal complexity) are measured from phenotypes, after mapping from genotypes. This method reduces the processing time spent in the evaluation process. As a result, the system has a good response time.
Before measuring the individuals' fitnesses, the genotypes are explicitly mapped to the phenotypes. Mapping is done by using an RIA to decode an IFS to its resulting fractal. RIA requires selection probabilities of affine transformations to render a fractal. In this paper, we studied two ways to compute selection probabilities.
3.2.1. Probability computed using Barnsley's equation
Barnsley (Reference Barnsley1993) presents a computation of selection probability as shown in Eq. (3). These probabilities give fast convergence in rendering a fractal. The disadvantage of this probability is that we may lose opportunities to explore other fractal shapes due to fast convergence.
3.2.2. Uniform random probability
We propose the use of uniform random numbers to generate selection probability for rendering fractals,
where r i is a uniform random number in the range of [0, 1] and ∑i=1Np i = 1.
The reason we apply a uniform random number for rendering fractal is that it can create unique and more diverse forms. This approach includes “emergent property” (Gero, Reference Gero1996; Cross, Reference Cross1997), which can include creativity into our system.
An example of the use of uniform random probability is described. A leaflike IFS code consists of two affine maps. Using Barnsley's probabilities computed by using Eq. (3), we obtain the resulting probabilities p 1 and p 2. Running RIA by using the IFS with such probabilities, the resulting fractal is rendered as shown in Figure 4a.

Using three different sets of the uniform random probabilities computed by Eq. (4), three resulting fractals are generated as shown in Figure 4b–d.
From the above example, it is clear that using only one set of IFS with various sets of probabilities can create more diverse fractals. We apply this idea to increase variety and creativity of art forms during the evolutionary design process. In other words, this concept offers a source of diversity.
3.3. Fractal phenotype
We found that jewelry designers mostly initialize their designs by 2-D sketches and later transform them to three-dimensional (3-D) shapes. During the evolutionary process, fractal phenotypes are represented as 2-D point clouds, which are later transformed into 3-D solid models using CAD software.
3.4. Genetic control parameters
The efficiency of the GA is affected by the number of initial parents (n ip), mutation probability (p m), and crossover probability (p c). These genetic control parameters influence population size, productivity, and diversity of the solutions during evolutionary process. We optimize the genetic control parameters by parametric study, further explained in Section 5.
Population size is varied by n ip, p m, and p c:

where round means integer value of. The size of the sampling space depends on population size. The sampling space is enlarged by retaining all parents and all offspring in the population rather than replacing parents by new offspring. This action can provide more alternatives for the next generation.
3.5. Genetic operator
The genetic operator is aimed to reproduce a new set of individuals, to maintain diversity, and to offer creativity based on existing ones. A new generation is composed of the individuals that are reproduced by mutation and crossover, as shown in Figure 2.
3.5.1. Multi-Gaussian mutation
Multi-Gaussian mutation generates a Gaussian random number r(0, σ) for each allele in a genotype. All alleles are simultaneously modified by their Gaussian random numbers within the defined rate d (e.g., 5, 10%, etc.). For example, if an IFS genotype G(i) consists of three affine maps, the mutation operator will generate 18 Gaussian random numbers (r 1, r 2, r 3, … , r 18) and apply these numbers in sequence to each allele with the defined rate d, as shown in Figure 5.

Fig. 5. An example of multi-Gaussian mutation.
3.5.2. Modified arithmetic crossover
Modified arithmetic crossover covers both single-point crossover and multiple-point crossover. It reproduces new offspring using the componentwise linear combinations of parents. The crossover points are randomly selected by the system, and not be allowed locating inside the intervals of genes. The crossover points are located only where the individuals can exchange the genes (or affine transformations).
For example, the system reproduces a new set of individuals using three parents: parent 1, parent 2, and parent 3, which consist of two, three, and four affine transformations, respectively. A new set of offspring are reproduced; some of them are shown in Figure 6. Some offspring are reproduced from more than two parents, for example, offspring 3 and offspring 5 are reproduced from three parents.

Fig. 6. An example of modified arithmetic crossover.
3.6. Two-step fitness function
We develop a two-step fitness function that consists of a morphological fitness function and an aesthetic fitness function. The first step is to measure the morphology of the art form. In this step, the morphological fitness function helps us to discard unfit art forms from the process. This can reduce computation in the fitness function and then speed up the GA. Only good individuals in the morphological fitness test will be selected to go to the second step to measure aesthetics of the art form by the aesthetic fitness function (see the workflow of the fitness function in Fig. 2). The details of two-step fitness function are further described in Section 4.
3.7. Selection to the next generation
Survival into the next generation is done either by automatic selection or user selection. Automatic selection is based on individual's computed fitness. In addition, we include elitist strategy (Bäck & Hoffmeister, Reference Bäck, Hoffmeister, Belew and Booker1991) in our selection scheme. All parents are allowed to join in the selection process together with their offspring. Elitist strategy preserves some good individuals to the next generations. This avoids the lack of good individuals disappearing after some generations. In the manual selection, users rank and select the favorite individuals for the next generation.
3.8. Termination criteria
There are several ways to terminate the GA:
• A predefined maximum number of generations such as 10, 15, and 20 generations can be used.
• Convergence of the population's fitness to the maximum aesthetics value of 1 is another method. The aesthetics value is a combination of several aesthetic variables computed with the aesthetic fitness function in Eq. (21), further explained in Section 4.
• Stopping the process when the users are satisfied (i.e., “in the eye of beholder”), or
• starting a new run of the evolutionary design by users can also be utilized to terminate the GA.
4. TWO-STEP FITNESS FUNCTION: ALGORITHMIC AESTHETICS AND AESTHETIC VARIABLES
In jewelry design, one of the most important aspects is aesthetic appeal. Even though aesthetic appeal is subjective, several researches prove that aesthetics can be linked with universal human aesthetic perception such as symmetry, balance, complexity, and proportion (e.g., Birkhoff, Reference Birkhoff1933; Weyl, Reference Weyl1952; Moles, Reference Moles and Cohen1966; Arnheim, Reference Arnheim1969; Huntley, Reference Huntley1970; Berlyne, Reference Berlyne1974; Machado & Cardoso, Reference Machado and Cardoso1998; Rosen, Reference Rosen1998; Sudweeks & Simoff, Reference Sudweeks, Simoff and Gammack1999; Staudek, Reference Staudek2003; Hoenig, Reference Hoenig, Neumann, Sbert, Gooch and Purgathofer2005).
In this section, we classify these universal subjective aspects to formulate a computational aesthetics. We describe a methodology to develop a morphological algorithm and an aesthetic algorithm to be used in the two-step fitness function in the proposed GA. We also introduce the use of the aesthetic measure for fractal-based jewelry design.
4.1. Aesthetic measure
Several measures that reflect aesthetics of forms and fractals are applied in our computational aesthetics. These measures include golden ratio, complexity, mirror symmetry, rotational symmetry, logarithmic spiral symmetry, compactness and connectivity, unpredictability, and fractal dimensions. Fractal dimension can be quantified in terms of capacity dimension and correlation dimension. This measure is based on mathematical foundations of fractal geometry, chaotic behavior, and image processing. The aesthetic measures used in the fitness computation and the corresponding data formats to compute the fitness are summarized in Table 4.
Table 4. Summary of aesthetic measures and corresponding formats used for fitness computation

4.1.1. Capacity dimension
The capacity dimension (F 1) provides an objective mean for comparing fractals. We can measure it by the box-counting theorem (Barnsley, Reference Barnsley1993, pp. 171–195). This method starts by subdividing a bounding box of fractal with the boxes of side length (1/2s), where s is the number of steps, and then counting the number of boxes that intersect the fractal. A higher capacity dimension means that the fractal fills more space. Our process generates both 1-D and 2-D fractals, then capacity dimension ranges over 0 ≤ F 1 ≤ 2. Here, F 1 is normalized into the interval [0, 1] by dividing F 1 by 2.
4.1.2. Correlation dimension
The correlation dimension (F 2) is a measure of space occupied by a set of random points. It is similar to the capacity dimension, but it also measures the contraction rate of the points that land on a fractal. Euclidean distance between two neighboring points, computed by using the ATRIA algorithm (Merkwirth et al., Reference Merkwirth, Parlitz, Wedekind and Lauterborn2002). Grassberger and Procaccia (Reference Grassberger and Procaccia1983) introduce a method to measure F 2 by using correlation integral. We use the correlation integral function in OpenTSTOOL (Merkwirth et al., Reference Merkwirth, Parlitz, Wedekind and Lauterborn2002) and least-square linear regression to compute F 2. Correlation dimension of 2-D fractals are in the range of [0, 2]. Therefore, we normalize F 2 into the interval [0, 1] by dividing by 2. Correlation dimension can express appearances and characteristics of fractal. With a higher F 2, points are globally spread to cover a wider area. With a lower F 2, points are condensed in a smaller (or local) area.
4.1.3. Largest Lyapunov exponent
We apply the largest Lyapunov exponent (F 3) for computing the divergence of two neighboring points; one point represents one trajectory or one orbit. It determines how quickly trajectories that begin in nearby points diverge over time. The largest Lyapunov exponent can characterize the trajectories' divergences as an average exponential rate over time. The positive largest Lyapunov exponent is quantified based on Sato et al. (Reference Sato, Sano and Sawada1987) and Parlitz (Reference Parlitz, Suykens and Vandewalle1998). We use OpenTSTOOL (Merkwirth et al., Reference Merkwirth, Parlitz, Wedekind and Lauterborn2002) and least-squares linear regression for computing F 3. We normalize F 3 into the interval [0, 1] by 1/(1 + e −λ1). A higher F 3 means less separation between two nearby orbits; therefore, the point set is more connected and compact. A lower F 3 indicates a larger separation between two nearby points; the art form becomes disconnected and less compact.
4.1.4. Image complexity
We extend the method introduced by Niimi et al. (Reference Niimi, Noda and Kawaguch1997) for measuring the complexity embedded in black-and-white fractal images. Image-processing techniques (Gonzalez & Woods, Reference Gonzalez and Woods2001) are applied on a 0/1 bit map of the fractal. The bounding box is represented by width W B and length L B. The total length of the black-and-white border of the fractal is calculated by the summation of a number of color changes along rows and columns in the bounding box. The maximum border length is computed from (W B × (L B − 1)) + ((W B − 1) × LB). We then compute the image complexity (F 4) of the IFS fractal by
where k R is the summation of the number of color changes along rows in the bounding box of the IFS fractal, and k C is the summation of the number of color changes along columns in the bounding box of the IFS fractal. Computed image complexity is in the ranges of [0, 1]. A more complex fractal F 4 is closer to 1. A less complex fractal F 4 is closer to 0.
4.1.5. Golden ratio
The quantifying golden ratio (F 5) starts by defining two perpendicular directions. The reference axis A is perpendicular to a finger, whereas the reference axis B is along the finger.
Find the centroid of the fractal, and then place the reference axes on it. Compute the width (W) and length (L) of the bounding box of the fractal. Find the ratio of W/L. Calculate the difference between the bounding box ratio W/L and the golden ratio φ as
where the reference φ is about 1.6180339 (Huntley, Reference Huntley1970).
We derive
to normalize the difference of the fractal's bounding box ratio and the golden ratio in the range of [0, 1].
The reference axes are rotated until the maximum value of F 5 is obtained. The value of F 5 shows how much the fractal's bounding box ratio is from the golden ratio.
4.1.6. Mirror symmetry
Like the golden ratio, the mirror symmetry (F 6) depends on the same reference axes. Find the centroid of the fractal, and then place the reference axes on it. Based on image processing techniques (Gonzalez & Woods, Reference Gonzalez and Woods2001), the fractal is divided into two parts along the B axis, then compute the difference between the left part L part and the right part R part as
Rotating the reference axes until the minimum value of F 6 is obtained. Mirror symmetry F 6 ranges in the interval [0, 1].
4.1.7. Rotational symmetry
The rotational symmetry (F 7) of the IFS fractal can be measured from the concept of similitude (Barnsley, Reference Barnsley1993, pp. 54–64). To measure rotational symmetry, IFS is rewritten in the polar form, as shown in Eq. (2), for each affine transformation. From our experiments, we found that any IFS fractal that has rotational symmetry contains at least one rotational affine map. The conditions for checking the rotation of affine map are
1. Δ(θ1, θ2), θ1 − θ2 → 0, and Δ(r 1, r 2),
2. θ1, θ2 ≥ 45° and r 1, r 2 → 1.
Next, we divide Δ(θ1, θ2) by 90° to normalize it in the range of [0, 1]. The rotation factor is defined as θR = 1 − (Δ(θ1, θ2)/90°), where θR is a rotation factor, then 0 ≤ θR ≤ 1, and 0 ≤Δ(r 1, r 2) ≤ 1, r R = 1 − Δ(r 1, r 2), where r R is a scaling factor. Thus, rotational symmetry is formulated as
where

4.1.8. Logarithmic spiral symmetry
Like rotational symmetry, the logarithmic spiral symmetry (F 8) can be quantified from the similitude of affine transformation with the following conditions:
1. Δ(θ1, θ2), θ1 − θ2 → 0 and Δ (r 1, r 2), r 1 − r 2 → 0,
2. θ1, θ2 < 45° and r 1, r 2 → 1.
We found that logarithmic spiral symmetry appears when the rotation angles of the affine map are more than 45°. Logarithmic spiral symmetry is formulated in the same manner as rotational symmetry. Thus,
where

Examples of the variation of all above aesthetic variables are illustrated in Table 5.
Table 5. Examples of the variation of all aesthetic variables

4.2. Morphological fitness function
Morphological fitness function is developed for evaluating compactness and connectivity of art forms in advance. Referring to mathematical theory of metric spaces and set theory (Barnsley, Reference Barnsley1993, pp. 19–24), let (X, d) be a complete metric space. Let S ⊂ X be a subset of a metric space (X, d). Then S is compact if and only if it is closed and totally bounded. Conversely, S is incompact if and only if it is unclosed and unbounded.
Intuitively, this means that incompact subsets produce fractals in which the embedded points are disconnected and discrete from each other. An example of incompact and compact forms is shown in Figure 7.

Fig. 7. A comparison of the morphology between two art forms: (a) a disconnected and incompact form and (b) a compact form.
We compute three variables: capacity dimension F 1, correlation dimension F 2, and largest Lyapunov exponent F 3 of 200 various fractals characterizing compactness and connectivity. The F 1 value ranges from 0.2245 to 0.9525, F 2 ranges from 0.2344 to 0.9663, and F 3 ranges from 0.0 to 0.8457.
First, compactness and connectivity of art forms are computed using image processing. Compactness is computed from the perimeter power 2 and then divided by the area of the art form (Gonzalez & Woods, Reference Gonzalez and Woods2001). Connectivity is computed by counting the fraction of connected pixels (Gonzalez & Woods, Reference Gonzalez and Woods2001).
Second, experiments and statistical analysis are used to investigate the relations of compactness and connectivity to the aesthetic variables. We found that capacity dimension F 1, correlation dimension F 2, and largest Lyapunov exponent F 3 have influences on compactness and connectivity of the fractals.
Third, using factor analysis, a linear model of compactness and connectivity is formulated:
Using regression analysis, we obtain the morphological fitness:
where CC^ is the estimated compactness and connectivity, and CC^ ∈ [0,1].
The higher the CC^ value, the higher the compactness and connectivity in the art form. We use CC^ in Eq. (13) as the morphological fitness function to evaluate individuals' morphology during evolutionary process, as stated in Section 3.6. In our experiments, the individuals that have CC^ lower than 0.38 are incompact and disconnected. Any individual that is incompact and disconnected always yields low aesthetics. In this step, the individuals that have a CC^ higher than 0.38 will be selected to go to next step. This can reduce processing time and speed up the GA.
4.3. Aesthetic fitness function
4.3.1. Methodology to develop the initial aesthetic mathematical model
We generate 200 various art forms with aesthetic variables (F 1, F 2, … , F 8) provided in Table 6. All art forms are measured for their eight aesthetic variables F i. Coefficient αi is a weight assigned to each aesthetic variable F i (see Table 4). All aesthetic variables (F 1, F 2, … , F 8) are normalized in the range of [0, 1], as discussed before. To formulate an initial model, our assumption is that all aesthetic variables have equal influence on aesthetics. In other words, all coefficients αi = 1,

Factor analysis is applied for data reduction or structure detection. It is used to reduce the number of variables (F 1, F 2, … , F 8) and to detect a structure in the relationships among the variables. This work is done using statistical analysis software (SPSS Version 11). From factor analytic techniques, the resulting new factors are given as two linear combinations of aesthetic variables. The linear combinations are regression lines that represent the best summary of the linear relationships between the variables F i.
Table 6. Ranges of all aesthetic variables of the selected art forms

Factor 1:
Factor 2:
From factor loadings, we obtain the weights (α1, α2, … , α8) of the variables (F 1, F 2, … , F 8) as shown in Eqs. (15) and (16). It is clear that the first factor fac1 has high weights on logarithmic spiral symmetry F 8, golden ratio F 5, and rotational symmetry F 7. The second factor, fac2, has high weights on mirror symmetry F 6 and the largest Lyapunov exponent F 3.
Based on linear regression analysis, relationships between aesthetic factors (fac1, fac2) and effects of aesthetic factors to the aesthetic values A^ linear in Eq. (14), we obtain the linear aesthetic computation model:
When the weights or coefficients (α1, α2, … , α8) are varied, they affect the factors fac1 and fac2, and then aesthetic scores computed by A^linear. As a result, the generated art forms change.
4.3.2. Methodology to develop a human aesthetic attractiveness model
We recognize that there are several subjective aspects, which are nonquantifiable, that influence human aesthetic considerations. Humans have their own senses to evaluate aesthetic individually. Therefore, the subjective aesthetic attractiveness of jewelry rings' ornaments is studied through surveys, interviews, and questionnaires, which are based on theory of design of experiment (Montogomery, Reference Montogomery2001).
Our target group consists of 72 members of university community: 36 males and 36 females. Participants were 24–35 years old. Eighty ring designs generated by our system are selected based on aesthetic values and randomly presented to the participants. The samples used for the survey are provided in Figure 8 with the aesthetic scores from our initial model Eq. (17) and the scores from the survey next to each design.

Fig. 8. A template of the jewelry ring designs generated by the system and used in the surveys. A1, Aesthetic score computed by the system using Eq. 21; A2, aesthetic score from the surveys; A1 and A2 are normalized in the range of [0, 1]. [A color version of this figure can be viewed online at www.journals.cambridge.org]
Color is not included in our system. Therefore, in the survey, we requested the participants to consider only the shapes of ornaments, so all have the same gold color. The participants were asked to assign the aesthetic score {0, 1, 2, … , 6} to each of 80 designs, where 0 is assigned for the most unattractive, and 6 is assigned for the most attractive or beautiful.
We apply statistical analysis to analyze the results from the survey. Curve-fitting and nonlinear regression techniques are used to formulate the computational aesthetics. The resulting formulation is that the survey scores A^survey have cubic dependence upon fac1 and fac2:

The model fits to the survey results with R 2 = 0.655. In curve fitting, R 2 ranges are [0, 1], where 1 means the fittest.
4.3.3. Investigation of aesthetics of the popular long-lasting forms
Other artifacts that are considered as beautiful forms are the popular long-lasting symbols, such as a cross, star, yin-yang, swastika, female, male, and peace (see Fig. 9). They play important roles as icons that influence human psychology and human aesthetic perception.

Fig. 9. A template of the results of testing the aesthetic fitness by the popular long-lasting forms. Aesthetic A is computed by using Eq. (21).
In the design of jewelry, sometimes designers are inspired by these symbols. Therefore, the symbols are used as a part of verification of the algorithmic aesthetics. We compute their aesthetic variables (F 1, F 2, … , F 8) and use the results to improve the algorithmic aesthetics in the next section.
4.3.4. Verification and adjustment of the aesthetic fitness function
We take into account the results of the survey and the investigation of popular long-lasting symbols to adjust the algorithmic aesthetics. We apply the factor analytical techniques to classify the aesthetic variables (F 1, F 2, … , F 8) computed from the various art forms and the popular long-lasting symbols and to analyze the relationships between variables in terms of factors. The results of factor loadings are given in terms of factor 1 (fac1_ad) and factor 2 (fac2_ad):
Factor 1:
Factor 2:
It is clear that the first factor fac1_ad has high weights on capacity dimension F 1, correlation dimension F 2, and golden ratio F 5. Rotational F 7 and logarithmic spiral symmetry F 8 still play a role in fac1_ad, but less than in fac1. The second factor fac2_ad has high weights on mirror symmetry F 6 and largest Lyapunov exponent F 3, the same as in fac2.
Using regression analysis, we obtain new aesthetic fitness A^(ad) that has cubic dependence upon fac1_ad and fac2_ad:

The measure of model fit is R 2 of 0.728. This model is a better fit to the data than Eq. (18).
Accordingly, we use the aesthetic algorithm A^ad in Eq. (21) to evaluate aesthetics of art forms in the aesthetic fitness function, as described in Section 3.6. All of the aesthetic mathematical models are summarized in Table 7.
Table 7. Summary of the aesthetic models

4.4. Results and discussion on aesthetic computing
In the tests of the aesthetic fitness function, our assumption is that the popular long-lasting forms should have higher aesthetic scores than other forms. We use 160 various art forms generated by our system, a set of 80 ring designs used in the survey, and 32 popular long-lasting forms in our tests. The details of the tested art forms are provided in Table 8.
Table 8. Summary of ranges of all aesthetic variables of the tested art forms

The statistical result of the aesthetic fitness computation A^linear in Eq. (17) gives the average scores of 0.5576. The standard deviation of the computed aesthetics is relatively low (see Table 9). The different art forms with different sets of aesthetic variables have not much difference in the computed aesthetics. The A^linear in Eq. (17) cannot clearly classify between bad and good art forms. The resulting computations and their statistical analysis show that the aesthetic measure A^ad Eq. (21) is closest to the results of the survey and the study of the popular forms. In addition, the measure A^ad has better differentiation between bad and good forms than A^linear and A^survey (see Table 9).

SD, Standard deviation.
Using the aesthetic measure A^ad in Eq. (21), the resulting aesthetic scores of the popular long-lasting forms fall in the range of [0.80, 0.99] (see Fig. 9), which is higher than other art forms. This result proves that the aesthetic measure A^ad is the most significant. The aesthetic fitness A^ad formulated from Factor 1 (fac1_ad) and Factor 2 (fac2_ad) shows the cubic dependence upon both factors. The fac1_ad is the combination of rotational symmetry, logarithmic symmetry, and golden ratio. The fac2_ad measures mirror symmetry.
Capacity dimension F 1 correlation dimension F 2, and largest Lyapunov exponent F 3 have more influence on aesthetic attractiveness in fac1_ad and fac2_ad than fac1 and fac2, due to the fact that they reflect the compactness and connectivity of the forms. Compactness and connectivity reflect to morphologies of the forms that have influence in human perception.
We do not conclude that our aesthetic algorithm can entirely quantify aesthetics. In fact, we do believe that humans have their own sense to assess aesthetics individually. Aesthetic considerations are based on two parts: universal aesthetics aspects that can be quantified and nonquantifiable information. This result support Moles's study of aesthetic perception (Moles, Reference Moles and Cohen1966).
Our aesthetic evaluation is validated in three ways. The first way is based on the well-known theories of human perception in Table 3. The second way is based on the results of the surveys of aesthetic attractiveness. The third way is done by the use of popular long-lasting symbols.
The results of the surveys confirm that aesthetics is linked with universal aesthetic perception aspects such as symmetry, balance, complexity, and proportion. We found that the logarithmic–spiral–symmetrical forms affect human aesthetic perception and correlate with the golden ratio, because they reflect order and balance of the elements inside the forms.
From the study of popular forms, we found that the preferred forms mostly contain mirror symmetry, rotational symmetry, and golden ratio. Other variables, such as logarithmic spiral symmetry, do not clearly appear in those samples.
We examine the relationship between the golden ratio and aesthetics of jewelry forms through the popular logos and symbols and the survey. We apply statistics and factor analysis to discover the relationship between the golden ratio and human preference. We found that visual aesthetic preference is directly related to the golden ratio and the golden rectangle. Therefore, we can use the golden ratio for evaluating the good proportion in jewelry design.
By using factor analysis, we found reasonable correspondence from the survey and the investigation of popular long-lasting forms. The weighting coefficients αi of the aesthetic variables F i in the aesthetic measure are adjusted according to the factor analysis.
5. PARAMETRIC STUDY
We design full factorial experiments to explore the parameter setting for the proposed GA. The purpose is to optimize the genetic control parameters (number of initial parent n ip; mutation probability p m; crossover probability p c; and population size pop_size). We explore the population size ranges from 3 to 16. The experiments are divided into two tests. The first test is the study of the parameters within a limited running time (1830 s). The second test is the investigation of the parameters in a long run (4300–5500 s). The results of the parametric study show a tradeoff between time and quality of solutions, as shown in Table 10.
Table 10. Summary of the results of the parametric study in the short run and long run

aCase 1: Genetic algorithm using an iterated function system with the associated probabilities computed by Barnsley's equation.
bCase 2: Genetic algorithm using an iterated function system with the uniform random probabilities.
The maximum aesthetics for the case of short run time is lower than the case of long run. We explore the long run behavior and the convergence of the GA. The number of consecutive generations that the fitness does not change is shown in Table 10; this number can be used as a stopping criterion in the GA.
6. DEMONSTRATION OF AESTHETIC-DRIVEN EVOLUTIONARY ALGORITHM
The proposed GA and all experiments are implemented on an ACER Pentium 4 PC (2.8 GHz CPU, 60 GB RAM) using MATLAB V.6.5.
6.1. GA and its efficiency
We construct an IFS design library that contains 200 chromosomes for seeding the initial population. The genetic parameters based on the parametric study in Section 5 are the number of initial parents n ip = 3, mutation probability p m = 0.75, crossover probability p c = 0.75, population size pop_size = 9, and maximum number of generation max_gen = 15.
The process converges to the maximum aesthetic score computed by the A^ad in Eq. (21). The A^ad is the combination of several aesthetic variables. Based on the surveys, we found that human aesthetic perception has a relation to more than one variable, as well as the fact that some aesthetic variables have a relation to the other variable. For example, the logarithmic–spiral–symmetrical forms are related to the golden ratio.
From the experiments it is found that mutation offers variation of individuals but less than crossover. However, mutation has an advantage in that it can maintain variety of good individuals in the gene pool. Crossover causes a larger number of individuals that lack compactness and connectivity, but crossover offers higher variation and creativity of individuals.
From our study of jewelry design for consumer market, a jewelry company typically creates about 50–60 designs a week. A jewelry designer typically creates approximately three designs per day (6 working h). In other words, a jewelry designer takes 3 h (10,800 s) on average to design a jewelry ring. Fashion movement limits the time for design. Hence, our objective is that the interactive evolutionary design system can work with the designer in the design of jewelry faster than the designer works alone.
We measure the performance of the GA by comparing with the production rate of a jewelry designer. Our system takes 30–35 min on average for generating one design solution. Compared to human design, we can reduce design time by 145 min or about 80%. In other words, within 3 h we can create five designs by our system, while a human designer creates one design. It shows that our system can increase productivity in the design process.
Rosenman and Gero (Reference Rosenman, Gero, Gero and Maher1993) describe that creative design consists of four properties: combination, mutation, analogy, and first principles. Cross (Reference Cross1997) presents a generic descriptive model of creative design, which includes an emergent property introduced by Gero (Reference Gero and Dartnall1994). From the above references, we can conclude that our evolutionary design system is a creative design process, which can generate creative designs from those properties.
6.2. Population size
The reasons that we use small population size are the following:
1. Bentley (Reference Bentley and Bentley1999, p. 43) suggests using population sizes <10. The system then quickly judges all individuals in every generation. There are several evolutionary systems that use population sizes <10 (e.g., Dawkins, Reference Dawkins1986; Sim, Reference Sim1991; Todd & Latham, Reference Todd and Latham1992, Reference Todd, Latham and Bentley1999; Rowland & Biocca, Reference Rowland and Biocca2000; Grundler & Rolich, Reference Grundler and Rolich2003).
2. In our interactive evolutionary design, users work collaboratively with the system. Therefore, a good response time is necessary. The smaller the population size, the faster the individuals improve their fitness from one generation to the next generation. Grundler and Rolich (Reference Grundler and Rolich2003) and McCormack (Reference McCormack2006) support these arguments. In addition, the small population size can increase the productivity of generated designs.
6.3. Role of selection probability for rendering the fractal
To explore the role of selection probability in the RIA, as explained in Sections 3.2.1 and 3.2.2, we divide the experiments into two cases: case 1, using IFS with the associated probability computed from Eq. (3), and case 2, using IFS with the uniform random probability generated by Eq. (4).
Because the outputs of GA are stochastic, we replicate each test problem 30 times, and then compute the average value for evaluation. We evaluate the GA by comparing the best solution of the first generation to the best solution of the final generation; this number is called “improvement ratio.” It explains how much the GA can improve individuals. The other indicator is the GA consistency, which is measured from the deviation of the results,

In the short run, the GA in case 1 yields higher aesthetic fitness within the predefined maximum number of generations (max_gen = 15) than case 2. The GA in case 1 converges faster to the maximum fitness value (after the seventh generation) than case 2. The GA in case 2 can improve the fitness value, but takes a longer time. The behavior of the GA in case 1 and case 2 are shown in Figure 10. The experimental results of the GA in the short run are provided in Table 11.

Fig. 10. The behavior of the genetic algorithm in cases 1 and 2.
Table 11. Experimental results of the tested parameter set in short run

aCase 1: Genetic algorithm using an iterated function system with the associated probabilities computed by Barnsley's equation.
bCase 2: Genetic algorithm using an iterated function system with the uniform random probabilities.
One advantage of case 2 is the ability for generating art forms with higher variety and creativity. Notice that case 2 has a higher variation of the computed aesthetics, a higher run time, and a higher improvement ratio. These results imply that case 2 is less consistent than case 1, because there is more randomness in the process; this event provides the emergent property to produce unpredictable forms. The experimental results of the GA are summarized in Table 10.
7. Conclusions And Future Work
A GA and an algorithmic aesthetics for interactive design were developed. These two parts are combined together into an aesthetically driven evolutionary design system to support users for creating artistic forms during design.
7.1. GA
The efficiency of the GA is measured by productivity and diversity of the solutions. Users can interact with the system in three stages: process initialization by input specifications and their preferences, individual selection for the next generation, and process termination. Mutation and crossover work as sources of diversity that are applied to a population to reproduce a new set of individuals. The factorial experiments are used to analyze the effects of genetic control parameters: mutation probability, crossover probability, and population size. Parametric study is used in optimizing these parameters. We obtain the best set of the parameters for the GA that preserves diversity and aesthetics of art forms, and at the same time, minimizes the processing time.
7.2. Algorithmic aesthetics
The algorithmic aesthetics is based on universal aesthetics principles. It is validated by well-known theories of human perception and aesthetics, mathematical foundations, survey, and popular long-lasting forms. The morphological and aesthetic algorithms are used for automatic aesthetic evaluation in a two-step fitness function.
The two-step fitness function evaluates morphology and aesthetics of the art forms. The first-step fitness function eliminates unfit forms based on their morphologies, and only the good forms can pass to the aesthetic fitness test. This approach reduces the processing time. The total time used in the design process is reduced by about 80%. Because the designs are generated by computer in electronic formats, the prototypes then can be produced faster by CNC and RP machines.
7.3. Contributions
The outcomes of the research contribute to several fields: AI in design, design study, and aesthetic computing, especially for nonfunctional design. The morphological and aesthetic algorithms are also applicable for other industrial product designs such as the ornamental parts for watches, tableware, furniture, architecture, and so forth. The ornamental parts have influences on human emotion and product attractiveness. They essentially identify the concepts, characters, and styles of products. These can be expressed via forms, curves, lines, symbols, and logos.
7.4. Future works
Schaefer et al. (Reference Schaefer, Levin, Goldman, Desbrun and Pottmann2005) prove that curves and surfaces can be modeled as fractals, showing ways to extend our work to artistic functional design. Wannarumon et al. (Reference Wannarumon, Unnanon and Bohez2004) classify the styles of jewelry that can be extended to develop stylistic fitness function.
It is possible to develop an individual's stylistic algorithm for any designer by collecting data when they are selecting the designs during the process. We then could use these data to develop the stylistic algorithms for their special fitness functions. Other criteria that should be taken into account in design evaluation are color and manufacturability.
ACKNOWLEDGMENTS
The first author thanks her PhD scholarship donors, the Austrian Government, and the Asian Institute of Technology. The authors also thank CIFAC Co., Ltd. Jewelry design and manufacturer, Bangkok, Thailand, for providing valuable information and material in jewelry design and manufacturing. A sincere thanks to Dr. Kriskai Sitthiseripratip and his staff in the Computer Aided Medical Technology Laboratory, National Science and Technology Development Agency, Thailand, for supporting Geomagic Studio software including the RP machine Z-Printer.
Somlak Wannarumon is a Lecturer in the Industrial Engineering Department, Faculty of Engineering, Naresuan University, Thailand. She received her PhD in design and manufacturing engineering from the Asian Institute of Technology in 2007. Her research focuses on AI in product design and value engineering in product design, including computational aesthetics. She applies her research to jewelry design applications.
Erik L.J. Bohez is an Associate Professor in design and manufacturing engineering in the School of Engineering and Technologies, Asian Institute of Technology, Thailand. He has extensive experience in CAD/computer-aided manufacturing/CNC, mold and die design, robust control, five-axis machining, adaptive control, hyper-redundant robots, and flexible manufacturing systems.
Kttinan Annanon is currently a Researcher at the National Science and Technology Development Agency, Thailand. He earned his PhD in industrial engineering and is experienced in the area of product design and development. Recently, he extended his research interests to cover the area of machine design and development for biomass processing and utilization.


