


Introduction
The maximisation of good health and wellbeing in old age is a priority goal for health practitioners, policy makers and older people themselves. Outcomes for older people are not judged merely by increased longevity (survival) and physical health but also by the quality of their lives (Glass Reference Glass2003; Katz and Calasanti Reference Katz and Calasanti2014; Martin et al. Reference Martin, Kelly, Kahana, Kahana, Willcox and Poon2014). The concepts of healthy and successful ageing are now a routine part of our understanding of the ageing process. Various studies have examined predictors of positive outcomes for older people (Cho, Martin and Poon Reference Cho, Martin and Poon2015; Depp and Jeste Reference Depp and Jeste2006; Johnson, Sarkisian and Williamson Reference Johnson, Sarkisian and Williamson2014; Meng and D'Arcy Reference Meng and D'Arcy2015; Rowe and Kahn Reference Rowe and Kahn1987; Sargent-Cox, Butterworth and Anstey Reference Sargent-Cox, Butterworth and Anstey2014). However, few studies have taken an individual differences perspective focusing on the different trajectories that older people may follow in old age. Typically the studies are underpinned by the assumption of a single ageing trajectory of first being disability free and then becoming disabled (Jagger et al. Reference Jagger, Gillies, Cambois, Van Oyen, Nusselder and Robine2009; Manton, Vertrees and Clark Reference Manton, Vertrees and Clark1993). How to transition from ageing poorly to ageing well is rarely studied. Given the heterogeneous population of older people, this approach could provide valuable insights into potential changeable factors that may benefit many to improve during old age and to continue to age well.
The aim of our study was to identify ageing-well trajectories and their predictors in the 1,000 person Melbourne Longitudinal Studies on Healthy Ageing (MELSHA) programme in Australia (Browning and Kendig Reference Browning and Kendig2010). Our model of ageing well (Kendig et al. Reference Kendig, Browning, Thomas and Wells2014) is based on a qualitative study with older people where we examined their perceptions of life goals and the role of health in identity and ageing experiences (Kendig Reference Kendig, Chappell, Kendig and Walker1996). That study identified keeping physically and socially active, having a positive outlook on life, and maintaining independence, good functional health and good mental wellbeing as key components of ageing well from the perspectives of older people. In this study, ‘ageing well’ is defined as continuing to live in the community with good physical and psychological health. Ageing well in the current study uses an index comprising self-rated health, functional health and psychological wellbeing measures. This approach to defining ageing well is consistent with a large and increasing number of studies and reviews of the definitions of successful and healthy ageing where factors such as physical health, psychological wellbeing, independence and social engagement are common ageing-well themes identified by older people (Cosco et al. Reference Cosco, Prina, Perales, Stephan and Brayne2013; Depp, Glatt and Jeste Reference Depp, Glatt and Jeste2007; Depp and Jeste Reference Depp and Jeste2006; Jopp et al. Reference Jopp, Wozniak, Damarin, De Feo, Jung and Jeswani2014; Martin et al. Reference Martin, Kelly, Kahana, Kahana, Willcox and Poon2014; Martinson and Berridge Reference Martinson and Berridge2014; Pruchno et al. Reference Pruchno, Wilson-Genderson, Rose and Cartwright2010). A key observation in the recent literature in this area is that the conceptualisations from older people are important in informing models of ageing and may facilitate the development of health and ageing policy that is more acceptable to and congruent with the views of older people (Bowling and Iliffe Reference Bowling and Iliffe2006; Browning and Thomas Reference Browning and Thomas2007; Jopp et al. Reference Jopp, Wozniak, Damarin, De Feo, Jung and Jeswani2014; Miilunpalo et al. Reference Miilunpalo, Vuori, Oja, Pasanen and Urponen1997).
We have previously examined baseline predictors of threats to ageing well over a 12-year period and found that chronological age, multi-morbidity, low perceived social support, low nutritional score and being under-weight were key factors in poor outcomes in late life (Kendig et al. Reference Kendig, Browning, Thomas and Wells2014). In this paper, we aim to describe the different trajectories of health and wellbeing across 16 years of the MELSHA survey, and determine the common and unique predictors of these trajectories for men and women. Our rationale for this study is that in order to design targeted health-promotion programmes for older people, we need to understand the key modifiable factors that may influence outcomes for different groups of older people.
Reviews of predictors of successful and healthy ageing have identified a range of variables that focus on predicting both good and poor outcomes in old age. Behavioural factors predictive of successful ageing based on longitudinal data include not smoking, being physically active, maintaining normal weight and moderate alcohol use (Peel, McClure and Bartlett Reference Peel, McClure and Bartlett2005). Depp and Jeste (Reference Depp and Jeste2006) found strong evidence for an association between successful ageing and the absence of arthritis or hearing problems, not smoking and better activities of daily living (ADL) scores. Moderate predictors of successful ageing included higher physical activity levels, lower blood pressure, absence of depression, fewer medical conditions and better global cognitive functioning. The authors noted that demographic factors such as female gender, education and income were not predictive of successful ageing despite predicting mortality and health status in a number of longitudinal studies. They suggested that by measuring successful ageing using composite measures (rather than a single outcome measure such as survival), individual characteristics may become more important predictors than demographic factors. However, we argue that it is important to examine ageing well in men and women separately as we have previously found that predictors of ageing well differ for men and women (Kendig et al. Reference Kendig, Browning, Thomas and Wells2014). Depp and Jeste (Reference Depp and Jeste2006: 17) noted that most studies examining successful ageing were focused on ‘the development of pathology or functional impairment in ageing … and not maintenance of positive or desirable states’. Thus, definitions are based on the absence of indicators of ill health or impaired functioning rather than the presence of indicators of good health and functioning. This resonates with the World Health Organization definition of health in which it is asserted that health is a positive state not merely the absence of disease (Ustun and Jakob Reference Ustun and Jakob2005).
Our own now somewhat dated review (Browning and Thomas Reference Browning and Thomas2007) of studies of predictors of successful ageing concluded that the majority of studies focus on predicting the negative aspects of ageing, such as functional decline, morbidity and mortality, while others focus on predicting positive aspects of ageing such as happiness and high physical and mental functioning. The predictors that are potentially modifiable can be conceptualised as risk factors for poor outcomes or protective factors for good outcomes. The modifiable risk factors for poor outcomes are high blood pressure, high cholesterol levels, and being overweight or underweight (Depp and Jeste Reference Depp and Jeste2006; Meng and D'Arcy Reference Meng and D'Arcy2015). The modifiable protective factors for good outcomes are engaging in social and productive activities, moderate alcohol intake, not smoking and moderate levels of physical activity (Cho, Martin and Poon Reference Cho, Martin and Poon2015; Johnson, Sarkisian and Williamson Reference Johnson, Sarkisian and Williamson2014; Sargent-Cox, Butterworth and Anstey Reference Sargent-Cox, Butterworth and Anstey2014). Many of these modifiable risk and protective factors are linked to the probability of developing diseases such as diabetes and cardiovascular disease, which in turn have been shown to be associated with poor outcomes in old age. In our model of ageing well, we include positive measures of good health and functioning.
The aim of this study was to identify improvable and recoverable factors associated with ageing well in a cohort of 1,000 older men and women in Australia who were studied over 16 years. An ‘ageing well’ variable will be created for each participant at each of the nine study waves; ageing well will be defined as an index comprising self-rated health, functional health and psychological wellbeing measures. Our study had several important features. First, we will not assuming a homogenous inevitable decline and instead adopt an individual differences approach. This leads to our first hypothesis:
• Hypothesis 1: There is more than the one ageing trajectory of diminishing health, and these trajectories can be mapped using the ageing-well properties obtained from 1,000 older people followed over 16 years.
Second, we have made provision for sex differences, which leads to our second hypothesis:
• Hypothesis 2: Older people are not a single homogenous un-gendered group and there will be different ageing-well trajectories for each gender.
In order to inform the knowledge base that is imperative to health promoters and public health leaders to potentially create targeted strategies and programmes that enable people to improve and recover from a ‘not ageing well’ category to an ‘ageing well’ category, thereby diverting from a trajectory of deteriorating health and wellbeing, our third hypothesis is:
• Hypothesis 3: Individual characteristics and gender differences can predict and influence the ageing trajectories and there are important and modifiable factors that promote people to attain (or recover) an ageing-well health and wellbeing status.
This paper reports the ageing trajectories of older Australians; an important global complement to the many studies conducted in the United Kingdom (UK) and the United States of America. We used trajectory modelling to map the different ageing trajectories based on our ageing-well definition over a 16-year period.
Design and methods
Study design
The data reported in this paper were collected in a 16-year longitudinal observational study, involving older participants (aged 65 years and over at baseline) who were living in private dwellings at baseline, in Melbourne. The background and methods of this MELSHA study have been reported in detail elsewhere (Browning and Kendig Reference Browning and Kendig2010; Kendig et al. Reference Kendig, Helme, Flicker, Teshuva, Osborne and Browning1996).
Setting
The setting was metropolitan Melbourne, Victoria, in Australia. Data were collected over the period 1994 to 2010. In 1994, Melbourne had a population of 3.2 million and 12.3 per cent were aged 65 years and over. By 2010, the population had increased to 4.08 million with 13.7 per cent aged 65 years and over (Australian Bureau of Statistics 2013). Approval by an Aged Care Assessment Team (ACAT) is required for entry to residential care facilities accredited by the Australian government. The multi-professional ACATs make clinical decisions based on the preferences and health and care needs of each individual and his or her carer/s in the context of locally available services. Residential care is funded primarily by national aged-care payments, and user payments are typically paid from the user's basic Age Pension. In the state of Victoria (including Melbourne), the availability of alternative community aged-care packages increased from 11.2 per 1,000 in 2002 to 18.2 in 2005 (for more information about the Australian context, see Cubit and Meyer Reference Cubit and Meyer2011).
Sample
The study included participants who at baseline were (a) aged 65 year or older and (b) living in private dwellings. The study excluded those who (a) were at baseline living in non-private accommodation (including residential aged care); (b) could not speak basic English (11.3% of the sample frame); and (c) could not be interviewed for health reasons.
Detailed participant recruitment and follow-up procedures are reported elsewhere (Browning and Kendig Reference Browning and Kendig2010). Respondents in the baseline survey were followed up biennially with telephone interviews and yearly by mail. Over the following 16-year period, there were nine data collection time-points. Repeated measures were collected from participants until they died or became ineligible for study inclusion.
Variables
In this study, a dichotomous variable outcome of ‘Ageing Well’ was calculated at each of the nine study time-points for each participant using the available survey data. ‘Ageing Well’ was defined as a binary variable (yes/no), where a ‘yes’ value was recorded only if a participant met all three of the following criteria:
1. At least good self-rated health (good, very good or excellent, as opposed to poor or fair).
2. Independent capacities in instrumental ADLs (shopping, gardening or housework).
3. Good psychological wellbeing (a positive affect score of 18 or better). The wellbeing measure corresponds to scoring 4 or 5 on most of the five items from the positive affect scale of the brief positive and negative affect measures (Lawton et al. Reference Lawton, Kleban, Rajagopal and Dean1992).
A participant was assigned a value of ‘no’ for ‘Ageing Well’ if any of the above criteria were not met. Missing values for ‘Ageing Well’ were assigned only if all of the above three criteria had missing data.
The data collected in MELSHA were extensive and included demographics, health behaviours, medical conditions and service use, amongst others (Browning and Kendig Reference Browning and Kendig2010). The questionnaire drew on a range of validated health status surveys available at the time and new measures on older people's own views developed out of our earlier qualitative research (Kendig et al. Reference Kendig, Helme, Flicker, Teshuva, Osborne and Browning1996). Table 4 variables and footnotes specify the predictor variables examined in this paper. They fall into three broad areas: socio-demographic (age, marital status, education, country of birth), health (medical conditions, pain, cognitive impairment, falls in last year, falls needing treatment, urinary incontinence) and lifestyle measures (smoker, strain, restful sleep, physical activity, nutrition, perceived social activity adequacy, perceived social support and social activity).
Bias
The response rate for the baseline interview was 70 per cent, yielding a sample representative of older people in living in the community in Melbourne at the time, apart from those too ill to be interviewed and non-English-speaking people.
To ensure the completeness of follow-up data collected at the nine time-points we employed the following tracing procedures. Respondents were contacted by telephone. Where respondents could not be contacted directly, the tracing procedures relied primarily on next of kin or other individuals volunteered by respondents as key contacts at the time of the baseline interviews. Death records were checked for individuals who were known to have died as well as for those who otherwise could not be contacted.
Statistical methods
Cluster analysis was used to identify groups of people with similar trajectories of ageing. The binary outcome of ‘Ageing Well’ at each of the nine waves for each participant was used to identify similar groups having similar outcomes. To do this, group-based trajectory modelling was performed, which assumes that the sample contains a mixture of underlying trajectory groups (Hsu and Jones Reference Hsu and Jones2012; Nagin Reference Nagin2005). Group-based trajectory models were created using the logit ‘Traj’ analysis code for Stata (Jones and Nagin Reference Jones and Nagin2013; Jones, Nagin and Roeder Reference Jones, Nagin and Roeder2001; Nagin Reference Nagin2005) and different models were created for each gender. Goodness-of-fit measures were the Schwarz Bayesian information criterion and Akaike information criterion. To determine the optimal model, consideration was given to the goodness-of-fit measures and the parsimony principle. Analyses of dropouts were also performed, to investigate the rates and types of dropouts within each trajectory group. Inclusion of dropouts as a variable in the trajectory modelling was also examined. Missing data were not imputed.
Ordinal logistic regression was used to identify univariate associations between baseline (1994) variables and ageing trajectory (groups: 1 = stable-poor; 2 = deteriorating; 3 = stable-good). Candidate variables where those that had p < 0.10 in the univariate model. Correlated variables having a Pearson's r > 0.3 were examined, and the variable with the least missing data was selected as the candidate variable for inclusion into the initial multivariate model. Multivariate ordinal logistic modelling was then applied by including all candidate variables in the initial model. Stepwise dropping of variables from subsequent models occurred if p < 0.10. The final model consisted of significant predictors having p < 0.05.
Sensitivity analyses were done consisting of 1,000 bootstrapped samples drawn with replacement from 90 per cent of the original data-set. The number of samples a variable was identified as significant was noted. Variables identified as significant in more than 50 per cent of samples were noted as robust predictors, whilst those in less than 50 per cent were noted as weak or insignificant predictors.
Results
Table 1 shows the number of participants in each study wave during the 16-year period. The number of participants who were ‘Ageing Well’ in each study wave is shown in Table 2. Table 2 clearly shows the statistical utility of using a measure based on three ageing-well criteria. If we had used any of the three individual measures as outcomes in the analyses, e.g. self-rated health, instrumental ADLs or positive affect, then modelling would be problematic because of low data availability. This becomes even more problematic in later years, when participant numbers were very low, particularly when separated by gender. Table 2 also provides evidence that ceiling effects were avoided by using the composite ‘Ageing Well’ measure. Unlike the three individual measures, especially self-reported ADL, the majority of over 80 per cent reported good outcomes in the first six waves. These ceiling effects would limit the sensitivity of the findings, but were avoided by use of the composite outcome measure.
Table 1. Retention and attrition of Melbourne Longitudinal Studies on Healthy Ageing (MELSHA) participants and known outcomes
Note: 1. Limited resources/funds in Waves 7 and 9.
Table 2. Number of participants ‘Ageing Well’ in each study wave
Notes: ‘Ageing Well’ is a composite score including all three criteria: (a) self-reported health (SRH) reported as either good, very good or excellent; (b) instrumental activities of daily living (IADL) when shopping, gardening or housework; and (c) a positive affect score of 18 or better. The table clearly shows that if we used any of the three individual measures as outcome to model (SRH, IADL or positive affect), then modelling would be problematic because of sparse data. For example, most people had a ‘good’ score (and zero scores were sparse). This ‘sparseness’ became even more problematic in later years, when subject numbers were low.
Multiple models were generated and examined using the longitudinal data. Table 3 shows the goodness-of-fit results for each model. Optimal models were obtained within each gender when three trajectory groups were identified (i.e. Models 4, 6, 8 and 10). Models did not alter greatly within each gender group if adjusting for baseline age, e.g. male data were used to create Models 4 and 8, and both of these models produced similar goodness-of-fit results.
Table 3. Model description and goodness-of-fit measures
Notes: When comparing two models, lower values for Bayesian information criterion (BIC) and Akaike information criterion (AIC) indicate better goodness of fit. 1. Sparse data in groups, thus the BIC and AIC should be interpreted with care. X: Optimal model identified.
An optimal group-based trajectory for women (Model 10) is shown in Figure 1 and for men (Model 8) in Figure 2. Together Figures 1 and 2 reveal similar groupings within both genders. Approximately one-third (33.6% of females and 29.7% of males) began the study with a high probability for ageing well and this remained stable over the next 16 years. However, the majority in both genders (50.5% females and 47.6% of males) began the study with a high probability for ageing well which then significantly deteriorated over the years. The remaining trajectory group within each gender initially showed a very low probability of ageing well that remained low. Women appeared to have a poorer trajectory result in this group, showing a zero probability, whilst men had a 0.2 probability. This means that the 103 females identified at baseline to be ‘not ageing well’ all remained within this category in the later years; unlike the 114 males identified at baseline to be ‘not ageing well’ who had a 0.2 probability of improving and being classified as ageing well at a later date.
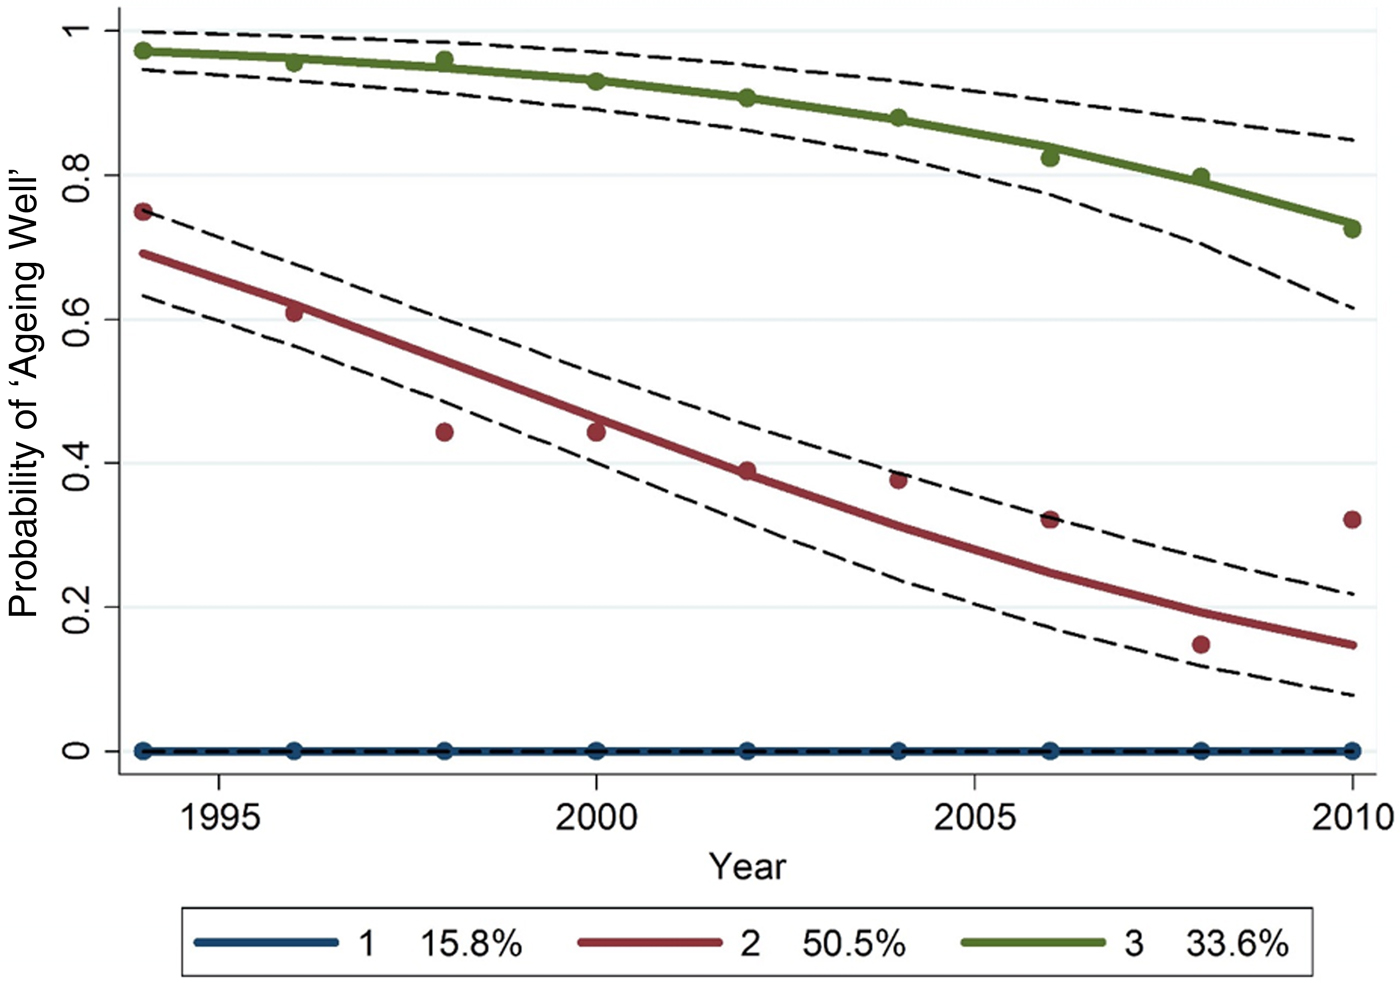
Figure 1. Female group-based trajectory for ‘Ageing Well’, after adjustment for baseline age.
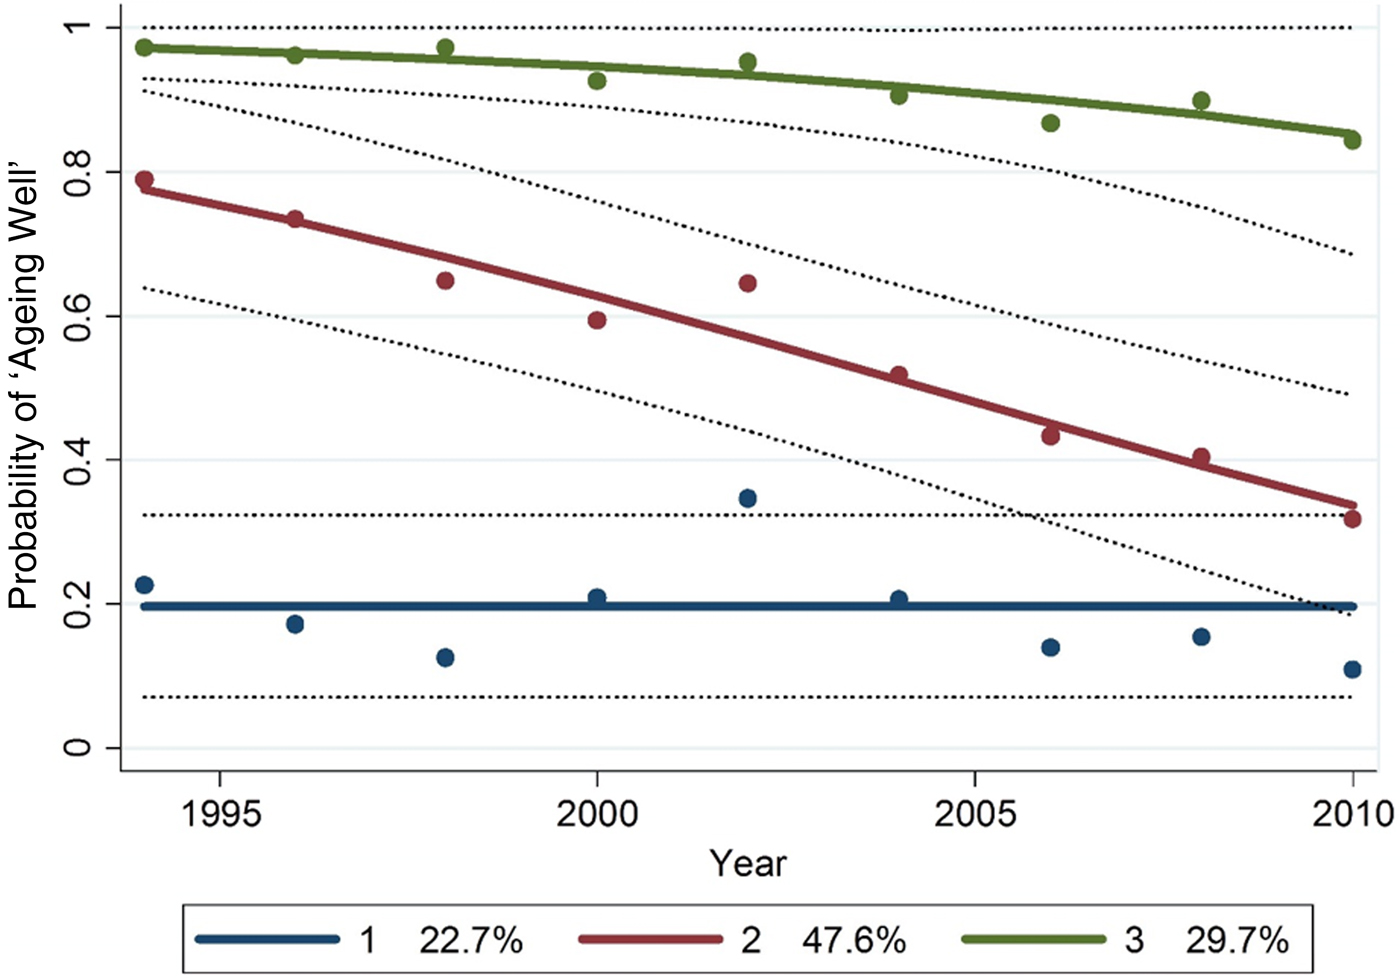
Figure 2. Male group-based trajectory for ‘Ageing Well’, after adjustment for baseline age.
Further, when comparing the proportions in the stable-poor groups there were 103/533 (19.3%) females which was significantly lower than 114/467 (24.4%) men (z-statistic = −2.6, p = 0.005).
Table 4 compares characteristics of participants within each group for each gender. Model 8 was used to group the male data, and Model 10 for the female data.
Table 4. Baseline (1994) characteristics by trajectory group of the 1,000 participants
Notes: 1. Income score: pre-tax weekly income (1–11 income categories ranging from 0 to Aus $926 or more). 2. Pain: daily pain (1), once or twice per week (2), once or twice per month (3), a few times a year (4), never (5). 3. Cognitive impairment score: derived from the Organic Brain Syndrome Scale (0–9), where 9 is more impaired. 4. Fall requiring medical treatment in the last year. 5. Urinary incontinence score: measures urge incontinence, where 0 is continent and 1 is incontinent. 6. Strain score: how often do you feel that you are under so much strain that your health is likely to suffer? Never (5), rarely (4), sometimes (3), frequently (2), very frequently (1). A high score indicates low strain. 7. Restful sleep score: how often do you feel really rested when you wake up in the morning? Most of the time (4), sometimes (3), rarely (2), never (1). 8. Total physical activity score in last two weeks: type and frequency of activities scored from 0 to 18, where 18 denotes more active. 9. Nutrition score: based on the Australian Nutrition Screening Initiative, scores ranged from 0 to 19, where 19 denotes poorer nutrition. 10. Perceived social activity adequacy score: 1 is not enough or too much, 2 is about right. 11. Perceived social support score: five questions scored not true (0), partly true (1), certainly true (2), scores ranged from 0 to 10. 12. Social activity score in last two weeks: nine activities scored as yes/no, scores ranged from 0 to 9.
Significance levels: * p < 0.05, ** p < 0.01, *** p < 0.001. The significance within gender indicates the difference across groups. The significance by gender at each wave is shown in the last column.
Dropouts
The total dropout rate was 0.897 for women and 0.835 for men over the 16 years. The rates of dropout in each wave for each trajectory group are shown in Table 1. Overall female dropout rates were: group 1 (stable-poor) 0.971; group 2 (deteriorating) 0.950; and group 3 (stable-good) 0.771. Overall male dropout rates were: group 1 (stable-poor) 0.939; group 2 (deteriorating) 0.860; and group 3 (stable-good) 0.705. Dropout proportions were significantly less in group 3 (stable-good) compared to the other groups for both sexes (female z-tests, p < 0.0001; male z-tests, p < 0.001). Including dropouts as a variable in the trajectory modelling did not improve model fit and, in fact, resulted in poorer goodness-of-fit measures (see Table 3).
Table 5 shows the significant univariate associations between baseline variables and ageing trajectory group (1 = stable-poor; 2 = deteriorating; 3 = stable-good) determined using ordinal logistic regression. For women, the candidate variables that were correlated were: lives alone and married (r = −0.78); lives alone and income (r = −0.41); married and income (r = 0.54); and pain and tally of medical conditions (r = −0.43). Lives alone and tally of medical conditions were selected to enter the multivariate modelling. For men, the correlated candidate variables were: lives alone and married (r = −0.79); married and income (r = 0.35); and lives alone and income (r = −0.30). The lives alone variable was selected.
Table 5. Significant univariate associations between baseline (1994) variables and ageing trajectory
Notes: OR: odds ratio. CI: confidence interval. Group (1 = stable-poor; 2 = deteriorating; 3 = stable-good) determined using ordinal logistic regression. 1. Continuous variable. 2. Categories compared in the analysis.
Table 6 shows the multivariate models between baseline variables and ageing trajectory. Sensitivity analyses consisting of 1,000 bootstrapped samples drawn with replacement from 90 per cent of the original data-set identified the following variables as significant in the male data: in 90–100 per cent samples: age, strain and medical conditions tally; 80–89 per cent samples: nutrition and perceived social support; 60–69 per cent samples: current smoker. Social activity was identified as significant in 46 per cent of samples, suggesting that it was not a strong predictor.
Table 6. Multivariate models between baseline (1994) variables and ageing trajectory

Notes: OR: odds ratio. CI: confidence interval. Group (1 = stable-poor; 2 = deteriorating; 3 = stable-good) determined using ordinal logistic regression. 1. Continuous variable. 2. Categories compared in the analysis. 3. Sensitivity analyses suggested that this variable was overall a weak or insignificant predictor.
In the female data, the bootstrapped sensitivity analyses identified the following variables as significant in 90–100 per cent samples: age and medical conditions tally; 80–89 per cent samples: country of birth; 70–79 per cent samples: restful sleep. Nutrition was identified as significant in 48 per cent of samples, suggesting that it was not a strong predictor. Social activity was identified as significant in 29 per cent of samples, suggesting that it was not a significant predictor.
Discussion
As people live longer, growing levels of chronic illness and mental disorders have become a global health policy focus (Beard and Bloom Reference Beard and Bloom2015; Danial et al. Reference Danial, Motamedi, Mirhashemi, Kazemi and Mirhashemi2014; Tonelli and Riella Reference Tonelli and Riella2014; Wang and Chen Reference Wang and Chen2014). We have addressed this global ageing issue by identifying important and modifiable factors that promote people to attain (or recover) an ‘ageing well’ health and wellbeing status. We have not treated the heterogeneous ageing population as ‘one-size-fits-all’ by using a single ageing trajectory of diminishing health. Instead, we have identified different ageing-well trajectories of 1,000 Australian men and women over a 16-year period. We found three distinct trajectory groups: stable-poor, deteriorating and stable-good. The minority belonged to the stable-poor group, providing evidence that most Australians (84.2% of women and 77.3% of men) aged by initially experiencing positive health and wellbeing. Around a third of the sample belonged to the stable-good group (33.6% of women and 29.7% of men). This is a positive result as over a 16-year period one-third of the survivors remained ageing well. Around half the sample belonged to the deteriorating group (50.5% of women and 47.6% of men). Men were slightly yet significantly more likely than women to belong to the stable-poor group (15.8% of women and 22.7% of men). However, women had a poorer trajectory result for men in this group: none of the women identified as stable-poor at baseline improved over the 16 years whereas the men in this group had a 20 per cent chance of improving. Few longitudinal ageing studies have examined predictors of ageing well over an extended period. In this study, we have differentiated between different trajectories of ageing well and confirmed distinct trajectories indicative of different outcomes for older people. For those who began the study ageing well, one group maintained this status while a second group showed a decline in health and wellbeing. A third group began the study in poor health and remained so.
For both men and women, robust predictors of membership of the ageing-well trajectories were age and number of medical conditions. However, there were other robust predictors of trajectory group that were different for men and women. For women, being Australian-born and having restful sleep predicted membership of an ageing-well trajectory. Another two variables (nutrition and social activity) were initially identified but sensitivity analyses suggested that these variables overall were weak or insignificant predictors. For men, strain, current smoker, nutrition and social support were the key predictors. Social activity was identified as a weak predictor for men. So for women the modifiable factors for ageing well were a lower number of medical conditions and restful sleep. For men, the modifiable factors were low strain, not smoking, good nutrition and adequate social support. The stable-poor ageing group for men had a one-in-five probability of improving to an ageing-well status at a later time, whilst for women this probability was zero. The modifiable factors in men (low strain, not smoking, good nutrition and adequate social support) appeared to be malleable and were seen to change at later dates, suggestive that improving these factors assisted men to improve ageing-well status more readily than women. For women in this sample, although the number of medical conditions can be considered as modifiable, the number of medical conditions did not reduce over time. Also for women, restful sleep was an important predictor for improving ageing-well status; but in this sample there was very little evidence of restful sleep status changing over the study period. These results indicated that restful sleep behaviour and reducing the number of medical conditions is difficult to improve in women in later life. If we could help women achieve restful sleep in later life and reduce the number of medical conditions, then this study suggests that the positive benefits might extend to an improved ageing-well status.
These modifiable risk factors are consistent with findings from previous studies. For example, health related and social stressors at baseline negatively influenced quality of life (as measured by depressive symptomology and engagement in social activities) four years later (Kahana, Kelley-Moore and Kahana Reference Kahana, Kelley-Moore and Kahana2012). Kahana, Kelley-Moore and Kahana (Reference Kahana, Kelley-Moore and Kahana2012) also examined the impact of internal and external resources to adapt proactively to stressors and confirmed the mediating role of proactive adaptation. For the men in our study, low strain predicted ageing well. While we did not look at the role of internal and external resources in proactive adaptation to stressors, our study confirmed that manageing stress is important for men's wellbeing in later life and provides support for providing stress management programmes for older men at risk.
Limitations of this study included that participants were followed until they either died or entered a residential aged-care facility and data were collected in rounds of two-year intervals; hence this study does not offer insights into ageing outcomes immediately before leaving community living or entering such a facility. Another limitation resulting from the study sample size was that only three trajectories were robustly identified; if the sample was larger then perhaps other trajectories, including the sought after ‘ageing-poorly to ageing-well’ trajectory, would be mapped and provide greater insights into the ageing experience of our heterogeneous sample of older adults.
This study supports the individual differences perspective of ageing. Our study has supported the view that older people may have quite different ageing trajectories as they grow older. Our study also demonstrates that, while there is commonality between older men and women, ageing well has gendered contributors and outcomes. We contend that public policy should not be based upon an erroneous homogenous group ‘one-size-fits-all’ approach. This study supports the view that individuals who get into or are in good shape before age 65 years have the best chance (close to one in three chance) of maintaining this good health and wellbeing in during the next decade. The common pattern of deterioration over the next decade is the trajectory associated with approximately 50 per cent of older people over 65 years. The minority, less than 23 per cent, are flagged as having poor health and wellbeing initially and have decreased probability of improving (better chance of improving for men but negligible chance for women).
The significance of these findings are that ageing well is influenced by modifiable lifestyle factors such as restful sleep for women and good nutrition, and social support and non-smoking for men. Another modifiable factor associated with ageing well for both genders is the number of medical conditions, which highlights the importance of managing optimally any health issues particularly as we get older in order to avoid unwanted sequela. This easily digestible information will be used by global public health promoters to assist people to divert from a trajectory of deteriorating health and wellbeing as they age.
Acknowledgements
This work was supported by the Victorian Health Promotion Foundation (grant number HSOP92) and the National Health and Medical Research Council (grant numbers 148625 and 219295). The financial sponsors had no role in the design, execution, analysis and interpretation of data, or writing of the study. JE conducted the analyses reported in this manuscript. All authors contributed to the interpretation of the analyses and writing of the manuscript. Collaborators in earlier rounds of the survey are listed in Browning and Kendig (Reference Browning and Kendig2010). There are no conflicts of interest declared by the authors. This study was approved by the Monash University Human Research Ethics Committee (reference number CF08/0151: 2008000047).


