


Introduction
The need to measure multi-dimensional aspects of health and living conditions is increasingly emphasised, especially for older people (here defined as those aged 66 or more years) (cf. Brayne et al. Reference Brayne, Matthews, McGee and Jagger2001; Meinow et al. Reference Meinow, Parker, Kåreholt and Thorslund2006). Their simultaneous exposure to different kinds of welfare problems, such as ill health, immobility, unhappiness, loneliness, anxieties and economic hardship, affects their overall wellbeing. The aim of the analysis reported in this paper was to gain a better understanding of the associations among different indicators of older people's welfare problems. The approach has been to address a series of propositions that follow from the properties of wellbeing indicators.
The first is that the various commonly used global measures of general wellbeing are meaningful only if they measure the same underlying phenomenon. To establish whether this is so, the associations among a wide range of indicators of physical, psychosocial and economical wellbeing were tested. The second proposition is that when various indicators are associated, it does not mean that they measure only one latent dimension, for it may be that one indicator functions as a partial measure of several different phenomena, which confuses the interpretation of the results. The analysis accordingly examined whether single indicators are associated with more than one phenomenon. The third proposition is that the prevalence of welfare problems differs substantially by age group and between men and women, making it important to analyse if and to what degree the associations among them vary for different groups of older people. Finally, given that indicators measure not one but several latent factors, it is important to understand if and how the different dimensions apply in various socio-demographic and socio-economic circumstances. The paper opens with a discussion of previous research and other introductory matters, and the later sections present the data and methods, the empirical analysis and finally the conclusions.
Previous research and theoretical considerations
There is a growing body of research on the coincidence of different kinds of welfare problems (Bask Reference Bask2005; Bradshaw and Finch Reference Bradshaw and Finch2003; Erikson and Tåhlin Reference Erikson and Tåhlin1987; Halleröd Reference Halleröd1991; Halleröd and Heikkilä Reference Halleröd, Heikkilä, Kautto, Heikkilä, Hvinden, Marklund and Ploug1999; Halleröd and Larsson Reference Halleröd and Larsson2008; Tham Reference Tham, Fritzell and Lundberg1994). One basic insight from these studies is that welfare problems tend to cluster, i.e. many people who suffer from health problems are also exposed to economic hardship, labour-market marginalisation and psychosocial disorders such as worries and anxiety. Recent longitudinal studies have also shown that welfare problems tend to accumulate over time and to amplify inequalities (Halleröd Reference Halleröd1999; Halleröd and Bask Reference Halleröd and Larsson2008). In the general population, and more especially among older people, there are large differences in the accumulation of welfare problems, which indicates a need to measure multi-dimensional aspects of health and living conditions (Brayne et al. Reference Brayne, Matthews, McGee and Jagger2001; Meinow et al. Reference Meinow, Parker, Kåreholt and Thorslund2006).
As people get older, they are progressively more exposed to a multitude of diverse welfare problems (Brayne et al. Reference Brayne, Matthews, McGee and Jagger2001; Lunney, Lynn and Hogan Reference Lunney, Lynn and Hogan2002; Romoren and Blekeseaune Reference Romoren and Blekeseaune2003; Vogel and Häll Reference Vogel and Häll2006). We know that, in general, greater age brings deterioration in several aspects of people's living conditions, but that many older people sustain positive evaluations of their quality of life, i.e. the objective and subjective ratings do not change in concert (Bowling and Gabriel Reference Bowling and Gabriel2004; Russell Reference Russell2007). Hence, depending on what aspects of overall living conditions are examined, different results are obtained. This is not necessarily a problem, provided that we analyse distinct aspects of people's living conditions. The research literature on health, functioning, living conditions, wellbeing and quality of life in old age has covered many inter-related empirical indicators. This applies particularly to research on the quality of life, which is widely conceived as a global construct covering multiple and overlapping aspects of life, such as economic conditions, health and social integration. It is also often assumed that the way in which people experience quality of life varies by the cultural setting and between men and women, and that it changes over time in society and over the life course (Russell Reference Russell2007; Seitsamo, Tuomi and Martikainen Reference Seitsamo, Tuomi and Martikainen2007).
Given the described variations in health and wellbeing, it is important to discover to what degree different indicators are associated with different aspects of people's living conditions. Put another way, we need to know what is being measured, for it is not always abundantly clear. For example, subjective, self-rated health measures are based on responses to simple questions about how people judge their current health. Subjective indicators are commonly promoted as indicators of health status on the grounds that there is evidence that they are reliable indicators of both morbidity and mortality (Brayne et al. Reference Brayne, Matthews, McGee and Jagger2001; Stålbrand et al. Reference Stålbrand, Svensson, Elmstahl, Horstmann, Hagberg, Dehlin and Samuelsson2007; Åberg Yngwe Reference Åberg Yngwe2005). Self-rated health has also been used to estimate the impact that specific diseases have on people's quality of life (Yabroff et al. Reference Yabroff, McNeel, Waldron, Davis, Brown, Clauser and Lawrence2007), i.e. instead of using self-rated health as a predictor of health, it is used to evaluate the effects of specific disorders, but in these instances what is being measured? Self-rated health assessments reflect individuals' understanding of their health conditions, which means that they provide reliable information about actual health status (Idler et al. Reference Idler, Leventhal, McLaughlin and Leventhal2004, Idler and Benyamini Reference Idler and Benyamini1997). At the same time, however, subjective self-rated health measures generally account for only five to 30 per cent of the variance in objective health measures (Pinquart Reference Pinquart2001), so although subjective self-rated health measures say a lot about actual health status, they may also capture other dimensions of people's lives, such as expectations and preferences (Borg and Kristensen Reference Borg and Kristensen2000; Åberg Yngwe Reference Åberg Yngwe2005), and to some degree personality (Moor et al. Reference Moor, Zimprich, Schmitt and Kliegel2006; Schneider et al. Reference Schneider, Driesch, Kruse, Wachter, Nehen and Heuft2004). Responses to subjective health questions are therefore most likely to refer to several aspects of people's living situation (Idler and Benyamini Reference Idler and Benyamini1997), which could be one reason why they are so useful, but it also raises concerns about what they actually measure. It is reasonable to assume that most indicators used by social scientists to map people's living conditions in fact measure more than one phenomenon, which means that their meaning has a degree of ambiguity and might prevent clear interpretation.
Socio-demographic and socio-economic differences
It is commonly reported that women are more exposed to ill health and various kinds of welfare problems than men. Women report higher rates of negative affect and depression and poorer subjective health (Tesch-Römer, Motel-Klingebiel and Tomaski Reference Tesch-Römer, Motel-Klingebiel and Tomaski2008; Vogel and Häll Reference Vogel and Häll2006). Fryback et al. (Reference Fryback, Dunham, Palta, Hanmer, Buechner, Cherepanov, Herrington, Hays, Kaplan, Ganiats, Feeny and Kind2007) showed systematic differences between older men and women when comparing six different health-related quality-of-life indices. Women also score worse than men on physical functioning, whether the assessment is self-rated or objective (Parker et al. Reference Parker, Thorslund, Lundberg and Kåreholt1996). It has also been found that when measured using self-reported diagnoses, older women suffer from a higher risk of complex health problems than men (Meinow et al. Reference Meinow, Parker, Kåreholt and Thorslund2006).
There is also a well-known socio-economic gradient for health outcomes in both the total population and among older people (cf. Huisman, Kunst and Mackenbach Reference Huisman, Kunst and Mackenbach2003; Marmot Reference Marmot2004; Matthews, Jagger and Hancock Reference Matthews, Jagger and Hancock2006), and it is known that different health indicators relate to different socio-economic disparities. Relationships between socio-economic status (SES) and functional measures (instrumental activities of daily living (IADL), mobility and performance tests) have been shown by several studies. Thorslund and Lundberg (Reference Thorslund and Lundberg1994), for example, found among people aged 77 or more years significant relationships between social class and the prevalence of aches and pains, circulatory problems and peak-flow performance, yet at the same time the relationship between self-rated health and social class was not significant (see alsoParker, Thorslund and Lundberg Reference Parker, Thorslund and Lundberg1994). Moreover, quality-of-life measures, such as the ‘Control, Autonomy, Self-realisation and Pleasure Measure’ CASP-19, tend to vary with SES in a predictable manner; that is, blue-collar workers report lower quality of life than white-collar and managerial workers (Blane, Netuveli and Bartley Reference Blane, Netuveli and Bartley2007). Additionally, Knesebeck et al. (Reference Knesebeck, Wahrendorf, Hyde and Siegrist2007) found a relationship between SES indicators and quality of life among older people in 10 European countries. The inconsistent evidence about the relationship between standard indicators of demographic and socio-economic circumstances and different health indicators calls for a greater awareness of what is being measured. It may be that the observed gender and SES differences are related to different dimensions of the observed indicators, while other dimensions are unaffected. To determine whether this is the case, the relationship between socio-demographic and socio-economic indicators and different dimensions of people's living conditions needs to be analysed.
Data, methods and measures
The analyses use data from the Swedish Panel Survey of Ageing and the Elderly (PSAE). The survey was conducted in 2002 and 2003 and was a variant of the annual Swedish Survey of Living Conditions (ULF) (Vogel and Häll Reference Vogel and Häll2006). What makes the PSAE special is the inclusion of a broad range of questions relevant to old age. PSAE used a population-based sample with over-sampling of those aged 65 or more years. The working sample for the present analysis was of people aged 66–99 years, and in this age range the response rate was 73 per cent. The data were collected mainly through face-to-face interviews, but 24 per cent of the respondents were interviewed over the telephone. Indirect or proxy interviews were used in eight per cent of the cases. As several of the indicators central to the present study were not included in the indirect interviews, all these cases were excluded from the analysis sample. Because indirect interviews were used predominantly for people suffering from severe physical or cognitive impairments, the incidence of such problems is lower than in the entire sample. The analysis sample had 3,053 cases.
The wide range of questions in the PSAE allows simultaneous analysis of a large number of indicators. Table 1 specifies the 17 examined indicators of welfare problems and their operational forms, while Table 2 displays their prevalence by age group and gender. The indicators were tentatively grouped into three categories to guide the analysis but not to determine its outcome. The first group are indicators that refer more or less directly to physical impairments; the second group are psychosocial indicators; and the third group are three related economic or material standard-of-living indicators. The indicators have a great deal in common with those used in standard health-related quality-of-life indexes, such as the Short Form (SF-36) health survey, the EuroQol Group's EQ-5D measure, the Nottingham Health Profile (NHP) and the Dartmouth Primary Care Co-operative Information Project Health Chart (Coons et al. Reference Coons, Rao, Keininger and Hays2000), but there are also indicators of the person's material standard of living. Adding these indicators enables a better understanding of the degree to which indicators of anxiety, unhappiness and worry are part of a more general pattern that includes non-health-related aspects such as economic worries and difficulties.
Table 1. The measures of welfare and wellbeing

Table 2. Prevalence of welfare problems among people aged 66 or more years, Swedes 2002–03

Significance levels: * p⩽0.05; ** p⩽0.01; *** p⩽0.001.
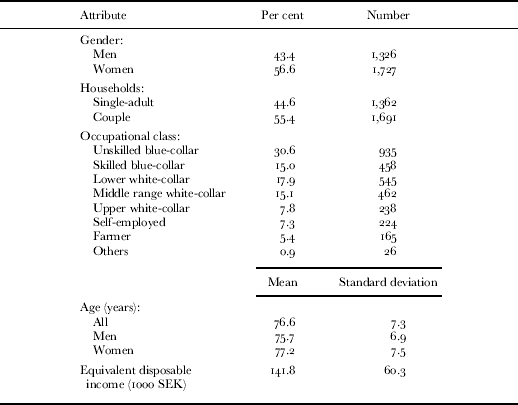
The profile of the sample on the socio-demographic and socio-economic variables used as predictors in the final steps of the analysis is shown in Table 3. The measures of sex and age are straightforward. The household variable distinguishes between single-adult households and couples (just seven of the couple households also included adult children). Occupational class was based on the Swedish Socio-Economic Code (SEI), a classification system that closely resembles the well-known Erikson-Goldthorpe-Portocarero (EGP) scheme (Erikson and Goldthorpe Reference Erikson and Goldthorpe1993). Income data were gathered from a register, and the household's equivalent disposable income was derived from the household's total post-tax and transfer income. The Statistics Sweden equivalence scale was used to adjust for differences in household size. Occupational class and income measured the individual's position in the economic hierarchy, and because income in old age closely reflects life-long earning capability, both can also be seen as indicators of the accumulated effect of that position. Thus, including both income and occupational class in the same model is likely to greatly decrease the impact of the latter. The reason for including both measures is that occupational class may capture SES attributes that are in part independent of income, such as working conditions, working environment and class-specific behaviour (Bihagen Reference Bihagen2000; Bourdieu Reference Bourdieu1984).
Table 3. Socio-demographic and socio-economic profile of the sample
Note: SEK: Swedish krona.
Methods
Indices derived from a set of indicators are often perceived as a device for bringing together disparate information related to a common factor and avoiding the vagaries of a single measure. Using the additive procedure, however, also accumulates ambiguity or, more correctly, the ambiguities. A latent variable approach largely avoids this problem, and in the present paper confirmative factor analysis (CFA) is used to disentangle the relationships among the 17 indicators. CFA is one of the family of structural equation models (SEMs) that provide a powerful tool for testing relationships among a set of manifest indicators. CFA estimates the relationships between an unobserved latent variable and a set of manifest observed indicators. The latent variable comprises only the covariance among a set of manifest indicators, and in that sense is error free (Hoyle Reference Hoyle1995). Because a latent variable rarely explains all the variance in the model, however, each of the manifest variables also has an error term, the residual variance.
Statistical tests are often based on the assumption that error terms are randomly distributed and uncorrelated with each other, but this is not necessarily the case. For example, an older person may be anxious and unhappy because they have severe physical health problems, so one can expect strong covariance between indicators of physical impairments and the psychosocial situation, i.e. the different indicators are related to a single latent variable. It can also be the case, of course, that some older people not affected by physical problems are worried, unhappy and lonely, and that some older people who suffer from physical impairments are unworried and content with their lives. We should not therefore expect the residual variance to be randomly distributed, but should instead seek ways of uncovering the underlying latent structure. This will give a better understanding of what the indicators are actually measuring and, more importantly, of older people's living situations. The CFA approach enables us to do just this because it allows us to specify models that assume correlated error terms. Because all 17 indicators are dichotomies, the associations between the latent, unobserved factors and the manifest variables are based on weighted least-squares solutions with robust standard errors and mean- and variance-adjusted chi-squared (WLSMV) estimates (Beauducel and Herzberg Reference Beauducel and Herzberg2006; Flora and Curran Reference Flora and Curran2004). Modelling of incomplete data is used to handle the very few cases with missing observations on one or more variables.Footnote 1 This approach provides unbiased estimates of missing data under the assumption that the missing values occurred randomly (Gustafsson and Stahl Reference Gustafsson and Stahl2004).
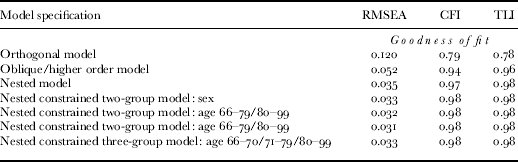
To find the best representation of the data, the models were compared using three measures of model fit. The first is the frequently used root-mean-square-error approximation (RMSEA). RMSEA is an absolute close-fit index based on the residual correlation matrix, i.e. the difference between the observed and implied correlations. The measure adjusts for sample size and model complexity. Various suggestions have been made about the interpretation of the RMSEA, but the general view is that a good fit is signified by a RMSEA of 0.05 or less, and that a value above 0.10 indicates unacceptably poor fit. The RMSEA can be problematic when the observed correlations are weak. In these cases, the residual correlation matrix of relatively weak correlations will lead to an impressively low RMSEA. This problem is avoided by incremental close-fit indices such as the ‘Comparative Fit Index’ (CFI) and the ‘Tucker Lewis Index’ (TLI) (Gignac Reference Gignac2007), so these two measures were used as complements to RMSEA. CFI and TLI values above 0.95 indicate a good fit, while a value below 0.90 represents inadequate fit (Wu and Yao Reference Wu and Yao2007).Footnote 2
Analyses
As seen in Table 2, depending on what kind of welfare problem is observed, there were large differences in prevalence. Fewer than seven per cent of respondents reported feelings of inferiority, but almost two-fifths said that they had been tired during the past two weeks. Because the occurrence of welfare problems supposedly increases with age, the sample was divided arbitrarily into two age groups: the ‘younger old’ (66–79 years) and the ‘older old’ (80+ years). For 15 of the 17 indicators, the prevalence was significantly higher for the older age group, and only for two economic indicators was the age difference insignificant. Turning to the gender differences, for 16 of the 17 indicators, the prevalence was significantly higher for women and most of the differences were large. The only indicator that was as prevalent among women as men was ‘nothing meaningful to do’. The difference between men and women is partly accounted for by the difference in their mean ages (see Table 3), but except for ADL all gender differences were significant after controlling for age.
The central issue was to examine if and how different welfare problems related to each other and whether the pattern was similar or different at different ages and between men and women. At the first step, a matrix of Kendal tau-a correlation estimates was generated and the bivariate associations among the 17 indicators inspected.Footnote 3 The matrix showed that on average IADL and the inability to take a five-minute walk had the strongest associations with the other indicators. These two indicators were followed by subjective health and various psychosocial indicators. The weakest associations were found for the three economic indicators. At the second step, the matrix was entered into an exploratory factor analysis. This analysis (not shown here) generated three discernable factors related to respectively: the physical indicators, the psychosocial indicators, and the economic indicators. Hence, the analysis supported the initial tentative three-way division of the manifest indicators.
Confirmative factor analysis: comparing the models
To examine what kind of latent pattern best represented the data, a series of CFA models were fitted, starting with an orthogonal model, followed by a higher-order model and then a nested model (Carlstedt and Gustafsson Reference Carlstedt and Gustafsson2005; Gignac Reference Gignac2007; Gustafsson and Balke Reference Gustafsson and Balke1993; Wu and Yao Reference Wu and Yao2007). The orthogonal model makes the basic assumption, as verified by the exploratory factor model, that the data can be represented by three latent variables measuring the psychosocial (Psych), physical (Phys) and economic (Eco) dimensions. Because the model has orthogonal dimensions, it assumes that the three latent variables are uncorrelated, but as can be seen in Table 4, this did not fit the data particularly well: the RMSEA was clearly too high and CFI and TLI were much too low.
Table 4. The fit of the confirmatory factor analysis models
Notes: RMSEA: root-mean-square-error-approximation. CFI: Comparative Fit Index. TLI: Tucker Lewis Index. For further details, see text.
At the second step, the orthogonal model was replaced by a higher-order model, basically an oblique model that identified three inter-correlated latent variables. The only difference is that the higher-order model used the covariance between the latent factors to identify a higher-order latent variable, Glob, as shown in Figure 1. The higher order model clearly fitted the data better, with RMSEA close to 0.05, a CFI score of 0.94 and a TLI of 0.96 (see Table 4). The main reason for the improvement of the model was that the latent variables were permitted to correlate with each other. The higher-order model also confirmed the existence of a global factor that indirectly related to all 17 manifest indicators. The favourable performance of the model was also partly dependent on the fact that frequent and severe health problems and poor subjective health were related to both the Psych and Phys factors. The higher-order factor (Glob) correlated strongly with all three latent variables, but particularly with the Psych factor. In fact, Glob was almost identical with Psych (standard parameter=0.94), which supports the conclusion that the manifest variables used to identify Psych also identified the global factor.
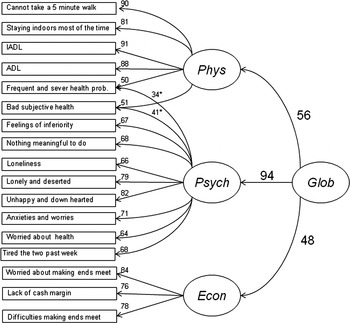
Figure 1. The structure of the higher-order confirmatory factor analysis model of older people's welfare. Notes: The figures are standardised weighted least-squares with robust standard errors and mean- and variance-adjusted chi-squared (WLSMV) estimates multiplied by 100: for more details see text. * Coefficient refers to Psych R.
The higher-order model indicated that older people who report psychosocial problems also suffer from a raised risk of having physical and economic problems, and vice versa. The degree to which people were exposed to multidimensional welfare problems was measured by the higher-order Glob factor. How should we interpret Phys, Psych and Eco? Among the people who scored high on Phys, some also scored high on Psych; that is, they suffered from both physical and psychosocial problems, but this was not a universal pattern. The correlation between Phys and Psych was approximately 0.53 (R 2=0.28), which means that some people suffered from physical impairments without experiencing psychosocial problems. Analysis that enables us to keep these two patterns apart will certainly facilitate a better understanding of older people's circumstances. It would likewise be desirable to separate those who suffered from psychosocial problems but did not have any physical difficulties from those who suffered simultaneously from physical and psychosocial problems. A nested CFA model enables exactly that.
In the nested model (see Figure 2), the global variable Glob was directly related to all the manifest variables, i.e. it captured the common variation in all 17 manifest indicators, again confirming that they all relate to a single global factor. The nested model was based on the assumption that the manifest indicators' residual variance was correlated and could be used to estimate the so-called residual latent variables. In this case, three residual latent variables were estimated: Phys R, Psych R and Eco R. The interpretation of the nested model is fairly straightforward. The degree to which people were simultaneously exposed to physical, psychosocial and economic problems is measured by Glob. People who suffered from physical impairment but not from psychosocial or economic problems scored on Phys R. Psych R measured to what degree people who did not suffer from physical impairments and economic troubles were nevertheless worried, anxious or lonely. People who had economic problems but otherwise did not report welfare problems scored on Eco R. Hence, the latent variables generated by the nested model enabled analyses of a set of specific and interpretable dimensions of older people's wellbeing. The nested model fitted the data better than the previous models (Table 4), and did so without the assumption of relationships between the four latent variables. This underlines the evidence that the 17 manifest variables measured not one but four different phenomena.

Figure 2. The structure of the nested confirmatory factor analysis model of older people's welfare. Notes: The figures are standardised weighted least-squares with robust standard errors and mean- and variance-adjusted chi-squared (WLSMV) estimates multiplied by 100: for more details see text.
Inspecting the model more closely, it is interesting to note that subjective health and the measure of frequent and severe health problems were strongly linked to Glob (parameters 0.90 and 0.82), but unrelated to all three residual factors. Hence, these two variables were essentially measures of global wellbeing, and showed that people who reported poor subjective health and/or severe health problems also suffered from various other welfare problems. This result adds to our understanding of the validity of subjective health questions as an often-used overall measure of health status. The fact that subjective health was unrelated to Psych R shows that the measure was actually measuring health status. Worries, anxieties and loneliness, if not combined with more specific health problems, were not related to the subjective health question. At the same time, it is also clear that the subjective health questions missed physical impairments if such impairments were unrelated to psychosocial factors and did not cause severe and frequent symptoms. The manifest variables that had the weakest associations with the Glob factor were the economic indicators, especially the measure of economic worries.
The residual factor Phys R showed that some older people suffered from physical restrictions without reporting any other problems. Individuals who scored high on this factor did not consider themselves as having difficult health problems, poor subjective health or psychosocial problems, despite the fact that they suffered from rather severe physical impairments. The higher-order model indicated that the global measure was almost identical to the Psych factor, but the nested model showed that this conclusion was wrong. What the nested model shows is that there was an independent, residual psychosocial dimension, Psych R, and that it included economic worries. Thus, Psych R showed that some people were worried and felt socially marginalised without having any of the other problems identified by the 17 indicators; that is, they did not tend to report poor subjective health, severe health problems, physical difficulties or economic problems, but did experience anxiety, loneliness or worries. Finally the residual factor Eco R measured the occurrence of economic problems. It is important to keep in mind that Eco R measured economic problems that occurred independently of the other welfare problems included in the model.
From these analyses, it was concluded that the nested model was the best choice for further analysis, both because it out-performed the other models in terms of model fit and because it facilitated the substantive interpretation of the results. The differences between the latent factors identified by the nested model are discussed in more detail later. The next part of the analysis takes a closer look at gender and age differences.
Gender and age differences
Table 2 showed that women were more likely than men to suffer from welfare problems and that there was a higher prevalence of welfare problems among the ‘oldest old’ (aged 80 or more years). The question is whether these differences also mean that the relationships between the manifest variables varied between men and women and at different ages. Starting with men and women, a constrained two-group model was fitted. This model was estimated from two sub-samples, one for men and one for women. Because the model was constrained, it was assumed that the relationships among the various indicators are identical in both groups, i.e. they take the form displayed in Figure 2 for both men and women. If the observed differences between the two groups are large, the constrained model will fit the data poorly. In that case the model has to be relaxed, allowing for differences between groups. This would also mean that we have to conclude that women and men behave differently and therefore need to fit models that, at least partially, are specific to each sex. There was, however, no need to relax the constrained two group model for it fitted the data well, and indeed the RMSEA indicated that the fit was better than for the single group model (see Table 4), because the degrees of freedom dramatically increased.
The same basic procedure was followed to examine age-group differences. First, a constrained two-group model was estimated to test for differences between the younger old (66–79 years) and the oldest old (80–99 years). Because the dividing age is arbitrary, two additional models were tested. At the second step, the dividing age was changed to 75 years, and at the third step, three groups were defined (66–69, 70–79 and 80–99 years). The results from this exercise showed that the constrained models fitted the data very well, which demonstrated that the basic relationships among distinguishable welfare problems are independent of age. Thus, even though there were large differences in prevalence, the pattern was similar among men and women and at different ages. It was therefore appropriate to proceed using the results from the parsimonious nested single-group model.
Different dimensions, different causes
The factor scores from the nested single-group model gave four measures that captured different dimensions of people's living conditions: Glob, Psych R, Phys R and Eco R. In the final step of the analysis, the socio-demographic and SES indicators were used to estimate the scores on these four latent factors. To facilitate interpretation of the regression results, the latent factors were rescaled to z-scores, viz. the estimated differences were measured as standard deviations. The first model estimated Glob scores. Table 5 shows that on average women scored almost 0.19 standard deviations higher than men on Glob, and there were clear age and single-adult household effects. There was also an occupational class gradient, with the miscellaneous ‘other’ category having the highest score, followed by unskilled blue-collar workers (the reference category). Only the middling occupations of white-collar workers scored significantly lower than the reference group. This does not mean that the occupational class effect was weak, however, for it was mediated by income (the direct impact of class increased substantially when income was omitted from the model). Not surprisingly, the analysis showed that the higher the income, the lower the Glob score. The effect of income was also curvilinear, showing a decreasing marginal impact. The model explained 17 per cent of the variance in Glob, and by looking at the beta coefficients (not shown), it is clear that age and the income variables were the principal contributors (Halleröd and Stern Reference Halleröd and Stern1991).
Table 5. Predictors of latent factor scores: ordinary least-squares regression estimates

Notes: Age2 is capturing the curvilinear relationship between age and Phys R and is equal to (x i−![]() )2, where x i is the age of the ith individual and
)2, where x i is the age of the ith individual and ![]() is the mean age in the sample. Equivalent disposable income2, capturing the curvilinear relationships between income and the dependent variables Glob and Eco R, is calculated in the same way as Age2, x i being the income of the ith individual and
is the mean age in the sample. Equivalent disposable income2, capturing the curvilinear relationships between income and the dependent variables Glob and Eco R, is calculated in the same way as Age2, x i being the income of the ith individual and ![]() is the mean income in the sample.
is the mean income in the sample.
Significance levels: * p⩽0.05, ** p⩽0.01, *** p⩽0.001.
In the second model, the outcome variable was Phys R. Apart from the significant effects from lower white-collar workers and the comparably weak effect of sex, it was mainly the age variable that showed any relationship, but the relationship was very strong and accounted for almost all the explained variance. The curvilinear form of the relationship was significant, which captured the increasing marginal effect of increasing age on the Phys R score. This represented the decline of physical abilities with greater age and showed that, among some older people, the process occurred without a corresponding decline in psychosocial wellbeing or more negative subjective evaluations of health. The third model estimated the score on the residual factor Psych R. This found a large difference between men and women and that people living in single-adult households had notably high scores. There was a weak negative age effect. This is not to say that the oldest old were less exposed to anxieties or loneliness compared to the younger respondents, but rather that, first and foremost, young old people who experienced these problems were not exposed to the same extent as the older age group to other welfare problems. Neither income nor class had any significant impact on Psych R. It captured a dimension that, it seems, was not related to SES.
The fourth and final model had the residual factor Eco R as the outcome variable. It turned out to be the only factor without a significant difference between men and women. There was a negative age effect, i.e. the oldest old were less concerned about economic problems. The commonly observed connection between living in single-adult households and having economic problems was confirmed. There were almost no significant associations between Eco R and class position, which again is explained because income was included in the model. The income effect was negative and curvilinear, showing a decreasing marginal effect.
Conclusions
The implications of the accumulation and coexistence of welfare problems, i.e. that one individual simultaneously suffers from several malaises, such as ill health, anxieties, social isolation or economic problems, are receiving increasing attention in the research community and among policy makers. It has also been emphasised that a multi-dimensional perspective is required when studying the welfare of older people. This paper has reported the findings of an analysis of the associations among 17 indicators of living conditions among people aged 66 or more years in Sweden. The indicators covered physical functionality and health, a set of psychosocial indicators measuring worries, anxieties and social integration, and a set on economic conditions or the material standard of living. Confirmative factor analyses (CFA) were used to discern the co-variation of these welfare problems. The model that best represented the data was nested and generated one global factor (Glob) that was associated with all 17 indicators and measured general wellbeing, and it generated three residual factors that measured the unique occurrence of physical (Phys R), psychosocial (Psych R), and economic (Eco R) problems.
The findings have several important implications. First, the global factor shows that each of the indicators tapped into a general dimension of wellbeing. If, for example, an older person stated that she/he felt unhappy and downhearted, she/he was also highly likely to have some kind of health impairment, feel lonely and be in a difficult economic situation. The global factor was most strongly related to subjective health and the occurrence of frequent and severe health problems, which shows that older people's living conditions were strongly related to their health situation. The existence of a global factor demonstrates that welfare problems related to different domains tend to accumulate into a single dimension, but one should note well that this is not always the case. The existence of the residual factor Phys R showed that some people suffered only from physical problems. Among this group were people who, despite having physical limitations, reported neither psychosocial nor economic problems nor even, more remarkably, poor health or severe or frequent health symptoms. The residual factor Psych R revealed that some older people experienced anxiety, worries or loneliness without suffering from physical and economic limitations or any severe health problems. Finally, the residual factor Eco R revealed that for some people economic problems were independent of other types of welfare problems. These results show that single indicators can tap into more than one underlying dimension. In fact, all 15 of the 17 indicators related to at least two latent factors, which is important to keep in mind when analysing single indicators or additive indices.
One advantage of the CFA method is that it produces factors that are empirically valid measures of distinctive aspects of people's wellbeing. In the analysis, a set of socio-demographic and socio-economic indicators were used as predictors of both the global factor and the three residual factors. The findings provide support for the proposition that different latent factors can be derived from a common set of manifest indicators and that they measure different social phenomena. When the distribution of the global factor scores in the population was examined, familiar patterns emerged. Women had higher scores than men, and people living in single-adult households, blue-collar workers and low-income earners also scored highly. There was also a rather strong age effect, indicating that the multi-dimensional deterioration of living conditions is first and foremost a problem for the oldest old. The residual physical ability factor turned out to be almost entirely related to age, while the psychosocial factor was mainly related to the household situation and gender. Both these factors were unrelated to SES. Scores on the residual factor measuring economic difficulties were primarily predicted by SES and household composition.
The associations with the frequently used subjective health measure are of particular interest. Scores on this measure were strongly related to the global factor, but unrelated to the three residual factors. Thus, asking someone if their health is ‘very bad’, ‘very good’ or ‘in between’ comes as close as we might get to capturing a global factor using a single indicator. This finding also supports the idea that people draw on their accumulated life experience when answering self-report health questions (cf. Idler et al. Reference Idler, Leventhal, McLaughlin and Leventhal2004; Idler and Benyamini Reference Idler and Benyamini1997), and also explains why the indicator functions as a reliable predictor of several types of health outcomes. The prevalence of welfare problems differs substantially between men and women and by age. To determine whether the relationship between welfare problems differs for these groups, a series of multi-group models was fitted. These showed that regardless of large differences in prevalence, the basic relationship between welfare problems appeared to be the same among men and women and at different ages.
The reported analyses are by no means the final step and must be validated using other datasets and indicators and in other countries. We should also develop the analysis so as to increase our understanding of the causes and consequences of high scores on the derived factors. It has been shown here that different welfare problems are related to each other at a moment in time, but it is at least as important to sort out how welfare problems inter-relate over time; that is, to map the causal relationships between different welfare problems. For example, are economic difficulties related to the global factor because people get ill and worried when they have no money, or is it the case that poor health has prevented them from earning money in the first place? Are people ill because they are worried, or are they worried because they are ill? The increased availability of longitudinal data will enable such analyses. The present study contributes to our knowledge by showing that single indicators often measure more than one thing and can thus be used to derive interpretable latent factors from a set of manifest variables, a strategy that enables more elaborate analyses and more definite conclusions about older people's living situations.
Acknowledgement
The research for this paper and its writing were carried out when the author was attached to the Department of Sociology at Umeå University, before his move to Gothenburg University early in 2009. I thank my former colleagues at Umeå for their assistance and support.


