


Introduction
Health expectancy, an extension of the concept of life expectancy (LE), is a summary measure of population health that takes into account both mortality and morbidity of a population, and partitions the expected years of life at a particular age into healthy and unhealthy years (Yong and Saito Reference Yong and Saito2009). In the early 1970s, Sullivan (Reference Sullivan1971) proposed a simple method for estimating LE as a function of disability or health states (Robine and Ritchie Reference Robine and Ritchie1991). LE can be measured by a variety of different health dimensions, and if self-rated health (SRH) prevalence is used in the computation, the result is often called healthy life expectancy (HLE). As an intuitive and meaningful summary measure combining length and quality of life, health expectancy has become a standard in the world for measuring population health (Stiefel, Perla and Zell Reference Stiefel, Perla and Zell2010). Moreover, health expectancy data are invaluable for predicting future needs, evaluating health programmes, identifying trends and inequalities, and planning health and social services, long-term care and pensions. To date, despite a great deal of health expectancy studies in developed countries, there are few such studies in developing countries, especially in Bangladesh. Therefore, measuring population health through HLE is urgently needed.
This paper proposes a simple framework (Figure 1) of the relationship between LE and HLE by incorporating SRH prevalence and the factors contributing directly to SRH and indirectly to HLE. For analytic purposes, we first used SRH prevalence from survey data and mortality information from life tables to estimate HLE, a population measure. SRH prevalence is an individual's evaluation of their health and can reflect aspects of health not captured in other single health measures. Though SRH, or an individual's evaluation of health, is influenced by several socio-demographic and contextual factors (French et al. Reference French, Browning, Kendig, Luszcz, Saito, Sargent-Cox and Anstey2012), specifically explained by Jylhä (Reference Jylhä2009), it is a strong and independent predictor of subsequent illness and both all-cause and specific mortality (Benjamins et al. Reference Benjamins, Hummer, Eberstein and Nam2004; DeSalvo et al. Reference DeSalvo, Bloser, Reynolds, He and Muntner2006; Idler and Benyamini Reference Idler and Benyamini1997; Lyyra et al. Reference Lyyra, Heikkinen, Lyyra and Jylhä2006; Miller and Wolinsky Reference Miller and Wolinsky2007; World Health Organization 1996). We then used multivariate analysis to examine the correlates of SRH. By identifying the correlates of SRH, which is used to compute HLE, we hope to contribute to the improvement of individuals’ SRH and, in turn, the improvement of their HLE.
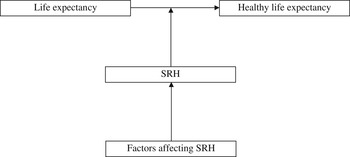
Figure 1. Indirect correlates of healthy life expectancy. Note: SRH: self-rated health.
Though Bangladesh currently has the third largest number of poor older people after India and China (HelpAge International 2006), population research in Bangladesh pays relatively little attention to ageing. Older people (60 years old and over) in Bangladesh will constitute about 10 per cent of the total population by 2025–2030, effectively making Bangladesh an ageing society with its concomitant challenges. Indeed, older people will grow in number from 7 million to 65 million this century, and their numbers will place many and varied demands on the health system (Streatfield and Karar Reference Streatfield and Karar2008). This ‘ageing’ shift has major implications for population health as more than half of all deaths occur in this age range. Scarcity of resources, existing poverty, insufficient health services and the absence of a social security system in Bangladesh, moreover, will compound the problem of ageing. Therefore, this paper seeks to investigate the current health status and quality of life of older people using HLE estimation, as well as examine the correlates of SRH in Rajshahi district of Bangladesh. This could contribute to improving the health status as well as HLE of older people and thereby help create a healthy aged society in Bangladesh.
Materials and methods
Sample
Data came from a promotional research project, ‘Socio-demographic Status of the Aged Population and Elderly Abuse: A Study on Rural–Urban Differentials in Rajshahi District, Bangladesh’, of the Social Science Research Council, Planning Division, Ministry of Planning, Government of Bangladesh. The objectives, sampling design and methodologies are described elsewhere in detail (Tareque Reference Tareque2009). In brief, the project was a socio-economic as well as demographic study of the older population (60 years old and over) of Rajshahi district, Bangladesh. Rajshahi is situated in the northern part of Bangladesh and has a total area of 2,407.01 square kilometres. It is one of the least developed divisional districts in Bangladesh. It has a population of 2.6 million with a high population density of 1,070 persons per square kilometre. Individuals aged 60 years and above constitute 7.2 per cent of the total population in Rajshahi district of Bangladesh (Bangladesh Bureau of Statistics 2011).
Bangladesh is divided administratively (from large to small) into divisions, districts (zilas) and sub-districts (upazilas and thanas). In rural areas, each thana is divided into several union councils, and each union council consists of multiple mouzas. Mouza is a type of administrative unit corresponding to a specific land area within which there may be one or more settlements. Today a mouza has become mostly synonymous with a gram or village. In urban areas, thanas are divided into several wards, and each ward is further divided into multiple mahallas. In this study, two mouzas of Yusufpur union council (namely Baduria and Sahapur) from rural areas and ward number 5 from an urban area were selected as study areas with a probability proportion to size (in terms of households) sampling technique. All households in the selected mouzas and ward were enumerated, and all older people residing in the households were interviewed during April 2009. The total sample size was 896 individuals, out of which 477 came from rural areas and the rest from urban areas.
To reach the goals of the project, a questionnaire was prepared and pre-tested by a pilot survey. Then, necessary corrections were made to the final version of the questionnaire. Finally, field investigators went to the homes with eligible people and asked the questions, the answers to which were then recorded on the questionnaires. To reach a 100 per cent response rate, repeated visits were made. A structured interview schedule containing closed questions (except for questions related to income) was devised to collect information on the following: (a) identification of respondents, (b) details about family members, (c) health conditions, (d) daily activities, (e) economic activities, (f) living arrangements and conditions, (g) abuse, etc. For proper data collection and for the convenience of interviewees and field investigators, a Bengali version of the questionnaire was prepared. It was subsequently converted into English for data entry and analysis.
Measures
Outcome variable
Although SRH may be a better indicator of potential service use than of actual health conditions (Fillenbaum Reference Fillenbaum1984), it is the most informative, unique, valuable and widely used single measure of human health status (Jylhä Reference Jylhä2009). In spite of variation in the wording of the question, there is extensive evidence that SRH is a potent predictor of future survival/mortality and morbidity (Bailis, Segall and Chipperfield Reference Bailis, Segall and Chipperfield2003; Idler and Benyamini Reference Idler and Benyamini1997), functional decline and disability, and utilization of health care (Bailis, Segall and Chipperfield Reference Bailis, Segall and Chipperfield2003; Goldman, Glei and Chang Reference Goldman, Glei and Chang2004). Here, it is measured, based on a five-point Likert scale, with the question, ‘How would you describe your state of health these days? Would you say it is … (a) very good; (b) good; (c) fair; (d) poor; (e) very poor?’ This variable serves as the outcome variable, where a value of 1 was assigned if the response was very good, good or fair, and 0 was assigned otherwise.
Explanatory variables
Five age groups were used (60–64, 65–69, 70–74, 75–79, and 80 and above) for HLE calculations and chi-square tests. Two religious categories were used (Muslim and non-Muslim) with non-Muslim including Hindu, Buddhists, Christians and others. Three education categories were used (no education, one to five years as primary, and six years and above as secondary and above). Two marital status categories were used (married and others) with others including single individuals, widows or others. Living arrangements were measured based on responses to the question, ‘Whom do you live with?’ Five response categories were (a) alone; (b) spouse; (c) unmarried son/daughter; (d) married son/daughter; (e) others. To obtain two categories, those claiming to live alone were put in one category, while those who mentioned living with someone (options b–e) were merged into another category. Respondents’ monthly incomes as well as families’ monthly incomes were categorised into three groups (<3,000 Bangladeshi Taka (BDT), 3,000–5,999 BDT and ⩾6,000 BDT). In April 2009, one US dollar was approximately equal to 69 BDT. Sufficiency of income was assessed from the question, ‘Is your income sufficient?’, with response categories no or yes. Activities of daily living (ADL) and instrumental activities of daily living (IADL) were assessed from seven ADL and IADL items: the ability to perform (a) dressing, (b) eating, (c) bathing/using the toilet, (d) walking, (e) shopping, (f) household work and (g) handling money. We constructed a mixed measure of ability to perform daily activities, using 1 (can easily do all the activities) and 0 (have trouble with one or more activities). Physical limitations (squatting, lifting up objects weighing five kilograms, walking about one kilometre and climbing stairs of two to three steps) and impairments (paralysis, blindness and deafness) were combined into one measure, with 1 (no physical limitations) and 0 (one or more limitations). Exercise at least once a week in the six months prior to the survey was categorised into two groups with 0 if the respondent answered ‘no’ and 1 if he or she answered ‘yes’.
A negative association between SRH and physical and/or sexual abuse and emotional mistreatment has been found in some studies (Amstadter et al. Reference Amstadter, Begle, Cisler, Hernandez, Muzzy and Acierno2010; Bauldry et al. Reference Bauldry, Shanahan, Boardman, Miech and Macmillan2012; Parker Reference Parker2004). In this study, the question, ‘Have you ever been abused?’ was asked to older people to uncover the actual situation of elder abuse. The response ‘yes’ was considered as 0 and ‘no’ as 1. Respondents’ linking social capital was assessed by asking whether respondents were active members of any of six types of voluntary groups (elderly groups, professional groups, vocational groups, housewives’ groups, co-operative groups and/or voluntary groups). The rationale behind including this in the study is that those reporting to be active members are likely to be interacting with other members, thereby creating network ties (Gele and Harsløf Reference Gele and Harsløf2010) that help keep individuals healthy.
Computation of HLE
To compute HLE, we used the method devised by Sullivan (Reference Sullivan1971). This method partitions total LE into the LE in different health states. The prevalence rate of SRH was used for estimating HLE in the current study. As data on SRH prevalence came from the survey conducted in 2009, this method required the 2009 life table for the study area. Using United Nations projected population figures (United Nations Population Division 2008) for 2005 and 2010, we first estimated the 2008 and 2009 age-specific population figures for Bangladesh based on the exponential growth rate from 2005 and 2010. These estimates for Bangladesh were then proportioned for Rajshahi district using the 2001 Bangladesh Population Census data to produce 2008 and 2009 population estimates for the district by age. Preston and Bennett's (Reference Preston and Bennett1983) method was then applied to the age distribution to compute life tables for the study area in 2009. By combining the computed mortality information with age-specific SRH prevalence rates obtained from the survey, we computed HLE for our study population. For more details on computation of HLE using the Sullivan method, refer to Jagger et al. (Reference Jagger, Cox and Le Roy2006).
Statistical analysis
Socio-demographic differences in having good health were assessed by chi-square tests; the significance of all analyses was set at p<0.05. Finally, four logistic regression models for SRH were fitted for determining the correlates indirectly affecting the HLE of the older population. Sufficiency of income alone was included in the multivariate analysis instead of three variables – respondents’ monthly incomes, sufficiency of income and families’ monthly incomes – because of high positive correlations among them (respondents’ monthly incomes versus sufficiency of income: 0.56; respondents’ monthly incomes versus families’ monthly incomes: 0.47; sufficiency of income versus families’ monthly incomes: 0.33). Moreover, multicollinearity in the logistic regression analyses in our study was checked by examining the standard errors for the regression coefficients. A standard error larger than 2.0 indicates numerical problems, such as multicollinearity among the independent variables (Chan Reference Chan2004). All the variables significant in chi-square tests were included in a binary logistic regression model, and the forward method was performed to identify the most significant explanatory factor for Model I first. Extensions to Models II and III were done in steps including less significant and theoretically relevant variables. Model IV is adjusted for all the variables significant in chi-square tests. The entire analysis of the study was conducted using SPSS version 15.0 for Windows (SPSS, Chicago, USA).
Results
Table 1 provides the distribution of the characteristics of the study's respondents. As can be seen from Table 1, the average age of the respondents was 68 years, and 58 per cent were young-old (i.e. 60–69 years). More than half of respondents (54 per cent) were female and 53 per cent came from rural areas. Education levels were low, with about three in five respondents illiterate. About 60 per cent of respondents remained married, and approximately three in five rated their health as poor/very poor.
Table 1. Basic characteristics of older people in Rajshahi district

Note: CI: confidence interval.
Table 2 shows total LE, expected number of years in good and poor SRH with 95 per cent confidence intervals, and the expected proportions of remaining life in good health at ages 60, 65, 70, 75 and 80 for Rajshahi district, 2009. LE and expected life in poor and good SRH decreases as age increases. At each age, the expected life in poor health is longer than that in good health. The proportion of expected life in good health declined by about half from 41 to 21 per cent for older people between the ages of 60 and 80.
Table 2. Life expectancy and healthy life expectancy in Rajshahi district, 2009
Note: CI: confidence interval.
Table 3 shows the association between SRH and socio-demographic characteristics of the study respondents with chi-square tests. Older individuals were generally more likely to report poor health than their younger counterparts. The proportion of respondents in good health declined from 48 to 39 per cent between age groups 60–69 and 70–74 years. The proportion continued to decline steeply to 21 per cent for those individuals 80 years old and older. It is important to note that these SRH proportions with the computed life table for Rajshahi district produced the HLE figures of Table 2. Older males compared to females (49 per cent versus 35 per cent) and individuals from urban areas compared to individuals from rural areas (50 per cent versus 34 per cent) demonstrated significantly higher percentages of good SRH. Older individuals who were educated, married and living with someone, and those who had safe toilet facilities, higher individual monthly incomes, higher family monthly incomes and income sufficiency reported having good health in higher percentages than their counterparts. In addition, older people able to perform daily activities, individuals with no physical limitations and individuals exercising in the six months prior to the survey, as well as those never having been abused, having linking social capital and, somewhat unexpectedly, having intoxication habits reported having good SRH in significantly higher percentages than their counterparts.
Table 3. Socio-demographic characteristics and having good health among older people in Rajshahi district

Notes: p values are of chi-square tests. 1. Respondents were asked whether or not they have sanitary toilets and safe materials such as hand rails, no water on the toilet floor, toilet slippers, etc. 2. Intoxication habits include consumption of tobacco such as bidi/cigarette, betel leaf, ganja and tari (a kind of home-made wine). Bidi consists of sun-dried and cured tobacco flakes hand-rolled in a rectangular piece of paper or tobacco leaf. BDT: Bangladeshi Taka (in April 2009, one US dollar was approximately equal to 69 BDT).
Table 4 shows the results of binary logistic regressions with adjustments for significantly associated variables in chi-square tests to examine the predictors of SRH, focusing initially on the impact of the most significant variable. As already noted, the outcome variable is poor or very poor SRH compared with fair, good or very good SRH. Model I is unadjusted for any other controls and indicates that there is a significant advantage for SRH of doing exercise: odds ratio (OR)=5.49 (95% confidence interval (CI): 4.03–7.47). Controlling for age, sex and residence in Model II decreases the advantage of doing exercise: OR=4.93 (95% CI: 3.56–6.82). The advantage of doing exercise for SRH is attenuated but persists after controls for income sufficiency, physical limitations and ever abused are added in Model III: OR=4.45 (95% CI: 3.20–6.19). And, finally, the advantage of doing exercise for SRH is attenuated but persists as the most significant predictor after controls for all significantly associated variables in chi-square tests are added in Model IV: OR=4.39 (95% CI: 3.14–6.15). Residence came out as the second most significant predictor of SRH. When exercise, age and sex are controlled for in Model II, individuals from urban areas are more likely to report good health than rural individuals, and the residence effect persists when several controls are added in Models III and IV. With regard to age patterns, when exercise, residence and sex are controlled for in Model II, older individuals are more likely to report poor SRH, and this also persists in Models III and IV. With regard to gender, when exercise, residence and age are controlled for in Model II, males are more likely to report good SRH, but the gender effect becomes insignificant when controls are added in Models III and IV. The results of the final model (Model IV) show that several different dimensions of health, such as sufficiency of income, physical limitations and ever abused, also have significant independent impacts on SRH, while some significant variables (in chi-square) such as educational levels, living arrangements, safe toilet facilities, ability to perform daily activities, intoxication habits and linking social capital become insignificant. Finally, age and gender interactions for each of these distinct SRH indicators were tested and found not to be significant.
Table 4. Odds ratios for good versus poor self-rated health in Rajshahi district
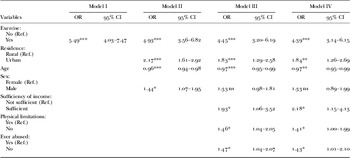
Notes: Ref.: reference category. OR: odds ratio. CI: confidence interval. Model IV is adjusted for the effects of all significant variables in Table 3 (p < 0.05).
Significance levels: *p<0.05, **p<0.01, ***p<0.001, ns: not significant.
Discussion
Bangladesh is now passing through the third stage of demographic transition (Bairagi and Datta Reference Bairagi and Datta2001), where the combination of declining fertility since the late 1970s, declining mortality since the mid-twentieth century and increasing LE has produced a huge youthful population and a growing number of older adults (Razzaque et al. Reference Razzaque, Nahar, Khanam and Streatfield2010). As a result of mortality decline during the past few decades, LE at age 60 has increased significantly in Bangladesh, but there is no published information on healthy life expectancy. The latest data from the United Nations Population Division (2012) show that LE at age 60 is 18 years for both males and females, indicating the absence of gender differences in LE at age 60. This study thus analyses older males and females together and estimates HLE for the study area.
The study found that LE and expected life in poor and good health decreased with increasing age. Individuals at age 60 expected about 41 per cent of their remaining life to be in good health, while individuals at age 80 expected only 21 per cent of their remaining life to be in good health. Because the number of older people is increasing rapidly along with an increase in chronic diseases in Bangladesh (Razzaque et al. Reference Razzaque, Nahar, Khanam and Streatfield2010), and advancing years generally lead to a deterioration in the quality of life (Wiggins et al. Reference Wiggins, Higgs, Hyde and Blane2004), it is likely that this older population, particularly those people who are 80+ years old, will need more support (physical/co-residence, social and economic) and should receive due attention and special care.
In this study's bivariate analysis, age, sex, residence, educational level, marital status, living arrangements, safe toilet facilities, income, sufficiency of income, ability to perform daily activities, physical limitations, exercise behaviour, intoxication habits, abuse status and linking social capital were significantly associated with SRH. Previous studies have demonstrated that older females are more likely to report worse health and to have a higher prevalence and incidence of disability, lower mobility and decreased strength than their male counterparts (Case and Paxson Reference Case and Paxson2005; Drumond Andrade et al. Reference Drumond Andrade, Guevara, Lebrão, de Oliveira Duarte and Santos2011; Oman, Reed and Ferrara Reference Oman, Reed and Ferrara1999). In Bangladesh, older females have also been found to have more limitations than males in self-reported activities of daily living and observed physical performance (Rahman and Liu Reference Rahman and Liu2000). The current study is in agreement with recent studies (Rahman and Barsky Reference Rahman and Barsky2003; Razzaque et al. Reference Razzaque, Nahar, Khanam and Streatfield2010) indicating that older females are worse off than their male counterparts. When we control for the effect of exercise, residence and age, the multivariate regression analysis reveals female disadvantages in SRH status. In Bangladesh, women are highly disadvantaged compared to men, and gender differences in SRH are expected. However, gender differences in SRH cease to be statistically significant in multivariate regression models with additional controls for the effects of income sufficiency, physical limitations, abuse, education, marital status, living arrangements, safe toilet facilities, family expenditure responsibilities, ability to perform daily activities, intoxication habits and linking social capital. This confirms the lack of gender inequality in SRH at old ages in Rajshahi district of Bangladesh, when we control for all socio-demographics.
Health is better among the educated/married/those able to perform daily activities/those with no physical limitations/those who have never been abused/those with linking social capital. The finding that individuals living with someone are healthier than those living alone is in line with the findings of a study by Rahman, Menken and Kuhn (Reference Rahman, Menken and Kuhn2004), although in our study this finding became insignificant in regression analysis. This study also found significant differences in good SRH between urban and rural areas and between individuals with varying income levels.
Finally, the results from multivariate analyses suggest that SRH in our study population is multifaceted. This study identified exercise in the six months preceding the survey as the single most important determinant of SRH as well as a significant indirect factor affecting HLE in the study population. The effect of exercise persisted (in an attenuated fashion) even when controls were added. This is in line with the observation that adopting a healthier lifestyle by exercising more and not smoking is beneficial in old age (Ford, Spallek and Dobson Reference Ford, Spallek and Dobson2008). Place of residence was also found to be a significant predictor of SRH as people from urban areas were more likely to have good health than people from rural areas. People from urban areas generally have more education, income and amenities such as parks and recreational facilities than do people from rural areas. People from urban areas tend to adopt healthy lifestyle habits, such as exercising, which helps them stay healthier than their rural counterparts. Age too was a correlate of SRH. A gradual deterioration in SRH was observed with the advancement of age. Gradients in SRH by age are evident; younger people have better health than older people (Abikulova et al. Reference Abikulova, Tulebaev, Akanov, Turdalieva, Kalmahanov, Kumar, Izekenova, Mussaeva and Grjibovski2013). Inverse associations between age and good SRH are well known and can be explained by poorer objective health status and a greater number of chronic diseases among the older population (Kim et al. Reference Kim, Cho, Shin and Park2012).
In this study, as in other studies (Huisman, van Lenthe and Mackenbach Reference Huisman, van Lenthe and Mackenbach2007; Singh-Manoux et al. Reference Singh-Manoux, Dugravot, Shipley, Ferrie, Martikainen, Goldberg and Zins2007; Zimmer et al. Reference Zimmer, Natividad, Lin and Chayovan2000), socio-economic status is a strong correlate of SRH. Individuals with sufficient income were more likely to report good SRH. This draws our attention to the plight of older people, especially poor older people, in Bangladesh (HelpAge International 2000). The majority of older people in Bangladesh have problems meeting their basic needs, due to lack of social security, loss of income and physical disability (Ahmed et al. Reference Ahmed, Rana, Chowdhury and Bhuiya2002; Mostafa and van Ginneken Reference Mostafa and van Ginneken2000). Family remains the primary source of support for older people, and sons, especially, are expected to support their parents (Kabir, Szebehely and Tishelman Reference Kabir, Szebehely and Tishelman2002). But even this support is undermined by poverty (Ahmed et al. Reference Ahmed, Rana, Chowdhury and Bhuiya2002). Our logistic regression Model IV in Table 4 indicates that HLE would increase from 6.5 years to 9.2 years at age 60 if all respondents answered they had sufficient income.
A study by Munsur, Tareque and Rahman (Reference Munsur, Tareque and Rahman2010) reveals that older people who are not abused are more likely to report good SRH than abused older people. In developing countries, women who are totally dependent for their economic livelihood upon their husbands are particularly affected when they suffer domestic abuse (Vlassoff Reference Vlassoff2007). In our sample, this female disadvantage does not vary with abusive behaviour (i.e. there are no Sex × Ever abused interactions). Finally, individuals with no physical limitations were more likely to report good SRH than their counterparts. This latter point merits attention as a potential avenue for improving SRH among older people in Rajshahi district of Bangladesh.
In the cultural context of Bangladesh, individuals, even when they are in good/very good health, are reluctant to classify themselves as being in good/very good health (because of the sense that ‘it might attract the attention of “the gods” ’), and the tendency is to say that one is in fair health. The fair health category, thus, in all likelihood is composed of a substantial proportion of people in good/very good health, and it is therefore reasonable to combine the fair, good and very good categories. In so doing, the dichotomy of poor/very poor versus fair/good/very good would provide the sharpest contrast. Consequently, to produce stable estimates for HLE and correlates of SRH by taking into consideration the cultural context of Bangladesh, two categories of SRH, namely poor (poor/very poor) and good (fair/good/very good) were created. This categorisation is also supported by a study by Rahman and Barsky (Reference Rahman and Barsky2003). A different coding scheme (i.e. three categories: (a) poor/very poor, 58.5 per cent; (b) fair, 33.0 per cent; (c) good/very good, 8.5 per cent) results in a less sharp contrast in our results. It is likely that an alternate set of two categories ((a) fair/poor/very poor, 91.5 per cent; (b) good/very good, 8.5 per cent) would also give us a skewed distribution in outcome.
Limitations
This study has a few limitations. The sample size is limited and collected from one district, Rajshahi; it is not nationally representative. Caution should therefore be exercised in generalising the results of this study to the whole of Bangladesh. The institutionalised population was not taken into account in the computation of HLE. If individuals living in institutions have poorer health than individuals residing in the community, not taking into account the institutionalised population might overestimate HLE, especially at older ages (Yong and Saito Reference Yong and Saito2009). In Bangladesh, however, the number of older people living in institutions is negligible. Here, we assume that they exhibit the same distribution of health conditions as older people in the community at large. Moreover, the subjective nature of SRH, rather than the assessment of health by physician diagnoses, might introduce gender bias in the findings (Case and Paxson Reference Case and Paxson2005). Some priority measures such as types and duration of physical exercise, disease statuses and objective measures of health have not been addressed here because of financial and time constraints. Addressing these limitations in detail in future research is vital for the making of a healthy aged society.
Conclusions
To improve the health of the population, especially the health of older people, it is important to know their health status and quality of life, and this can be done by estimating HLE. The periodic calculation of HLE permits the evaluation of the impact of new health policies at a given moment, as well as the assessment of trends under changing health conditions. Health objectives can also be fixed through HLE, which is a tool for checking ‘what is occurring’ or ‘what is being done’ at present, because it makes possible a detailed evaluation of present conditions (Robine, Michel and Branch Reference Robine, Michel and Branch1992). This paper has revealed the specific correlates of SRH that indirectly affect HLE. The factors most strongly associated with good SRH among older people in Rajshahi district are exercise behaviour, sufficiency of income, physical limitations and facing abusive behaviour. While rural–urban differentials and some health decline in old age is inevitable, the above four factors are to a certain extent modifiable and therefore provide a potential for improvement of SRH and HLE. The study thus urges giving special attention to exercise behaviour, income, physical limitations and elder abuse for improving SRH and, indirectly, HLE among older people in Bangladesh, particularly those in Rajshahi district.
Acknowledgements
Data came from the promotional project number SSRC/74/2000/(PART-5)/137 funded by the Social Science Research Council (SSRC), Planning Division, Ministry of Planning, Government of Bangladesh. Some findings of this paper were presented at the 2012 71st Japanese Society of Public Health Meeting (JSPH2012), Yamaguchi Prefecture, Japan. Thanks are due to the participants of JSPH2012 for their thoughtful comments. Special thanks to Nazrul Hoque, PhD, Department of Demography and Institute for Demographic and Socioeconomic Research, University of Texas at San Antonio, USA, for his kind co-operation in estimating the 2008–2009 population of Bangladesh. Finally, the authors are grateful to the interviewees and the field investigators without whom the study would have been impossible. Data collection procedures and funding for the promotional project, ‘Socio-demographic Status of the Aged Population and Elderly Abuse: A Study on Rural–Urban Differentials in Rajshahi District, Bangladesh’ were approved by the SSRC Review Board, Planning Division, Ministry of Planning, Government of Bangladesh. All subjects were asked to provide informed consent after being read a document emphasising the voluntary nature of participation in the project. Any information identifying respondents was removed. The authors’ roles were as follows: MIT originated the study and contributed to the study design, statistical analysis and the writing of the article; TMI helped conceptualise the study and contributed to study design, analysis and revisions of the article; KK contributed to the conception, design and revision of the study; MS helped analyse data, including instrumentation and report writing; YS participated in the conception and design of the study and critically revised the article. No competing interests have been declared.


