


Introduction
Disability affects quality of life; this has been widely recognised and, over the past two decades, apart from estimating life expectancy at birth, a lot of emphasis has been put on deriving estimates of healthy life years (Robine et al. Reference Robine, Cambois, Nusselder, Jeune, Van Oyen and Jagger2013). Additionally, severe disability poses a significant financial burden on health-care services since it often results in loss of independence requiring provision of long-term care and use of technological aids (Geerts et al. Reference Geerts, Willemé, Pickard, King, Comas-Herrera, Wittwer, Goltz, Mot, Schultz, Sowa and Vegas2012). Disability rates increase with age; they are higher among older persons and, in particular, among the older old. In fact, numbers of disabled persons in a population depend mainly upon two parameters: numbers of older people and age-specific disability rates. Hence, trends in prevalence among older adults in Europe have become an issue of interest in recent years due to the expected increase in the numbers aged 65+, as the large baby-boom cohorts reach retirement age, and the continuing decline in mortality of that age group (Bonneux et al. Reference Bonneux, Van der Gaag, Bijwaard, Mot and Willemé2012). According to Lutz, Sanderson and Scherbov (Reference Lutz, Sanderson and Scherbov2001), if mortality continues its fast downward trend while fertility remains at low levels (median forecast), the proportion of the population above 60 in Western Europe will increase further, reaching 35 per cent by the middle of the century and 45 per cent by the end of the century. Proportions of persons aged 80+ are likely to increase even faster. Projections carried out by Eurostat suggest that in the EU-27 numbers of persons aged 65+ may increase from 84.6 million in 2008 to 151.5 million in 2060, while numbers of persons aged 80+ are projected to nearly triple, from 21.8 to 61.4 million (Giannakouris Reference Giannakouris2008).
This rapid increase of the population above age 65 and, particularly of its oldest old segment, may result in a substantial increase in the future numbers of disabled persons in Europe (Bonneux et al. Reference Bonneux, Van der Gaag, Bijwaard, Mot and Willemé2012). Lutz and Scherbov (Reference Lutz and Scherbov2005), on the other hand, projecting numbers of disabled among the 2000 EU-15 population using various scenarios, estimated that a reduction in the age pattern of disability by two years per decade would offset any future increase in the numbers of disabled. Hence, assessment of trends over time is of great significance in estimating numbers of disabled people to plan effectively for the future. Empirical evidence from the United States of Americs (USA) indicates that while in the 1970s rising life expectancy resulted in increases in the years of disability that trend was reversed subsequently due to declining disability prevalence at all ages (Crimmins, Saito and Ingegneri Reference Crimmins, Saito and Ingegneri1997; Freedman et al. Reference Freedman, Crimmins, Schoeni, Spillman, Aykan, Kramarow, Land, Lubitz, Manton, Martin, Shinberg and Waidmann2004; Manton and Gu Reference Manton and Gu2001). More recently, however, increasing prevalence was observed in some cases, mainly among younger age groups (persons aged below 65 or 70) (Freedman et al. Reference Freedman, Spillman, Andreski, Comman, Crimmins, Kramarow and Lubitz2013; Martin and Schoeni Reference Martin and Schoeni2014; Seeman et al. Reference Seeman, Merkin, Crimmins and Karlamangla2010). Other research indicates a decline in disability rates over the 1990s in Japan and in the period 1989–2007 in Taiwan (Martin, Zimmer and Hurng Reference Martin, Zimmer and Hurng2011; Schoeni et al. Reference Schoeni, Liang, Bennet, Sugisawa, Fukaya and Kobayashi2006).
Detailed analysis of current trends concerning Europe is rather scarce (Lutz, Sanderson and Scherbov Reference Lutz, Sanderson and Scherbov2001) though there is some evidence mainly about Northern European countries. A study by Egidi (Reference Egidi2003) shows that, in specific countries, disability rates among older adults appear to be on the decline over the 1980s and the 1990s. Similarly, there is some evidence showing a declining trend in severe disability in the 1990s among persons aged 65+ in Finland and in mild disability in Norway over the period 1987–2008 (Moe and Hagen Reference Moe and Hagen2011; Sulander et al. Reference Sulander, Martelin, Sainio, Rahkonen, Nissinen and Uutela2006). By contrast, analyses of survey data from France provide conflicting evidence for the period 1980–2008; while for persons aged 65+ it seems that increasing disability is coupled with a reduction in its severity, for those in mid-adulthood there seems to be an overall increase (Cambois, Blachier and Robine Reference Cambois, Blachier and Robine2012; Cambois et al. Reference Cambois, Clavel, Romieu and Robine2008). Similarly, conflicting trends have been found regarding the Swedish population aged 65–84, where there was an improvement in the period 1980 to the mid-1990s but a worsening or no change thereafter (Parker et al. Reference Parker, Schön, Legergren and Thorslund2008). Further, among Swedish persons aged 77+, a worsening in mobility has been found for the period 1992–2002 but no significant change in basic activities of daily living (ADLs) or instrumental ADL (IADL) activity restrictions (Parker, Ahacic and Thorslund; Parker and Thorslund Reference Parker and Thorslund2007).
Hence, evidence from Europe is rather inconsistent and there is no consensus on current and future trends. Further exploration and data analysis is needed to observe tendencies in mild and severe disability in order to obtain a clearer picture of likely changes in European context. This is where the present study aims to make a contribution, using data from four waves of the Survey of Health, Ageing and Retirement in Europe (SHARE), conducted in the period 2004–2013, comprising a broad spectrum of Europe's population, ranging from Northern to Central and Southern Europe. The main aim of the study is to assess trends in disability by sex and broad age group (50–64 and 65+) and to consider the role played by chronic conditions in these changes. In order to obtain a more complete picture, four different measures of disability are used, three of which reflect restrictions in activities (ADLs, IADLs and the Global Activity Limitation Indicator – GALI), while the fourth (mobility difficulties) is an indicator of functional limitations. The time span covered by the data (nine years) and the number of waves (four) exceed the minimum requirements for deriving trends (Freedman, Martin and Schoeni Reference Freedman, Martin and Schoeni2002; Martin, Zimmer and Hurng Reference Martin, Zimmer and Hurng2011).
Theoretical framework
Among older adults disability is caused, or exacerbated in many instances, by diseases and pathologies such as cardiovascular disease, cataracts, arthritis, Parkinson's disease, fractures, asthma, diabetes, etc. (Bhattacharya Choudhry and Lakdawalla Reference Bhattacharya, Choudhry and Lakdawalla2008; Dunlop et al. Reference Dunlop, Manheim, Sohn, Liu and Chang2002; Gilmour and Park Reference Gilmour and Park2006; Schoeni, Freedman and Martin Reference Schoeni, Freedman and Martin2008; Woo et al. Reference Woo, Ho, Yu, Lau and Yuen1998). Griffith et al. (Reference Griffith, Raina, Wu, Zhu and Stathokostas2010), for instance, estimated that chronic conditions contributed 50 per cent in IADL disability and 66 per cent in ADL disability in their study population. Diseases may cause impairments, dysfunctions and abnormalities which lead to functional limitations (Verbrugge and Jette Reference Verbrugge and Jette1994). Functional limitations have several dimensions; they may be sensory (hearing, seeing, etc.), physical/motor (bending, stooping, climbing stairs, etc.) or cognitive/mental (Cambois, Blachier and Robine Reference Cambois, Blachier and Robine2012). All types of limitations may lead to activity restrictions and disability. Intervention, on the other hand, in the form of medical care/rehabilitation, surgical procedures, medication, use of external supports (i.e. personal assistance, special devices, aids or equipment) and appropriate modifications in the environment (i.e. housing facilities) may compensate for certain limitations and activities may not be restricted. Therefore, over time changes in disability prevalence may reflect any combination of the following: changes in the prevalence of chronic conditions, changes in the prevalence of functional limitations, changes related to medical intervention and the use of assistive technology or improvements in the environment/accommodation which facilitate life among persons with impairments (Altmets et al. Reference Altmets, Puur, Uusküla, Saava, Sakkeus and Katus2010; Freedman et al. Reference Freedman, Crimmins, Schoeni, Spillman, Aykan, Kramarow, Land, Lubitz, Manton, Martin, Shinberg and Waidmann2004). Declines in late-life disability among Americans over the period 1980–2005, for instance, are partly related to a reduction in the prevalence of chronic conditions brought about by the expansion of medical treatments of cardiovascular disease, cataract surgery, hip and knee replacement procedures, better medication for arthritis, as well as more use of assistive technology (Schoeni, Freedman and Martin Reference Schoeni, Freedman and Martin2008).
Disability prevalence depends also upon demographic factors, mainly age and sex. Prevalence increases with increasing age for both sexes, more sharply among those aged 40+, but especially among the older old (Jagger and Fouweather Reference Jagger and Fouweather2012; Wahrendorf, Reinhardt and Siegrist Reference Wahrendorf, Reinhardt and Siegrist2013). Moreover, though female mortality is lower than male, it has been suggested that older women are much more likely than men of the same age to experience functional impairment in mobility and personal self-care (Arber and Cooper Reference Arber and Cooper1999). The excess of female over male disability varies with age and to estimate measures such as Healthy Years of Life, age- and sex-specific disability rates are necessary (Jagger et al. Reference Jagger, Cox, Le Roy, Clavel, Robine, Romieu and Van Oyen2007; Macintyre, Hunt and Sweeting Reference Macintyre, Hunt and Sweeting1996; Melvin et al. Reference Melvin, Hummer, Elo and Mehta2014; Moe and Hagen Reference Moe and Hagen2011; Parker et al. Reference Parker, Schön, Legergren and Thorslund2008; Sulander et al. Reference Sulander, Martelin, Sainio, Rahkonen, Nissinen and Uutela2006). Further, analysis of trends by broad age groups is suitable on two counts: First, as the highest rates of disability prevalence are observed among persons aged 65+, who represent the greatest burden on health-care systems, and whose numbers are projected to increase substantially by 2060 (Giannakouris Reference Giannakouris2008), it is of great importance to single out changes within that age group. Second, recent analyses indicate conflicting trends in disability prevalence for persons in mid-life (mainly 40–64 or 50–64) in comparison to older persons; whereas for individuals below age 65 there is an increase in prevalence, the opposite seems to be the case among those aged 65+ or 85+ (Cambois, Blachier and Robine Reference Cambois, Blachier and Robine2012; Freedman et al. Reference Freedman, Spillman, Andreski, Comman, Crimmins, Kramarow and Lubitz2013; Martin and Schoeni Reference Martin and Schoeni2014; Martin et al. Reference Martin, Freedman, Schoeni and Andreski2010; Seeman et al. Reference Seeman, Merkin, Crimmins and Karlamangla2010).
Measurement of disability
According to the World Health Organization (2001), disability is more than a biological dysfunction; it involves activities at the individual level and participation in society. Hence, apart from measurements of grip strength, walking speed and other observational indices, the estimation of disability prevalence may be based on self-reported measures reflecting difficulties in ADLs and IADLs, or functional limitations related to mobility, or the need to use help or special equipment to carry out everyday basic activities and specific tasks (Fonda and Herzog Reference Fonda and Herzog2004; Katz Reference Katz1983; Katz et al. Reference Katz, Ford, Moskowitz, Jackson and Jaffe1963, Reference Katz, Downs, Cash and Grotz1970). Over the past decade a subjective measure, the GALI, has also been developed and validated, and has been used extensively since to estimate healthy years of life expectancy (Robine and Jagger Reference Robine and Jagger2003; Van Oyen et al. Reference Van Oyen, van der Heyden, Perenboom and Jagger2006).
ADLs and IADLs reflect activity restrictions and may be considered similar in the sense that they deal with the ability of an individual to perform specific tasks; moreover, they refer to difficulties concerning mostly older old persons. GALI, though again referring to activity restrictions, is of a more general nature and can also identify limitations occurring before age 65 (Cambois, Blachier and Robine Reference Cambois, Blachier and Robine2012). Mobility difficulties refer to specific items regarding physical/motor limitations, some of which may occur to younger persons, and reflect functional limitations. Hence, though many of these measures are used interchangeably as indicators of disability, in particular ADLs, IADLs and more recently GALI, they reflect different stages of the disablement process and their prevalence differentiates between sexes and age groups.
Data and methods
Data
The data used in the analysis derive from the most recent releases of Waves 1 (release 2.6.0), 2 (release 2.6.0), 4 (release 1.1.1) and 5 (release 1.0.0) of the SHARE study. Wave 3 collected mainly retrospective information and has been excluded from the present analysis. SHARE is a longitudinal survey collecting comparable statistical information on a wide range of variables including, among others, demographic characteristics and self-reported health indicators. The first wave of the study was carried out in 2004 in 11 European countries. Sampling strategies varied across countries, dependent on the available means for constructing sampling frames. Eligible respondents were persons aged 50+ at the interview who were resident at the sampled household; persons incarcerated, hospitalised or institutionalised were excluded from the survey (Klevmarken, Swensson and Hesselins Reference Klevmarken, Swensson, Hesselins, Börsch-Supan and Jürges2005). The average household response rate at Wave 1 was 60.6 per cent and ranged from 38.8 per cent in Switzerland to 79.2 per cent in France (De Luca and Peracchi Reference De Luca, Peracchi, Börsch-Supan and Jürges2005). These rates are fairly similar to or higher than rates achieved in other European surveys such as the European Community Household Panel, the European Labour Force Survey, the European Social Survey, etc. The average individual response rate at Wave 1 was 85.0 per cent, ranging from 73.7 per cent (Spain) to 93.0 per cent (Denmark).
Waves 2, 4 and 5 of the survey were carried out in 2006/7, 2011 and 2013, respectively. Due to the longitudinal design of the survey, there was some attrition due to non-response and death between the waves. Hence, from Wave 2 onwards, a refresher sample has been drawn (SHARE 2013, 2015a , 2015b ). Persons who are members of the longitudinal sample are excluded from the survey if they are incarcerated, hospitalised or have moved out of the country; however, those moving within the country or to a nursing home are followed and re-interviewed (Börsch-Supan et al. Reference Börsch-Supan, Brandt, Hunkler, Kneip, Korbmacher, Malter, Schaan, Stuck and Zuber2013).
The present study considers the cross-sectional samples of the above-mentioned four waves, covering a time-span of about nine years; attrition of the longitudinal sample is not an issue in this instance. The analysis deals with the ten countries participating at all waves, i.e. Austria, Germany, Sweden, the Netherlands, Spain, Italy, France, Denmark, Switzerland and Belgium. These represent Northern, Central, Western and Southern Europe. The overall sample includes 129,796 persons; those with non-missing information on demographic and the health-related indicators of interest range from 129,283 (GALI) to 129,234 (ADLs, IADLs) observations.
Measures
Dependent variables
SHARE provides information on a number of self-reported health indicators including functional limitations and activity restrictions. The SHARE questionnaire includes six limitations in ADLs (Katz et al. Reference Katz, Ford, Moskowitz, Jackson and Jaffe1963, Reference Katz, Downs, Cash and Grotz1970), seven limitations in IADLs (Lawton and Brody Reference Lawton and Brody1969) and ten mobility limitations regarding activities related to stamina, strength, arm and fine motor function (Fonda and Herzog Reference Fonda and Herzog2004). The items comprising these measures are described in detail in Appendix 1. In addition, an indicator of general health stems from a question on whether the respondent considered him- or herself as ‘strongly limited in activities people usually do’ due to a health problem, ‘limited but not strongly’ or ‘not limited’ for at least the six months preceding the survey; that question served to construct the GALI indicator (Robine and Jagger Reference Robine and Jagger2003). In this analysis respondents reporting at least one ADL limitation, one IADL limitation, one mobility difficulty and moderate/severe limitation problems (= 1) are compared to those not limited at all (= 0). These cut-offs are provided by SHARE and a binary version of the corresponding variables is included in the SHARE data-set.
Independent variables
Age and gender are core variables in any mortality or health-related study. Age is measured as the interval between the reported date of birth and the date of interview and it is expressed in single years; it is included in this form in all statistical models. Sex is not included in the models as these were run separately for males and females. Further, a binary variable was also defined taking the value of one for individuals reporting at least one chronic condition and zero for those reporting none. This variable was based on a list of chronic diseases included in the SHARE questionnaire (see Appendix 1), comprising items related to cardiovascular diseases and other heart-related conditions, lung diseases and asthma, malignant neoplasms, but also cataracts, fractures, arthritis as well as high blood pressure, cholesterol and diabetes. Finally, an ordinal variable representing the successive waves of the survey has also been included in the models, to estimate the average change in the period 2004–2013 under the assumption of linearity. Though the average change may conceal fluctuations occurring between the waves in specific countries, examining, on the other hand, short-term fluxes lacks meaning. As already mentioned, the main scope of the analysis is to establish possible trends since the prerequisites of including data from at least three waves, covering a time span of at least six years, are fulfilled (Freedman, Martin and Schoeni Reference Freedman, Martin and Schoeni2002; Martin, Zimmer and Hurng Reference Martin, Zimmer and Hurng2011).
Statistical analysis
Age-standardised proportions with disability, by sex, wave and indicator
To evaluate changes in disability levels by sex, across indicators and between waves, age–sex-standardised prevalence proportions are calculated using the direct standardisation technique. The observed prevalence proportions are applied to a ‘standard’ age distribution to obtain expected proportions under constant age structure conditions. The distribution of the respondents at Wave 1 for both sexes combined is taken as ‘standard’ in this instance; hence, the rates are also comparable between the sexes.
Logistic regression models
In all statistical analyses, weights provided by the SHARE team, adjusting for non-response, have been used (SHARE 2013, 2015a , 2015b ). Apart from the descriptive statistics, logistic regression models have been estimated to assess the statistical significance of trends in functional limitations and activity restrictions in the nine-year period between the waves. First, a null model controlling for age (Model 1) was run on the pooled observations of Waves 1–5, for each disability indicator, by country. The dependent variables are represented by the binary indicators of GALI, ADLs, IADLs and mobility limitations described above. Since observations for persons present at more than one wave are correlated, the estimates have been adjusted for within-cluster correlation; paired observations are identified and robust standard errors of the parameters are estimated. This procedure does not affect the values of odds ratios (ORs) but results in their statistical significance being reduced compared to the unadjusted estimates. The above-mentioned null model was estimated separately for males and females aged 50–64 and 65+, to assess whether trends differentiate between younger and older men and women. Second, these models were re-estimated controlling additionally for chronic diseases (Model 2), in order to evaluate their role in the disablement process. The significance of the estimated parameters is evaluated on the basis of the Wald test and the overall goodness-of-fit of the models is assessed on the basis of log likelihood. The statistical analysis was carried out using Stata 13.
Results
Descriptive findings
The cross-sectional unweighted samples of Waves 1, 2, 4 and 5 include in total 129,796 persons. Table 1 shows sample sizes by country and their percentage distribution by sex (unweighted and weighted); the largest samples correspond to Belgium (13.4 per cent) and France (12.3 per cent), whereas the smallest corresponds to Switzerland (6.9 per cent). Tables 2, 3 and 4 are based on weighted frequencies. Of the overall weighted sample, 23.3 per cent are Wave 1 respondents, 24.0 per cent are Wave 2 respondents, 25.3 per cent correspond to Wave 4 and 27.4 per cent to Wave 5. Females constitute 54.4 per cent of the respondents; Italy is the country with the highest proportion of women (55.0 per cent) whereas Sweden is the country that includes the lowest proportion (52.7 per cent) (Table 1). The mean age of the women in the overall sample is 67.0 years compared to 64.9 years for men. Hence, whereas the majority 53.6 per cent of men are aged below 65 (Table 2), the opposite holds for women. In fact, the ‘youngest’ sample originates in the Netherlands with 58.4 per cent of the male and 52.6 per cent of the female respondents aged below 65 (mean ages 64.0 and 65.8, respectively). The ‘oldest’ sample, on the other hand, originates in Italy where the corresponding proportions under age 65 for males and females are 50.9 per cent and 44.6 per cent (mean ages 65.4 and 67.4).
Table 1. Sample sizes of participants at Survey of Health, Ageing and Retirement in Europe (SHARE) Waves 1, 2, 4 and 5 by country, and percentage of males
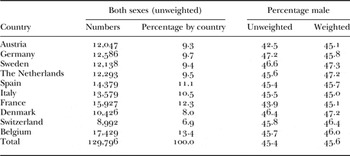
Table 2. Weighted age composition of the samples (all waves) by sex and country
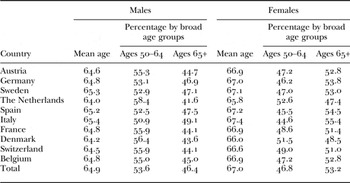
Table 3. Weighted percentages of persons reporting at least one chronic disease in the overall sample (all waves) by broad age groups, sex and country
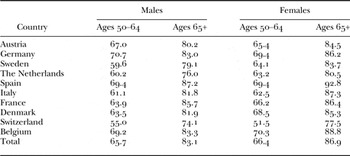
Table 4. Weighted percentages of participants (all waves) with at least one disability by indicator, sex, broad age groups and country
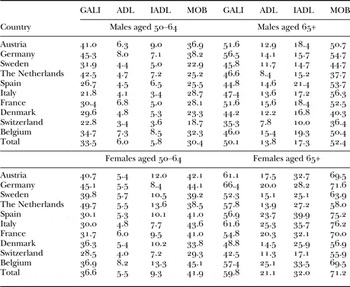
Notes: GALI: Global Activity Limitation Indicator. ADL: activities of daily living. IADL: instrumental activities of daily living. MOB: mobility difficulty.
Of the male respondents aged 50–64, 65.7 per cent report at least a chronic condition compared to 66.4 per cent of females in that age group; the respective proportions for males and females aged 65+ are higher, 83.1 and 86.9 per cent, respectively (Table 3). Prevalence differentiates by country; the highest proportions of persons suffering from at least one chronic condition are observed in Germany (males and females aged 50–64), Belgium (females all ages), Spain (males all ages and females aged 65+) and France (females 65+). By contrast, respondents from Switzerland (both sexes and age groups) exhibit the lowest proportions as do males aged 50–64 from Sweden, males and females aged 65+ from the Netherlands and females aged 50–64 from Italy.
Table 4 shows weighted percentages of males and females reporting disability by broad age group, country and indicator. Among men, 41.2 per cent report themselves as limited in activities (GALI), 40.6 per cent as having at least a mobility difficulty, 11.1 per cent as having at least one IADL limitation and 9.6 per cent as having at least one ADL limitation. The corresponding proportions for women are higher in all instances, ranging from 13.8 per cent (ADLs) to 57.5 per cent (mobility difficulty). Among males aged 50–64, countries that consistently exhibit higher than average values are Austria, Germany and Belgium; the Netherlands exhibits relatively high prevalence for GALI and IADLs, while France exhibits relatively high prevalence for ADLs. Low values for men aged 50–64 are evident for most indicators in Switzerland, Italy and Sweden. Older male respondents exhibit higher than average prevalence in Austria (only for GALI), Germany, France, Belgium but also Spain; relatively low prevalence for that age group can be observed for several indicators in Switzerland, Sweden, the Netherlands and Denmark. Among women, patterns are quite similar to those for men with a few exceptions; Italian females aged 65+ exhibit fairly high prevalence of disability whereas French older women exhibit low levels.
Trends in disability based on age-standardised prevalence proportions by sex
The age-standardised prevalence proportions for males and females indicate that trends are not linear and fluctuate in this nine-year period, substantially in some instances. In fact, it is quite difficult to derive a consistent trend for several countries. Countries that seem, on average, to have experienced some increases in the overall period for most disability measures are Germany and Belgium (Figures A1–A5 in Appendix 2). The Netherlands and France also exhibit some increases, mainly among women, regarding GALI. Decreases in disability seem the case in Sweden, Denmark, Austria (especially after the second wave), Italy (mainly mobility), Switzerland (GALI) and Spain (GALI and ADLs). It is worth noting that the fluctuations and changes observed for each country are quite consistent between the genders.
Trends in disability based on logistic regression models
Figures 1–4 depict trends in disability, showing ORs and 95 per cent confidence intervals for the period 2004–2013, by country and indicator, for males and females aged 50–64 and 65+. Within each figure, the two charts situated in the upper section correspond to Model 1 (males and females), adjusting for age of the respondent at the interview (null logistic regression model); the two charts situated in the lower section of the figure correspond to Model 2, additionally controlling for chronic conditions. A summary of all findings is presented in Table 5 where both the statistically significant (at the 5% level) and the borderline significant (at the 10% level) results are noted.
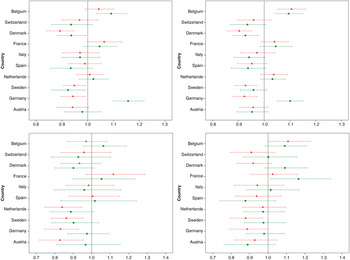
Figure 1. Logistic regression odds ratios and 95 per cent confidence intervals of trends across four Survey of Health, Ageing and Retirement in Europe (SHARE) waves (2004–2013) by country: Global Activity Limitation Indicator (GALI) indicator. Upper panel: controlled for age. Lower panel: controlled for age and chronic conditions. Figures on the left: Males. Figures on the right: Females. Squares: ages 50–64. Triangles: ages 65+.
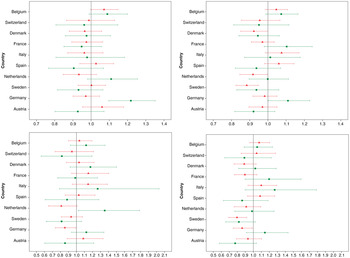
Figure 2. Logistic regression odds ratios and 95 per cent confidence intervals of trends across four Survey of Health, Ageing and Retirement in Europe (SHARE) waves (2004–2013) by country: activities of daily living (ADL) indicator. Upper panel: controlled for age. Lower panel: controlled for age and chronic conditions. Figures on the left: Males. Figures on the right: Females. Squares: ages 50–64. Triangles: ages 65+.
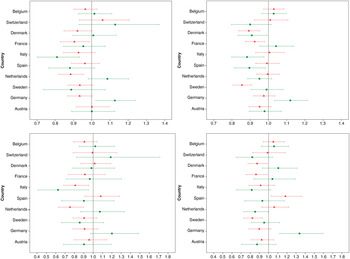
Figure 3. Logistic regression odds ratios and 95 per cent confidence intervals of trends across four Survey of Health, Ageing and Retirement in Europe (SHARE) waves (2004–2013) by country: intrumental activities of daily living (IADL) indicator. Upper panel: controlled for age. Lower panel: controlled for age and chronic conditions. Figures on the left: Males. Figures on the right: Females. Squares: ages 50–64. Triangles: ages 65+.
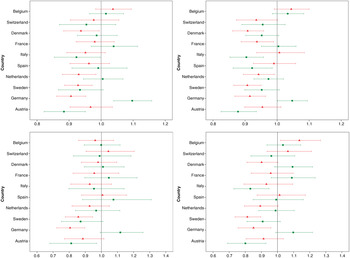
Figure 4. Logistic regression odds ratios and 95 per cent confidence intervals of trends across four Survey of Health, Ageing and Retirement in Europe (SHARE) waves (2004–2013) by country: mobility difficulty (MOB) indicator. Upper panel: controlled for age. Lower panel: controlled for age and chronic conditions. Figures on the left: Males. Figures on the right: Females. Squares: ages 50–64. Triangles: ages 65+.
Table 5. Summary of trends for the period 2004–2013 derived from the logistic regression Models 1 and 2 by indicator of disability and country, for males and females aged 50–64 and 65+
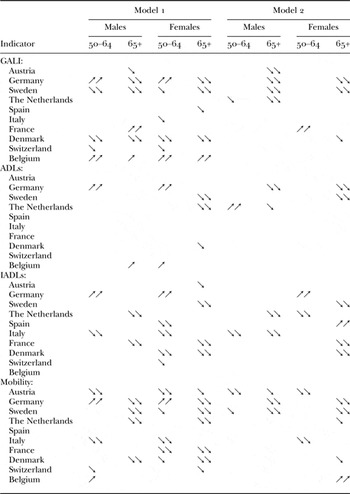
Notes: Model 1 controls for age of the respondent and Model 2 additionally controls for chronic diseases. ↗↗ denotes an increasing trend significant at the 5 per cent level. ↘↘ denotes a decreasing trend significant at the 5 per cent level. ↗ denotes an increasing trend significant at the 10 per cent level. ↘ denotes a decreasing trend significant at the 10 per cent level. Empty cells denote a non-significant trend.
Commenting first on Model 1, the estimates indicate differentiations in trends between countries (upper panels of Figures 1–4). A consistent increasing trend in disability prevalence for all indicators can be observed among persons aged below 65 in Germany; however, among older Germans there is a significant decline in GALI and mobility difficulties. Other countries that exhibit significant increases in disability are Belgium (especially in GALI) and France but only among older males in GALI. Consistent significant decreases, on the other hand, are found among the Swedes and the Danes, who exhibit very similar patterns. There is a significant declining trend in GALI (both sexes and age groups) and in mobility difficulties (with the exception of younger males); regarding ADLs and IADLs, a significant declining trend is apparent mainly among older women. Declines can also be observed for Austrians, especially in mobility difficulties among younger respondents, as well as among older Dutch men (IADLs and mobility), older Dutch women (ADLs and mobility), younger Italian men and women (IADLs and mobility), older French persons (IADLs) and French women (mobility). Finally, some borderline significant decreases among the Swiss can be observed; Swiss women aged 50–64 exhibit declines in GALI and IADLs, women aged 65+ in mobility and younger men in both GALI and mobility.
Controlling additionally in the models for the existence of at least one chronic condition (Model 2) changes in several instances the significance of the results, highlighting thus the important role they play in disability (lower panels of Figures 1–4; Table 5). The significant increases shown by the estimates for younger Germans nearly disappear. Further, among older Germans, all indicators except for IADLs show now a significant decline in disability. These findings imply that changes in chronic conditions are linked to the trends observed in Model 1; when these changes are accounted for (in Model 2) there are no longer any significant increases in disability, except for IADLs among younger women. Similarly, the significant increases observed among Belgians in Model 1 disappear. However, a few increases emerge which were not apparent before; younger French women exhibit now a significant increasing trend in GALI disability, as do younger Dutch males with respect to ADLs, older Spanish women with respect to IADLs and older Belgian women in mobility.
On the other hand, the declining trend among older Swedes remains significant, as it does among younger Austrians (mobility) and older Austrian males (GALI). The significant decreases in IADLs are maintained among Italian males but not among Italian females. Most significant and borderline significant estimates of declining trends among the Danes disappear, with the exception of those for women aged 65+, as do the borderline significant estimates concerning the Swiss. Finally, some significant declining trends emerge regarding Dutch males (GALI), older Dutch males (ADLs and IADLs) and older Dutch females (mobility).
Discussion
In the context of a potential increase in the numbers of older adults with functional limitations and activity restrictions in Europe and the consequent pressure that would exert on health-care systems, great interest has been developed recently in disability trends. Estimates for Europe, however, are rather scarce while in several cases where they may be available, the evidence is conflicting. Further, inconsistencies may arise, up to a certain extent, as a result of the different dimensions of disability captured by the various self-reported measures and the different rating scales involved (Cambois, Blachier and Robine Reference Cambois, Blachier and Robine2012; Jette Reference Jette1994). Hence, more empirical analyses are needed to appraise overtime changes in disability prevalence while comparative assessment of several indicators may provide a more robust evaluation of future trends. Within this framework, the present study uses cross-sectional data from Waves 1, 2, 4 and 5 of SHARE, covering the period 2004–2013, for the ten European countries that participated in all waves, to examine trends in the prevalence of functional limitations and activity restrictions by sex and broad age group, based on four well-established indicators of disability (ADLs, IADLs, GALI and mobility difficulties). At the same time, the role played by chronic conditions in these changes is investigated.
Based on past research, the analysis is expected to indicate an age-gradient for all disability measures, females to exhibit a higher prevalence than males in most instances and chronic diseases to be of great import (Arber and Cooper Reference Arber and Cooper1999; Gilmour and Park Reference Gilmour and Park2006; Jagger and Fouweather Reference Jagger and Fouweather2012; Moe and Hagen Reference Moe and Hagen2011; Parker et al. Reference Parker, Schön, Legergren and Thorslund2008). Further, it is expected that patterns by country may differentiate across indicators due to their specificities: ADLs and IADLs represent specific restrictions in activities concerning mainly the older old segment of the population and reflect moderate and severe disability (Parker and Thorslund Reference Parker and Thorslund2007); GALI encompasses both severe and mild activity restrictions which also might affect younger adults; mobility difficulties correspond to functional limitations which, however, do not necessarily lead to activity restrictions (Cambois, Blachier and Robine Reference Cambois, Blachier and Robine2012; Cambois et al. Reference Cambois, Clavel, Romieu and Robine2008).
Regarding estimates of trends in specific countries, there are divergences in several instances. Research examining disability in the USA has found a decline for all ages in the 1970s and in the 1980s (Crimmins, Saito and Ingegneri Reference Crimmins, Saito and Ingegneri1997; Freedman et al. Reference Freedman, Crimmins, Schoeni, Spillman, Aykan, Kramarow, Land, Lubitz, Manton, Martin, Shinberg and Waidmann2004; Manton and Gu Reference Manton and Gu2001). For the more recent period, however, there seems to be an increase but only among persons in mid-life. More specifically, Martin et al. (Reference Martin, Freedman, Schoeni and Andreski2010) and Martin and Schoeni (Reference Martin and Schoeni2014) found an increase in ADL and IADL dependency for the period 1997–2010 among individuals aged 40–64, though there was a decline among those aged 65+. A study by Freedman et al. (Reference Freedman, Spillman, Andreski, Comman, Crimmins, Kramarow and Lubitz2013) also indicates a modest increase in activity restrictions for persons aged 55–64 in the USA over 2000–2008, a flat trend for those aged 65–84 and a decline among those aged 85+. Similarly, Seeman et al. (Reference Seeman, Merkin, Crimmins and Karlamangla2010) suggest an increase in all types of disability (ADLs and IADLs) among persons 60–69, a lack of trend among 70–79-year-olds and an improvement in functional limitations among those aged 80+. For France, Cambois, Blachier and Robine (Reference Cambois, Blachier and Robine2012) also find an expansion in activity restrictions in the 2000s among persons aged 50–64, especially women, whereas among individuals aged 65+ there seems to be an increase in functional limitations but not in activity restrictions. Sulander et al. (Reference Sulander, Martelin, Sainio, Rahkonen, Nissinen and Uutela2006) and Moe and Hagen (Reference Moe and Hagen2011) examining trends in activity restrictions and functional limitations among Finnish persons (1993–2003) and Norwegians (1986–2008) aged 65+, respectively, have found a consistent decline. On the other hand, Parker, Ahacic and Thorslund (Reference Parker, Ahacic and Thorslund2005) suggest that in Sweden there was an increase in functional limitations (mobility) among persons aged 77+ in the period 1992–2002, though there was no significant change in ADL and IADL activity restrictions; further, Parker et al. (Reference Parker, Schön, Legergren and Thorslund2008) found an increase in ADL dependency among persons aged 65–84 over 1996–2005.
Τhe findings of the present study, based on the descriptive and the regression analysis, confirm the importance of age and sex as well as the crucial role of chronic conditions in disability. Trends in the period 2004–2013 differentiate by country and indicator. The age-adjusted results, which are roughly comparable to the above-mentioned studies, indicate increases in disability only in a few instances. More specifically, among Germans aged 50–64 there is a significant increasing trend which, however, is strongly related to changes in chronic conditions. On the other hand, older Germans exhibit significant declines both in GALI (activity restrictions) and mobility (functional limitations) which seem mostly independent of changes in chronic conditions. Belgians also show a worsening, especially in GALI activity restrictions, but these are again related to chronic conditions. Finally, older French males exhibit an increasing trend in GALI but improvements in IADLs (both sexes, ages 65+) and mobility (women only) which, again, seem mostly related to chronic conditions.
Decreases in disability are observed in several cases, The Swedes experience a significant decline in GALI and mobility and, among those aged 65+, in ADLs and IADLs as well; among younger respondents, however, these decreases seem linked to chronic conditions. The Danes also show significant decreases mainly linked to chronic conditions, as do the Swiss who, however, experience only borderline significant decreases. Some decreases, mainly in IADLs and mobility among younger respondents, are found for the Italians; most are linked again to changes in chronic conditions. Finally, older Dutch experience a decline in mobility difficulties, linked to chronic diseases; when these are controlled for, there are some declines in IADLs and an increase in ADLs among younger males.
Hence, though direct comparisons with the findings of past analyses are hampered by differences in the age groups examined, the differing periods under consideration and whether the analysis was carried out by gender, it would seem that the estimated improvement regarding Swedish persons contradicts past research showing increases in functional limitations (mobility) and ADLs. By contrast, the improvements among the Swedes and the Danes estimated by the current analysis seem in agreement with the declining trend in activity restrictions and functional limitations estimated for Finnish persons and Norwegians aged 65+ by Sulander et al. (Reference Sulander, Martelin, Sainio, Rahkonen, Nissinen and Uutela2006) and Moe and Hagen (Reference Moe and Hagen2011). Among the French, the current research showed an increase for males in GALI (linked to chronic conditions) and for women aged 50–64 (net of changes in chronic conditions). These results are quite similar to the findings of Cambois, Blachier and Robine (Reference Cambois, Blachier and Robine2012) who indicate that there was an expansion in activity restrictions in the 2000s among persons aged 50–64. On the other hand, the present analysis also found a decline in functional limitations among females (again linked to changes in chronic conditions) which contrasts with the estimates of Cambois, Blachier and Robine (Reference Cambois, Blachier and Robine2012) of an increase in functional limitations among individuals aged 65+.
Limitations of the study
Some limitations of the study should be noted. First, due to the self-reported nature of the measures used in the analysis, the robustness of the estimated associations relies upon accurate reporting on the part of the respondents. Second, as this is a cross-national study, self-reported measures of disability, and especially GALI which is based on a general question, may be affected by differential reporting across countries due to cultural perceptions about limitations. However, since the questionnaires of SHARE are harmonised whereas a binary construct has been used in the analysis the effects are likely to be minimal. Moreover, Jagger et al. (Reference Jagger, Gillies, Cambois, Van Oyen, Nusselder and Robine2010), analysing SHARE Wave 1 data, have found that the GALI indicator satisfactorily reflects poor functioning and disability in a similar manner across Europe. Third, reporting of chronic diseases may not be entirely reliable as accuracy often depends upon the condition itself (Goldman et al. Reference Goldman, Lin, Weinstein and Lin2003; Skinner et al. Reference Skinner, Miller, Lincoln, Lee and Kazis2005). Nevertheless, the binary indicator used in the analysis, which depends upon the respondent reporting at least one chronic condition, is likely to be affected the least.
Further, there are some issues related to the design of the survey. First, as the institutionalised population has been excluded from the sample, the prevalence of disability, especially among the older old, may be underestimated. However, if the level of under-reporting by country is roughly constant between the waves, this may not affect the estimated trends. Second, as response rates differentiate across countries, estimates may not be equally robust in all cases. For instance, trends for Switzerland, where non-response is quite substantial, may fail to reach significance due to the small sample sizes. Additionally, non-respondents are often less healthy than respondents; hence, the estimates may reflect trends related to healthier than average persons. Finally, though cross-sectional samples have been used in the study, attrition between the waves may affect estimates of trends if refresher samples are drawn based on criteria other than health. Nevertheless, use of non-response cross-sectional weights in the analysis is likely to minimise the above-mentioned problem.
Implications and conclusions
It is a fact that disability prevalence is greatest among the oldest old segment of the population, especially those aged 85+. Given the continuing decline in mortality and the fact that the baby-boom generations in Europe are at or nearing retirement age, a substantial increase in the numbers of disabled older persons in the future seems inevitable (Grundy, Tomassini and Festy Reference Grundy, Tomassini and Festy2006). It has been suggested, however, that prospective cohorts may have different characteristics which might alleviate somewhat the effects of an increase in their numbers. Most research indicates improvements in activity restrictions and functional limitations among the older old. Several studies, however, find a worsening in the more recent period, especially in mid-life activity restrictions. The present analysis indicates improvements both in mild/moderate activity restrictions and in functional limitations for several countries, especially among men and women aged 65+. Regarding severe disability (ADLs) there is mostly a lack of trend and only few significant declines. In several instances the observed trends are linked to changes in chronic conditions. Declines in disability net of chronic condition changes are found mainly in Sweden but also in the Netherlands, Austria, Germany, Italy and France.
Overall, the main conclusions of the study can be summarised as follows. First, there is diversity of trends between countries, some of which may arise from country-specific characteristics such as morbidity levels, health policies, etc. For instance, a more generous and efficient health-care system may help reduce the incidence of activity restrictions through promotion of medical intervention and assistive technology, whereas in Southern European countries, family support networks may serve to alleviate the ‘feeling’ of being limited in activities. Second, there are differentiations in the estimated trends dependent upon the specificities of the measures used in the analysis; hence, it is of import to examine several disability indicators concurrently in order to reach firm conclusions. Third, chronic conditions often represent the driving force behind changes in disability prevalence and need to be taken into account to derive ‘net’ disability trends. Finally, trends often differ between genders as well as between younger and older persons; hence, population sub-groups should be considered separately.
As disability trends present variability across European countries, additional cross-disciplinary and cross-national investigation is required to obtain a more complete picture of likely changes and to assess consequences. In this way it will be possible to formulate appropriate policies and interventions to support this vulnerable segment of the population and to plan more efficiently for the future.
Acknowledgements
This paper uses data from SHARE Waves 1, 2, 4 and 5 (doi: 10.6103/SHARE.w1.260, 10.6103/SHARE.w2.260, 10.6103/SHARE.w4.111, 10.6103/SHARE.w5.100, respectively); see Börsch-Supan et al. (Reference Börsch-Supan, Brandt, Hunkler, Kneip, Korbmacher, Malter, Schaan, Stuck and Zuber2013) for methodological details. The SHARE data collection has been primarily funded by the European Commission through FP5 (QLK6-CT-2001-00360), FP6 (SHARE-I3: RII-CT-2006-062193, COMPARE: CIT5-CT-2005-028857, SHARELIFE: CIT4-CT-2006-028812) and FP7 (SHARE-PREP: N°211909, SHARE-LEAP: N°227822, SHARE M4: N°261982). Additional funding from the German Ministry of Education and Research, the US National Institute on Aging (U01_AG09740-13S2, P01_AG005842, P01_AG08291, P30_AG12815, R21_AG025169, Y1-AG-4553-01, IAG_BSR06-11, OGHA_04-064) and from various national funding sources is gratefully acknowledged (see www.share-project.org). Further, the European Union provided partial funding to the present study through the co-funded programme of ‘Thalis – Panteion – Investigating Crucial Interdisciplinary Linkages in Ageing Societies’ which is part of the Operational Programme of ‘Education and Lifelong Learning’ (MIS380266). Finally, the authors would like to thank two anonymous referees for their constructive criticism and help in improving this paper. No statement of ethical approval is required.
Appendix 1: Questions and items comprising functional limitations, activity restrictions and chronic conditions in SHARE
Mobility difficulties
Because of a physical or health problem, do you have difficulty doing any of the activities on this card? Exclude any difficulties you expect to last less than three months.
-
• Walking 100 metres.
-
• Sitting for about two hours.
-
• Getting up from a chair after sitting for long periods.
-
• Climbing several flights of stairs without resting.
-
• Climbing one flight of stairs without resting.
-
• Stooping, kneeling or crouching.
-
• Reaching or extending your arms above shoulder level (either arm).
-
• Pulling or pushing large objects like a living room chair.
-
• Lifting or carrying weights over 10 pounds, like a heavy bag of groceries.
-
• Picking up a 5p coin from a table.
Activities of daily living
Here are a few more everyday activities. Please tell me if you have any difficulty with these because of a physical, mental, emotional or memory problem. Again exclude any difficulties you expect to last less than three months.
-
• Dressing, including putting on shoes and socks.
-
• Walking across a room.
-
• Bathing or showering.
-
• Eating, including cutting up your food.
-
• Getting in or out of bed.
-
• Using the toilet, including getting up or down.
Instrumental activities of daily living
-
• Using a map to figure out how to get around in a strange place.
-
• Preparing a hot meal.
-
• Shopping for groceries.
-
• Making telephone calls.
-
• Taking medications.
-
• Doing work around the house or garden.
-
• Managing money, such as paying bills and keeping track of expenses.
Chronic conditions (Wave 5)
Has a doctor ever told you that you had any of the following conditions?
-
• A heart attack including myocardial infarction or coronary thrombosis or any other heart problem including congestive heart failure.
-
• High blood pressure or hypertension.
-
• High blood cholesterol.
-
• A stroke or cerebral vascular disease.
-
• Diabetes or high blood sugar.
-
• Chronic lung disease such as chronic bronchitis or emphysema.
-
• Cancer or malignant tumour, including leukaemia or lymphoma, but excluding minor skin cancers.
-
• Stomach or duodenal ulcer, peptic ulcer.
-
• Parkinson's disease.
-
• Cataracts.
-
• Hip fracture.
-
• Other fractures.
-
• Alzheimer's disease, dementia, organic brain syndrome, senility or any other serious memory impairment.
-
• Other affective or emotional disorders, including anxiety, nervous or psychiatric problems.
-
• Rheumatoid arthritis.
-
• Osteoarthritis, or other rheumatism.
Appendix 2
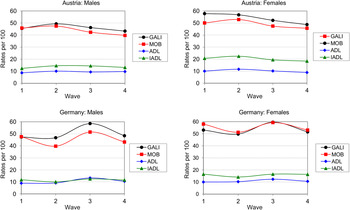
Figure A1. Age-standardised prevalence rates of disability for males and females across four Survey of Health, Ageing and Retirement in Europe (SHARE) waves (2004–2013) by indicator: Austria and Germany.
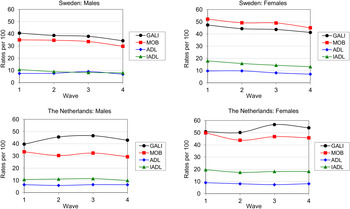
Figure A2. Age-standardised prevalence rates of disability for males and females across four Survey of Health, Ageing and Retirement in Europe (SHARE) waves (2004–2013) by indicator: Sweden and the Netherlands.
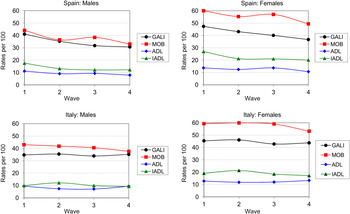
Figure A3. Age-standardised prevalence rates of disability for males and females across four Survey of Health, Ageing and Retirement in Europe (SHARE) waves (2004–2013) by indicator: Spain and Italy.
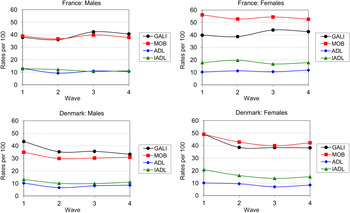
Figure A4. Age-standardised prevalence rates of disability for males and females across four Survey of Health, Ageing and Retirement in Europe (SHARE) waves (2004–2013) by indicator: France and Denmark.
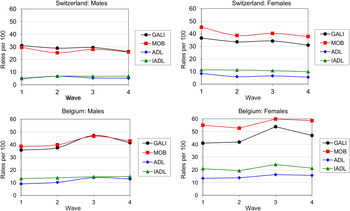
Figure A5. Age-standardised prevalence rates of disability for males and females across four SHARE waves (2004–2013) by indicator: Switzerland and Belgium.


