

Over the last ten years the phenomenon of electoral violence has gained considerable attention from policymakers, practitioners, and academics. Slowing evolving from a phase in which experts struggled with defining electoral violence as a distinct form of political violence that requires its own investigation (Fischer 2002), this field of study has now produced many works investigating the underlying rationale, dynamics, and consequences of electoral violence (e.g., Hoglund Reference Hoglund2009; Bekoe Reference Bekoe2012; Hafner-Burton et al. Reference Hafner-Burton, Hyde and Jablonski2013; Burchard Reference Burchard2015). This article continues in this vein by examining the effects of pre-election violence on the most important stakeholders, the voters.
Electoral violence is distinguished from the broader field of political violence in terms of its timing, motivation, and targets. While acts of political and social violence in sub-Saharan Africa are committed for a wide range of motives, electoral violence, even if it occurs simultaneously with other types of violence, has the particular purpose of attempting to harm or otherwise affect stakeholders—such as candidates and voters—ahead of or after an election. Two concrete examples from Tana River District, Kenya, illustrate the difference. In August and September 2012, five months before general elections, clashes between the Pokomo and Orma resulted in one hundred deaths. While the two ethnic groups had clashed before, the intensity of these clashes was higher than in the past. The difference between the clashes in 2012 and other outbreaks of violence, many experts agreed, was the upcoming election for newly created county seats. Orma and other groups were vying to oust the Pokomo, a minority group, from dominating political representation (The Africa Report 2012; International Crisis Group 2013). In contrast, another violent incident in Tana River which occurred in January 2013 a few months prior to the election, in which a mob killed a man suspected of stealing chicken, clearly was not tied to the election—although one might argue that it reflected the paucity of government-provided security.
Of course, political violence can occur at any time during an electoral cycle. However, the data suggest sharp spikes in the period immediately before or after an election. In sub-Saharan Africa, electoral violence, ranging from low-level intimidation to intense, protracted conflict, took place in approximately 55 percent of elections held between 1990 and 2014 (Burchard Reference Burchard2015). Forty-one of forty-eight states have some experience with electoral violence. Most of this violence—95 percent—took place before the election; only 5 percent of the violence took place after the election (Straus & Taylor Reference Straus, Taylor and Bekoe2012). A sample from the Armed Conflict Location and Event Data (ACLED) of election-related violence from 1997 to 2014 in three countries that have experienced electoral violence of varying intensity—Kenya, Togo, and Ghana—shows this trend (see figure 1). Footnote 1 In each of the three countries, the average number of incidents was greater in election years than nonelection years, although the magnitude of the difference was much greater in Kenya, a country that routinely experiences intense conflict around elections.
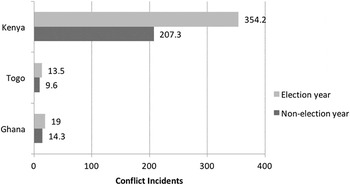
Figure 1. Average Conflict Incidents in Election versus Non-election Years, 1997–2014
Source: Armed Conflict Location and Event Data (ACLED) Project, Africa data, version 5 data, 1997–2014 (www.acleddata.com)
In the case of Kenya, upon which we will elaborate upon below, the data show a steep rise in incidents just before elections—in 1997, 2002, 2007, and 2013—and a precipitous decline afterward (see figure 2). It is this trend—spiking political violence during election years, its abrupt decline in nonelection years, and its clear dominance in the pre-election period—that led us to examine whether violence just preceding an election has a distinct effect on the characteristics of the election and the voters.
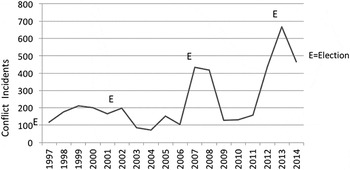
Figure 2. Conflict Incidents in Kenya, 1997–2014
Source: Armed Conflict Location and Event Data (ACLED) Project, Africa data, version 5 data, 1997–2014 (www.acleddata.com)
Recent research indicates that, at least in the case of incumbents, violence is frequently used as a strategy when a politician is uncertain about the likelihood of victory or fears the loss of a political position, particularly in an environment of weak institutions and few consequences of violence (Hafner-Burton, Hyde, & Jablonski Reference Hafner-Burton, Hyde and Jablonski2014). The dominance of pre-election violence, in particular, indicates that the purpose of the violence is to influence the election through intimidation, harassment, assassinations, or other large-scale acts of aggression. In certain cases pre-election violence has resulted in a politician’s withdrawing from the contest (e.g., Morgan Tsvangirai in Zimbabwe 2009) or a boycotting of the election by the opposition party (e.g., in Burundi in 2010)—mostly to the benefit of the party most responsible for the violence. Beyond these national-level effects, however, the influence of electoral violence—and specifically, the effect of pre-election violence on voter turnout—has been unclear.
Low voter turnout is routinely seen as an indicator of a number of problems, including low acceptance of democratic principles, poor legitimacy of an election, the failure of elected officials to connect with constituents, the electorate’s disappointment with the political class, and a general disenfranchisement of the electorate (Birch 2010; Stockemer & La Montagne 2013). But the working assumption by the policy and academic communities is that voter turnout is particularly negatively affected by pre-election violence. Indeed, the possibility of lower voter turnout in the face of pre-election violence is one of the driving factors behind the new electoral security framework developed by the U.S. Agency for International Development (USAID). USAID’s 2010 Electoral Security handbook asserts that voter turnout is suppressed when insurgents delay or discredit an election; when candidates attempt to “capture an election”; when political parties boycott the polls; or as a direct consequence of electoral violence. Similarly, the United Nations Development Program’s Elections and Conflict Prevention Guide states that voter turnout may be decreased by the use of violence by political parties or armed groups in order to ensure a particular outcome (UNDP 2009). Scholars also assume that voter turnout is generally negatively affected by electoral violence: Höglund (2009:412) states that “voter turnout may be influenced if large sections of the population refrain from casting their vote due to fear of violence.” Individual case studies of Nigeria’s 2007 election also start from an assumption that violence affects voter turnout (Bratton Reference Bratton2008; Collier & Vicente, Reference Collier and Vicente2011). Thus, from a policy as well as an academic perspective, there is a notion that violence can lead to fewer people showing up at the polls.
Despite the policy focus and the scholarly inclination to view pre-election violence as a suppressant of voter turnout, it has not been clear how—or even if—this takes place. Politicians and political parties have various motivations for employing electoral violence, and violence is often directed toward affecting the results of the election, not in suppressing voting per se. In Zimbabwe’s 2008 election, for example, violence was used to punish opposition supporters, as well as to persuade people to vote for the ruling party (Human Rights Watch 2008). In Ethiopia’s 2010 election, many were intimidated into voting for the government (Human Rights Watch 2010). In Kenya, as we will show, violence was also used to turn out voters. Therefore, the data need to be looked at more closely to determine the motivations and effects of pre-election violence. This article seeks to understand exactly how pre-election violence—which also includes election day violence—affects voter turnout. The article is based on an examination of cross-national time series data from forty-seven African countries from 1990 to 2013. The case of Kenya, which has a particularly dramatic history of electoral violence, is used to provide a richer context for understanding the motivation and impact of pre-election violence.
Voter Turnout and Pre-election Violence
Several studies have sought to explicitly define electoral violence and have examined its roots and proximate causes (see, e.g., Laakso Reference Laakso, Basedau, Erdmann and Mehler2007; Hoglund Reference Hoglund2009; Bekoe Reference Bekoe2012; Straus & Taylor Reference Straus, Taylor and Bekoe2012). Under a democratic system in which political participation is voluntary, voter turnout is the sum effect of citizen involvement in the formal exercise that selects a country’s political leadership. According to the latest data from the International Institute for Democracy and Electoral Assistance (International IDEA; www.idea.int), average voter turnout in Africa is 65 percent. High voter turnout generally reflects an energized constituency that sees value in the effort required to cast a ballot, while low voter turnout may reflect a paucity of electoral options or low interest in the outcome of the election. Low voter turnout may also be an indicator of a lack of confidence in the electoral process or even waning regime legitimacy, when voters choose to refrain from participating in an exercise in which they believe they will have little effect (Karp & Banducci 2008; Birch Reference Birch2010). Some (e.g., USAID 2013) argue that low voter turnout signals trouble in a young and/or fragile democracy and that electoral violence is a direct cause. Unfortunately, however, in this context the meaning of voter turnout is particularly difficult to interpret. Countries transitioning to democracy from authoritarian regimes may not have the necessary safeguards in place to ensure a free or fair vote, and in some cases turnout can be coerced and artificially inflated.
There are certainly cases of countries where persistent electoral violence seems correlated with voter turnout that is lower than the continent’s average. In Nigeria’s 2011 parliamentary and presidential elections, voter turnout was 29 percent and 54 percent, respectively. In Zimbabwe voter turnout in the 2008 parliamentary and presidential elections was 41 percent and 42 percent, respectively. In Comoros the 2010 presidential election generated 52.8 percent turnout. Elections in all three countries are typically extremely violent, resulting in hundreds of fatalities. Conversely, countries that generally hold free, fair, and peaceful elections have seen higher-than-average turnout. These include Ghana, where the 2012 presidential and parliamentary elections generated an 80 percent turnout; Botswana, where the 2009 parliamentary election resulted in a 74 percent turnout; and Mauritius, where 75 percent of the registered voters turned out for the 2010 parliamentary election.
But there are several surprising cases as well. Voter turnout in Mali, long lauded as a beacon of democracy before the March 2012 coup d’état, has not surpassed 38.2 percent since the start of its democratization process in 1996—and it does not have a history of pre-election violence. Meanwhile, Ethiopia’s 2010 parliamentary elections saw a rise in voter turnout from 83 percent in 2005 to 93 percent in 2010, but in between the two elections voters were subjected to high levels of repression. Reports by Human Rights Watch (2010) indicate that civil servants, private citizens, and other voters were pressured into voting for the ruling EPRDF (Ethiopian People’s Revolutionary Democratic Front) in 2010 for fear of their lives, jobs, or reputation. In Ethiopia, it seems, pre-election violence resulted in an increase in voter turnout.
The question of why notably peaceful elections can generate low voter turnout and notably violent elections can generate high voter turnout is one of the puzzles driving this study. In the previous scholarship, only two case studies, both about the 2007 election in Nigeria, explicitly examined the question of whether pre-election violence affects voter turnout. Michael Bratton’s 2008 study measuring the impact of the threat of violence on the intention to vote in that election concluded that threats of violence decrease the likelihood that individuals will vote. Paul Collier and Pedro Vicente’s 2011 study investigated the effects of an antiviolence pre-election campaign conducted by the international NGO Action Aid International Nigeria (AAIN) by comparing levels of voter turnout in the areas exposed to the campaign and those outside the program area. Like Bratton, they found that the voters threatened with violence were less likely to vote. However, voters who had been exposed to violence but were also the recipients of the AAIN anti-violence campaign were more likely to vote; their numbers in aggregate were 7 percent higher in the presidential campaign and 11 percent higher in the gubernatorial elections.
The studies of Nigeria therefore confirm the intuition that electoral violence may lead to reduced voter turnout—although the Collier and Vincente study suggests some possible mitigating factors. But a question remains as to whether there is any basis for generalizing these results to the rest of Africa. In order to investigate this question, we conducted a three-part study. First, using the African Election Violence Database (AEVD) (Straus & Taylor Reference Straus, Taylor and Bekoe2012), which categorizes all presidential and parliamentary elections held from 1990 to 2008, we looked at the impact of electoral violence on voter turnout across sub-Saharan Africa since the beginning of the so-called Third Wave of democracy. Next, we focused specifically on Kenya, which is distinguished by the variability in electoral violence: while 1992, 1997, and 2007 elections experienced intense violence, others have experienced considerably less. Finally, we looked closely at the motivations behind the violence during Kenya’s elections for further understanding of the empirical results and to uncover the effects of violence on voters.
AEVD-Based Data Analysis
Our primary motivation was to examine how pre-election violence affects voter turnout. We began our analysis with the assumption that instigators of violence use it to deter participation due to the simple fact that voting becomes more cumbersome when the threat of violence looms overhead. The Zimbabwean elections fit well with this assumption, as it is believed that the incumbent party used violence against opposition supporters in order to prevent them from participating, and hence, ensuring electoral victory for ZANU-PF. Following this logic, we hypothesized that pre-election violence should deter participation and therefore decrease turnout. Our hypotheses were as follows:
H 1: Electoral violence that takes place before an election will lead to lower voter turnout on election day, ceteris paribus.
H 0: Electoral violence that takes place before an election will have no effect on voter turnout on election day, ceteris paribus.
We tested our hypothesis using multiple methods and different levels of data, building upon the innovative AEVD assembled by Straus and Taylor (Reference Straus, Taylor and Bekoe2012). Footnote 2 For the years 1990–2008, Straus and Taylor coded the level of violence that took place during the six months prior to an election and the three months after an election for each election conducted in sub-Saharan Africa according to four categories: (1) 0 for cases in which no violence occurred; (2) 1 for cases in which voter intimidation and harassment occurred; (3) 2 for cases in which violent repression, including political assassinations and fatalities, occurred; and (4) 3 for elections in which large-scale violence took place with at least twenty reported fatalities. Using the same coding scheme, we were able to update their dataset to cover elections that were held through 2014.
For the purposes of our analysis we collapsed their four categories into a dummy variable where 1 corresponds to violent elections (categories 1, 2, and 3) and 0 corresponds to nonviolent elections (category 0). Footnote 3 We did this because we argue that any type of violence (harassment, intimidation, etc.) has the potential to influence voter behavior, and in fact, it is oftentimes meant to do just that. However, in order to address the concern that the severity of electoral violence could also have an impact on voter turnout, we conducted all analyses using both our binary treatment and Straus and Taylor’s original coding schema, which treats electoral violence as an ordinal level variable.
The number of elections per country varied in the study, depending on how many elections the country held during the time period. Some countries held only two elections from 1990 to 2014 (Angola, Rwanda), but others held as many as eight elections (Madagascar, Togo). Our data set contained a total of 287 observations or elections in forty-seven countries. Footnote 4 We collected data on voter turnout from a variety of sources including the African Elections database (http://africanelections.tripod.com), the International Foundation for Electoral Systems (www.electionguide.org), and Lindberg’s (2006) “Dataset on African Elections.” We also collected data on specific electoral institutions from various sources including the African Elections database, the Inter-Parliamentary Union database, and International IDEA. We conducted separate analyses of legislative voter turnout (including both singular and concurrent elections, for a total of 191 elections) and executive voter turnout (again, including both singular and concurrent elections, for a total of 166 elections). In our sample, average voter turnout in Africa for presidential and legislative elections was nearly the same: 66 percent and 63 percent, respectively.
Table 1 reports average voter turnout by election type and incidence of electoral violence. These data come from the pooled data set that includes all elections in all countries with available data. The differences in average turnout are not statistically significant.
Table 1. Voter Turnout and Violence, Pooled Sample

Complicating our data analysis was the fact that some countries in our sample have always had violent elections (Kenya, Zimbabwe) and some countries have never had violent elections (Botswana, São Tomé and Príncipe). In these cases there is no variation in the key independent variable, so absence or presence of violence cannot explain variation in voter turnout over time. Our solution was to perform an isolated analysis of countries that do demonstrate variance in the absence or presence of electoral violence over time. This removed approximately 40 percent of the countries in our sample (19) and left us with data from twenty-eight countries to examine.
Table 2 reports voter turnout by type of election and whether violence took place before the election or not for our isolated sample. While turnout was on average lower in legislative elections where violence occurred, the difference is not statistically significant. Based on this descriptive analysis, thus far there appears to be no significant difference in voter turnout between violent elections and nonviolent elections.
Table 2. Voter Turnout and Violence, Isolated Sample

In addition to performing descriptive analysis, we tested our main hypothesis using generalized least squares (GLS) regression analysis on our isolated sample. The distribution of voter turnout, our dependent variable, ranged from 19.4 to 92.3 with a mean of 59.1 percent for legislative elections, and from 23.6 to 93.8 with a mean of 64.3 percent for presidential elections. Both conform well to a normal distribution. Due to the structure of our data set—unbalanced short panel data, as we have elections nested within countries and variations in number of elections per country—we had to address dependency within panels/countries (Gelman & Hill Reference Gelman and Hill2006). We estimated the effect of electoral violence on voter turnout in “Election i” in “Country j” using the following multilevel model:
Voter Turnout ij = α + β1ElectoralViolence ij + β2X ij + µ i + ε ij
(where X ij is a vector of control variables discussed below and µ i are country-random effects).
Including random effects in our model allowed us to account for unspecified country-level effects that could potentially bias our estimates.
We ran several regression analyses with voter turnout as our dependent variable and election violence as our key independent variable. To identify the relevant control variables, we relied specifically on the literature on voter turnout and African voters. Much of the broader literature on voter turnout focuses on how institutional, political, and socioeconomic factors affect voter turnout (Blais Reference Blais2006; Geys Reference Geys2006). Proportional electoral institutions are generally found to increase voter turnout, whereas plurality/majoritarian electoral institutions tend to decrease it (Banducci & Karp Reference Banducci, Karp and Klingemann2009). We determined electoral system using a categorical variable, where the values 1–4 correspond to plurality, majoritarian, mixed, and proportional representation electoral rules, respectively.
Competitiveness of previous elections, also believed to affect voter turnout in a current election, is generally included in most models; however, our sample included many instances of countries holding elections at irregular intervals due to conflict. Thus, relying on the previous election’s competiveness is not always appropriate or indicative of how competitive a subsequent election will be. Some studies include electoral competition (generally measured as margin of victory) in the current election as a predictor of turnout. But a serious endogeneity problem arises from including data on both competition and turnout from the same election, because turnout may be driving competiveness and not the other way around (Geys Reference Geys2006). We were unable to identify an appropriate and independent measure of competitiveness. We did control for the participation of an incumbent executive or political party in the election (dummy variable) in an attempt to capture, in the abstract, voter interest and competitiveness of the election. We did this based on the assumption that when incumbents run for re-election, voter interest and the competitiveness of the election are affected, both of which indirectly affect turnout.
We also included controls to capture the openness of the political environment. The nongovernmental organization Freedom House (FH) (https://freedomhouse.org) and the Polity Project of the Center for Systemic Peace (www.systemicpeace.org) are the two data sources most frequently used as measures of the openness of the political environment. Freedom House scores measure the freeness of the political system with regard to civil liberties and political rights. Freedom House scores range from 1 (free) to 7 (not free). Polity scores measure the level of openness of electoral contestation in a country in a given year. Polity scores range from –10 (pure autocracy) to 10 (pure democracy). Each measure has its own strengths and weaknesses, but because of the high correlation between these scores, they cannot be used in the same model. We ran separate models using each as a measure of the openness of the political environment.
Turning to the literature on voter turnout in Africa more specifically, we relied on the foundational work of Michelle Kuenzi and Gina Lambright (2011). They discovered that in sub-Saharan Africa, voters in rural areas tend to turn out in higher numbers than their urban counterparts, contrary to the findings of many studies conducted in Western countries. They also found that older people tend to vote more frequently, which does conform to much of the literature on socioeconomic factors affecting voter turnout. Therefore, we included country-level measures for percent of urban population and “youth bulge,” which measures the percentage of the population that is under the age of fifteen. These data came from the World Bank’s African Development Indicators database (http://data.worldbank.org).
To summarize, we ran separate random effects GLS regressions for executive and legislative turnout with controls for electoral system, type of election (singular or concurrent), political climate (FH scores and Polity scores), and socioeconomic status (age and urbanization of the country’s population). Footnote 5 Table 3 reports the coefficients for our models. As noted above, models could not include the FH and Polity scores simultaneously and were therefore separated.
Table 3. Voter Turnout in Kenya, 2007

In all model specifications, the coefficient for violence was negative but insignificant (we report p-scores for electoral violence to highlight this point). In none of the models did it come close to reaching significance. In both types of elections the “youth” bulge was significant and negative, meaning that countries with younger populations overall have lower than average voter turnout rates compared to countries with older populations. In executive elections, incumbent participation was significant and positive (for one of the models), meaning that when an incumbent executive runs for re-election, voter turnout increases. This may reflect intense mobilization efforts that incumbent presidents undertake, in part due to their access to state resources. For legislative elections, this finding was inconsistent across our two measures of political environment. Based on our cross-national analysis, election violence does not appear to affect voter turnout in the aggregate.
The Kenyan Case
To understand why pre-election violence may not necessarily affect voter turnout in the aggregate, we turned to an in-depth study of Kenya’s 2007 elections. In Kenya, all elections in the multiparty era have been marred by pre-election violence, although there has been variation in intensity and not all regions or constituencies have been equally affected. We chose to focus on the 2007 elections because by 2007, the year of Kenya’s fourth elections, constituents had enough time to build up a memory of previous elections and the behavior of politicians, and also to acquire some perspective on the limits on their freedom as voters, if any such limits existed. We also chose to focus on the 2007 elections because since the 2002 elections had seemed relatively free of the ethnically fueled violence of the previous polls (Prunier Reference Prunier2008), by 2007 many analysts considered that Kenya had “turned the corner” on violent elections. Thus international scrutiny, which may possibly regulate politicians’ behavior, was less. The postelectoral violence of 2007, therefore, took the international community by surprise.
In 2007 Kenya was administratively subdivided into 210 constituencies nested within sixty-eight districts within eight provinces. We collected data on pre-election violence from the Armed Conflict Location and Event Database (ACLED), which is reported at both the district level and the constituency level. Footnote 6 We analyzed constituency-level election data and aggregated and averaged this data at the district level to capture district-level trends. Footnote 7 We found that of Kenya’s 210 constituencies, sixty-four (30.4%) had reports of violence before the election. Of Kenya’s sixty-eight districts, thirty-one (45.6%) experienced some form of pre-election violence. Table 4 summarizes our results. In the 2007 election average turnout for constituencies that experienced pre-election violence was 69.3 percent; in constituencies that did not experience pre-election violence turnout was on average 70.6 percent. The difference is not statistically significant. At the district level the difference is also not statistically significant.
Table 4. GLS Regression Estimates, Random Effects Models

FH = Freedom House
*Significant at 10%
** Significant at 5%
*** Significant at 1%
Because the 2007–2008 election violence can be considered a rare event in terms of the magnitude and scope of typical election violence, we also examined how a district’s history of election violence in previous contests may have affected 2007 voting behavior. Using ACLED data from the six-month period before the 1997 and 2002 elections (corresponding to the Straus and Taylor timeline), we were able to determine whether districts that had a history of election violence before either of the previous elections exhibited lower rates of voter turnout than districts that had no such experience before 2007. Footnote 8 Of Kenya’s sixty-eight districts, 35.3 percent (24) had not previously experienced election-related violence before the 2007 polls. Both the 1997 and 2002 elections took place within these districts—also without violence. For districts that had a history of election violence before the 2007 election, voter turnout in 2007 was 68.9 percent; the twenty-four districts that did not have a history of pre-election violence averaged 72.4 percent voter turnout. This difference is also not statistically significant.
Finally, in order to further test the robustness of this finding, we examined whether pre-election violence had any demonstrable effect on turnout in the 2007 election compared to turnout in the previous election. For constituencies that experienced pre-election violence in 2007, turnout was on average 11.1 percent higher than in the previous contest in 2002. For constituencies that did not experience pre-election violence ahead of the 2007 election, turnout was on average 11.3 percent higher than in 2002. Therefore, the examination of voter turnout cross-nationally and subnationally did not suggest a significant effect of electoral violence on voter turnout in the aggregate. To explore why this might be the case, we turned to the purposes of pre-election violence across Kenya’s five multiparty elections from 1992 to 2013.
Motivations for Pre-election Violence in Kenya
Overall, we found that pre-election violence has been employed in Kenya for a variety of motivations, each based on a specific political and electoral context. In some cases, violence was a mechanism for suppressing voters; in others, it scared people into voting; and in still others, it punished the vote choice of the previous election. In other words, the meaning of electoral violence varied according to the perpetrators, the voters, the time in the electoral cycle, and domestic and international considerations. As the summaries below show, voters seemed to know what message was being sent and responded in various ways: they fled, they ignored the message, or they voted in large numbers.
1992 Elections
The violence associated with Kenya’s first multiparty elections was meted out in three phases. President Daniel arap Moi was a reluctant convert to democracy. He warned that democracy would only bring chaos and violence as Africans would resort to defending their tribal roots. As if to underscore his point, starting in October 1991, nearly one year before the polls, hundreds of people—mostly in Rift Valley—were killed in ethnic clashes between mainly the Kalenjin (Moi’s ethnic group) and Kikuyu (Klopp & Zuern Reference Klopp and Zuern2007). The clashes started as Kalenjin attacks on Luos, but grew to include many other non-Kalenjin. These ethnic clashes, which were revealed to be supported by Moi, aimed to drive home the danger of ethnic violence that could result from multiparty elections (Foeken & Dietz Reference Foeken, Dietz, Abbink and Hesseling2000; Klopp Reference Klopp and Bekoe2005; National Council of Churches of Kenya 1992). Following a November 1991 decision by the Paris-based Consultative Group for Kenya to suspend future donor assistance until political reforms took place, Moi acquiesced, and a date was set for the elections (Barkan Reference Barkan1993).
As the country prepared for elections, the ethnic clashes between Kalenjin and non-Kalenjin continued. The opposition charged the government with attempting to disrupt communities in order to win the elections. Field interviews by Human Rights Watch revealed that the clashes were an attempt to punish opposition supporters and force them to support the KANU government. In March 1993, the most violent point of the clashes, Human Rights Watch reported that “Kalenjin Assistant Minister Kipkalia Kones declared that Kericho District was a KANU zone and added that anyone who supported the political opposition would ‘live to regret it’” (1993:29). According to another report, the Kalenjin accepted Kikuyu surrender at Chepakundi in Nakuru District when “they were made to raise a fistful of grass in the air and say ‘KANU juu’ [up with KANU]” (Human Rights Watch 1993:34). By September 1992, three months before the elections, the violence had generated non-Kalenjin retaliatory attacks and killed nearly eight hundred people and displaced fifty-six thousand families (Human Rights Watch1993). The turnout for these first elections was 59 percent for the parliamentary election and 66.8 percent for the presidential elections. Some of the voters, one can argue, turned out and voted for KANU because of the fear caused by the clashes.
1997 Elections
The next elections, held in 1997, were also preceded by violence, although it was less intense than in 1991–93. Once again, the violence was linked to political leaders (Human Rights Watch 2002). In the first six months of 1997 opposition leaders and civil society were routinely harassed and intimidated (Barkan & Ng’ethe Reference Barkan and Ng’ethe1998). As in 1993, ethnic clashes erupted, this time in Coast Province, although some clashes occurred again in Rift Valley (Barkan & Ng’ethe Reference Barkan and Ng’ethe1998; Article 19, 1998). The intended ethnic targets were also the same: Kikuyus who were perceived to benefit more than other groups (Human Rights Watch 2002). In Coast Province, armed groups took their inspiration from the 1993 violence in the Rift Valley, saying explicitly, “It was already known from the Rift Valley how to chase people out—by clashes—so it was copied” (Human Rights Watch 2002). From August 1997, when the clashes began, until November, more than one hundred people were killed and one hundred thousand displaced (Human Rights Watch 2002). The goal of the violence seemed two-fold: to chase out Kikuyu and other “outsiders” in order to get local land back and to warn those who did not support the Kenya African National Union (KANU)—presumably Kikuyu, along with other minority groups—that they would meet a bitter end. Human Rights Watch (2002) reported that “a local councilor, of the ruling KANU party, . . . incited violence against up-country residents by warning that up-country people who supported the opposition in the upcoming election would be attacked as in Molo, Rift Valley Province, with ‘arrows in their backs.’” Moi was reelected president, and there was a higher voter turnout than in 1993: 85 percent for the presidential election and 64 percent for the parliamentary election.
2002 Elections
Compared with the elections of 1992 and 1997, violence in 2002 was minimal—although it was still present. There were clashes between the KANU and the National Alliance Rainbow Coalition (NARC) supporters, which resulted in many fatalities and injuries; targeted shooting of a parliamentary candidate in Nakuru; the killing of a journalist in Isiolo (Eastern Province); the killing in Nairobi of three staff members of the campaign of Fred Gumo, a NARC candidate; and multiple clashes with police (Amnesty International 2002; Astill Reference Astill2002). In contrast with the previous elections, the violence in 2002 appears to have been less systematic. The killing of political candidates seemed aimed at reducing competition—perhaps removing incentives for the supporters of those candidates to vote. Unlike the 1992 and 1997 elections, therefore, the motivation was to inflict injury on supporters of opposition parties, rather than dislocate or eliminate potential supporters among the voting public.
Having won the previous two electoral contests, Moi was barred by term limits from running in 2002. His choice for KANU’s presidential candidate was Uhuru Kenyatta. NARC, a coalition of fifteen political parties, worked to defeat Kenyatta. NARC’s presidential candidate, Mwai Kibaki, won the presidential election with 61 percent against Kenyatta’s 31 percent (Ndegwa Reference Ndegwa2003). In this relatively peaceful election, voter turnout was lower than in 1997—57 percent for both the presidential and parliamentary polls.
2007 Elections
Most of the violence connected to the elections of December 2007, which pitted Raila Odinga (a Luo) against Mwai Kibaki (a Kikuyu), occurred a month later, when approximately fifteen hundred people were killed and six hundred thousand displaced in postelectoral violence. By contrast, the lead-up to the elections was relatively peaceful. In the month before the elections, forty-one deaths were recorded, and of these, twenty-five occurred during campaign rallies (mostly in Molo district, which has a history of electoral violence) (Dercon & Gutiérrez-Romero Reference Dercon and Gutiérrez-Romero2012). This relatively low number of incidents is perhaps a reason that 98 percent of the 1,207 respondents in a survey conducted by Dercon and Gutiérrez-Romero one month before the elections indicated that they intended to vote (even though 50% were afraid that electoral violence would affect their communities).
The relatively low number of casualties, however, masks the planning that occurred prior to the elections. The Commission of Inquiry into the Postelection Violence (CIPEV, also known as the Waki Commission) found, for example, that Kikuyu were warned that they would be chased out of their communities if the elections did not result in a win by Raila Odinga and also that some Kikuyu families had left their region by election day (CIPEV 2008). Turnout for the presidential and parliamentary elections was 69 percent. As in the previous elections, some chose not to vote due to fear, while others might have been persuaded to vote to avoid violence.
2013 Elections
The March 2013 elections were notable in several respects. First, they took place under the framework of the new Kenya Constitution. This replaced the eight provinces with forty-seven counties in a bid to further devolve government; increased the number of parliamentary seats from 210 to 290, with the inclusion of a women’s representative and a senator from each county and other nominated representatives; and increased the number of elected positions by creating assemblies in each of the counties. In all, there were a total of 1,882 elected positions. Equally significant, the violence of the 2007 elections overshadowed nearly all aspects of the 2013 campaign. The leading presidential and vice-presidential candidates, Uhuru Kenyatta and William Ruto, had been indicted by the International Criminal Court as organizers of the 2007 postelectoral violence; international and national entities closely monitored hate speech and the election’s preparations; and the National Cohesion and Integration Commission had been implementing programs to reconcile communities torn apart by the past episodes of violence (International Crisis Group 2013; Liban Reference Liban2013).
Turnout for both the presidential and parliamentary elections was higher than in all previous elections (86%). This was especially significant coming in the wake of the 2007 violence and a rather intense period of pre-election violence starting in August 2012. In Tana River, North Eastern Province, and Nyanza, politically linked violence over the gubernatorial and other subnational elections resulted in clashes between ethnic groups and clans that killed more than three hundred people and displaced 154,000 (Human Rights Watch 2013). As in 2002, the violence did not appear organized at a national level—there did not seem to be a narrative from national leaders for targeting particular groups. Instead, fights over local politics, organized by local politicians, resulted in deaths and displacements.
Conclusion
This review shows that there have been many motivations behind the use of electoral violence in Kenya. It has been used to suppress, motivate, or punish voters. Moreover, different actors have fomented violence. In the early elections, the government was the main perpetrator, but violence was also used by opponents in later years and at the subnational level in 2013. In addition, the impact of electoral violence on voter turnout can vary because voters react to violence in different ways. They may flee and not vote; they may adjust their vote; or they may stay home but not vote. The response can depend on how widespread the violence is, how much risk the voters are willing to bear, and how they view the election. For example, the violence preceding the 2013 elections was higher than the violence preceding the 2002 and 2007 elections, yet voter turnout was higher. However, the 2013 elections were also publicized as an opportunity for the country to move beyond the violence of 2007; they were managed by a more respected electoral commission and commissioner, framed by a relatively well-received new constitution, conducted under the aegis of a well-respected and newly reformed judiciary, and monitored by a national and international institutions. In 2013, even if some politicians had wished to cow voters into staying home or abstaining from voting, there were countervailing forces signaling the importance and relevance of the vote.
Does pre-election violence, then, suppress voter turnout? Our overall conclusion is that over time and across countries in Africa, electoral violence does not result in lower voter turnout. Indeed, it has no perceptible effect at all. Instead, the Kenya case suggests that pre-election violence and its intended effects are specific to each situation—resulting in suppressing voters or pushing them to turn out at the polls—congruent with the goals of the perpetrators and electoral environment. Pre-election violence, it seems, can achieve many objectives, depending on the political and social context. This suggests the need for a more nuanced analysis—one that looks more closely at the rhetoric surrounding specific elections, the motivations behind electoral violence, and the coercive powers of the perpetrators of violence.
For practitioners—policymakers and nongovernmental organizations working on elections—the lack of consensus on how voters respond makes it difficult to overcome electoral violence. It also affects prevention efforts: if the response by voters is unclear, it is hard to understand the objective of electoral violence and thus intervene strategically ahead of time. We therefore view this analysis as a first step in a theory-building exercise to understand the consequences—and thereby further our knowledge of the objectives—of electoral violence.
Our results suggest that we have not yet fully uncovered the reasons, effects, and consequences of electoral violence. Electoral violence does not always have the high profile of a civil war; rarely are elections as violent as those of Kenya in 2007, Congo-Brazzaville in 1994, or Côte d’Ivoire in 2010. But the persistence of violent elections reinforces a norm of political transition that will eventually be at variance with the ideals and goals of democracy, especially as free, fair, peaceful, and noncoercive elections are a necessary prerequisite for democratic development.
Acknowledgments
The authors wish to thank Manuela Travaglianti, Leonardo Arriola, Nicholas Smith, Janette Yarwood, Ashley Bybee, Brittany Gregerson, Ashton Callahan, Ivana Djak, and three anonymous reviewers, all of whom contributed insights and suggestions that helped to greatly improve the original manuscript.


