


NOMENCLATURE
- CD
-
drag coefficient
- CDc
-
drag coefficient measured for the original upright model with rotating hub at cruise angle-of-attack
- Cp
-
pressure coefficient
- DAER
-
Dipartimento di Scienze e Tecnologie Aerospaziali
- FS
-
full scale
- HVG
-
VG height
- LVG
-
VG chord length
- LGV
-
large wind tunnel
- Ma
-
Mach number
- p
-
Kulite pressure signal [Pa]
- |p|
-
pressure signal spectral magnitude [Pa]
- PIV
-
particle image velocimetry
- POLIMI
-
Politecnico di Milano
- Re
-
Reynolds number
- RMS
-
root mean square
- ROD
-
rotorcraft drag reduction
- |U|
-
velocity magnitude [m/s]
- U ∞
-
free-stream velocity [m/s]
- VG
-
vortex generator
- X
-
stream-wise coordinate [m]
- Y
-
span-wise coordinate [m]
- Z
-
vertical coordinate [m]
- u
-
stream-wise velocity component [m/s]
- v
-
span-wise velocity component [m/s]
- w
-
vertical velocity component [m/s]
- α
-
angle-of-attack [deg]
- α VG
-
VG pitch angle [deg]
- δ
-
boundary layer displacement thickness
- μ
-
advance ratio
- ψ
-
azimuthal blade angle [deg]
- ω
-
rotor hub rotational speed [RPM]
1.0 INTRODUCTION
The recent expansion of helicopter use has made the problem of environmental impact particularly important. Therefore, the will to reduce fuel consumption spurred research activities on the optimisation of helicopter shape for drag reduction. In fact, in the late 1980s and early 1990s, particular effort was spent in the United States to test different hub and pylon fairing configurations for helicopter drag reduction. Comprehensive experimental test activities showed that a consistent reduction of the total helicopter drag can be obtained by combining a small circular-arc hub fairing with a non-tapered pylon fairing in an integrated configuration(Reference Martin, Mort, Squires and Young1).
Recently, the attention of the rotorcraft research community was oriented to the investigation of active/passive flow control devices for the suppression of the recirculating flow region over the fuselage back ramp. For instance, active flow-separation control was the topic of different comprehensive activities combining computational and experimental effort to study drag reduction on a generic rotorcraft fuselage. In particular, in the recent years, the Office National d’Etudes et Recherches Aerospatiales (ONERA) and the National Aeronautics and Space Administration (NASA) collaborated in the investigation of the effectiveness of air-jet blowing devices over the back-ramp region using independent experimental platforms and different flow solvers(Reference Allan and Schaeffler2,Reference Lienard, Allan, Le Pape and Schaeffler3) . The experimental activities conducted in these frameworks demonstrated that a significant drag reduction could be obtained over a wide range of angles of attack through the use of different flow control strategies. Similar results were found in the numerical/experimental study by Ben-Hamou et al(Reference Ben-Hamou, Arad and Seifert4), which aimed to investigate the effect on drag reduction produced by piezo-fluidic actuators situated at the back-ramp lower corner of a generic transport helicopter fuselage.
The aerodynamic optimisation of helicopter components became a research topic introduced in the work plan of the Green RotorCraft (GRC) project in the frame of the Clean Sky programme. The Clean Sky Joint Technology Initiative (JTI) was launched in 2008 as a public-private partnership between the European Commission and industry with the mission to develop technologies that increase the environmental performance of air transport. In particular, in past years, within the frame of the ADHeRO project(Reference Breitsamter, Grawunder and Ress5), comprehensive wind-tunnel tests and numerical simulations were carried out to investigate the effects of shape modifications and passive flow control devices on drag reduction of a light-weight utility helicopter. Moreover, within the frame of the CARD project(Reference Green, Giuni, Cervinka, Zacho, Austin, Smith, Desvigne and Alfano6), an experimental activity was carried out on a helicopter model of the same class to investigate innovative hub fairing and beanie configurations for drag reduction.
The GRC2 Consortium decided to focus the investigation on drag reduction also for a heavy-weight class helicopter, considering the same geometry tested during the GOAHEAD project, funded by EU’s Sixth Framework Programme for Research (FP6). In that framework, this helicopter model was the object of a comprehensive experimental campaign with the aim to build an experimental database for a complete rotorcraft configuration(Reference Raffel, De Gregorio, Groot, Schneider, Sheng, Gibertini and Seraudie7). The database was then used to validate state-of-the-art Computational Fluid Dynamics (CFD) solvers developed for the study of rotorcraft aerodynamic problems(Reference Antoniadis, Drikakis, Zhong, Barakos, Steijl, Biava, Vigevano, Brocklehurst, Boelens, Dietz, Embacher and Khier8). The results of the experimental and numerical studies enabled an improvement in the understanding of the complex flow field related to a complete helicopter configuration(Reference Biava, Khier and Vigevano9), providing more detailed insight into the interactional aerodynamics features of rotorcraft (i.e. dynamic stall(Reference Mulleners, Kindler and Raffel10), tail shake, pitch up(Reference De Gregorio11)) and their effects on helicopter performance for different operating flight conditions.
The present work describes the wind-tunnel tests carried out in the frame of the Clean Sky ROD project, funded by EU’s Seventh Framework Programme for Research (FP7). The main goal of the activity was to evaluate the effectiveness of the CFD-based shape optimisation performed by the GRC2 consortium on several components of the considered common platform helicopter. In particular, the attention of the optimisation was focused on the rotor hub, on the sponsons and on the back-ramp area. The rotor hub represents, indeed, the source of a conspicuous part of the helicopter drag (of the order of 40% of the total drag). Thus, different hub-cap configurations were investigated by the numerical groups of DLR(Reference Khier12) and ONERA. In particular, the latter group also investigated the shape of a fairing for blade attachments to be used together with the optimised hub cap for a further reduction of the drag due to the rotor hub. Moreover, ONERA numerically investigated the use of Vortex Generators (VGs) positioned on the fuselage back-ramp area(Reference Boniface13). In fact, the pronounced upsweep of the after-body shape characterising the blunt fuselages is responsible for a recirculating region at the junction with the tail boom that yields penalties on helicopter drag.
The helicopter fuselage model used for the present activity was basically the same as that employed in the frame of GOAHEAD project wind-tunnel tests(Reference Raffel, De Gregorio, Groot, Schneider, Sheng, Gibertini and Seraudie7). However, for the present experimental campaign, the model internal structure, the motorised horizontal stabiliser and the swash plate were purposely re-designed and built. The tests were carried out in the large wind tunnel (LGV) of Politecnico di Milano (POLIMI). The comprehensive experimental campaign included tests both with the original and the optimised helicopter configuration to evaluate the performance improvements by comparison.
Different measurement techniques were employed during the wind-tunnel campaign. In particular, in addition to the global aerodynamic load measurement, two partial balances for the rotor hub and the horizontal stabiliser were used during the test activity. Moreover, steady pressure measurements were performed at more than 300 points located on the fuselage and the horizontal stabiliser, whereas the back ramp and the fin of the model were instrumented with fast-response pressure transducers to evaluate the typical unsteadiness of the flow field around these components. In addition, stereo Particle Image Velocimetry (PIV) surveys were performed above the back-ramp region and in the area before the fin to investigate respectively the effect of the VGs on the three-dimensional flow behaviour and the rotor wake patterns relative to the different hub caps tested.
In Section 2, the set-up of the helicopter model and that of the measurement techniques is described. Section 3 reports the main results of the wind-tunnel activity. Final considerations and comments are given in Section 4.
2.0 EXPERIMENTAL SET-UP
The tests were carried out in the LGV of POLIMI. The LGV test section dimensions are 4 m × 3.84 m. The maximum wind velocity is 55 m/s, and the turbulence intensity is less than 0.1%.
2.1 The helicopter model
The 1/4-scale helicopter model was set up starting from some pre-existing components. Indeed, the model fuselage, based on the NH90 geometry, was the one used for the GOAHEAD test activity(Reference Raffel, De Gregorio, Groot, Schneider, Sheng, Gibertini and Seraudie7), whereas the swash plate, the internal structure and additional sponsons were purposely designed for the present test activity as well as the new motorised horizontal stabiliser(Reference Lemmens, Decours, Fijalek and Hakkart14). The new layout of the helicopter model is shown in Fig. 1.
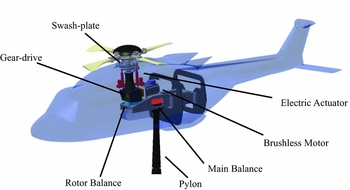
Figure 1. Layout of the helicopter model.
Since the main goal of the experiments was drag measurement of the fuselage and rotor hub, the helicopter model did not include the complete main rotor but only the rotor hub equipped with blade stubs. The span-wise extent of the blade stubs is equal to 30% of the rotor radius. Three electric actuators acting on the swash plate were used to set the collective and cyclic pitch of the blade stubs. The rotor was driven by a brushless motor with a 5:1 gear-drive. The 1/rev of the master blade was measured using a Hall Effect sensor mounted on the rotor shaft. An internal metal structure was designed and built to interface the model with the LGV pylon in both upright and upside-down configurations (Fig. 2). The pylon head controlled by a hydraulic system allowed the model angle-of-attack to be set. The sideslip angle of the model was set by means of a turn table positioned on the floor of the test section. The experimental study of the optimised solutions involving the lower part of the fuselage (i.e. VGs and sponsons) was carried out with the model in an upside-down configuration to avoid pylon interference. Moreover, tests with a dummy pylon were also carried out with this model configuration for the evaluation of the corrections due to the supporting pylon interference.

Figure 2. Original model configurations in the LGV test section.
The model was equipped with three strain gauge balances. The main balance was a six-component RUAG 192-6L installed on the head of the supporting strut (see Fig. 1). From the calibration report delivered by the balance manufacturer, a maximum error of the order of 0.6% of the helicopter original geometry drag in cruise condition (CDc ) is declared for the load class corresponding to the load conditions measured in the present test campaign. It must be considered that this maximum error is evaluated taking into account load configurations quite different from the ones measured in this campaign. Thus, taking into account that the in situ checks carried out by means of calibrated weights showed much lower errors, an accuracy of the order of 0.5% of the helicopter original geometry drag in cruise condition can be reasonably and precautionarily assumed. A second six-component RUAG 196-6D strain gauge balance was used to measure the partial aerodynamic loads acting on the rotor hub (see the installation layout in Fig. 1). Moreover, the horizontal stabiliser was instrumented with a two-component strain gauge balance to measure the vertical component of the aerodynamic load and the rolling moment.
More than 300 static pressure taps distributed on the model fuselage (not on the sponsons) and on the horizontal stabiliser were connected to eight pressure scanners (1 PSI FS, accuracy 0.1% FS) embedded inside the model. Unsteady pressure measurements were carried out on the back ramp and the fin of the model instrumented with 20 XCS-093 Kulite miniature fast-response pressure transducers (2 PSI FS, accuracy 0.1% FS). Pressure (steady and unsteady) and load measurements were carried out simultaneously for an acquisition time of 10 s for each model attitude. The acquisition frequency of unsteady pressure transducers was 10 kHz. The pressure taps position on the model for both the steady and unsteady measurements is illustrated in Fig. 3, showing also the X-Y-Z reference system employed in this work. In particular, the X − Z plane is located on the model mid-span plane, and the origin of the reference system is positioned on the fuselage nose. More details about the test rig can be found in Gibertini et al(Reference Gibertini, Auteri, Campanardi, Droandi, Grassi, Le Pape and Zanotti15).

Figure 3. Layout of the pressure taps distribution on the model.
The helicopter components optimised for drag reduction were designed by POLIMI starting from the shapes computed by the numerical simulations of ONERA and DLR. The improvements on the performance produced by the optimised components were evaluated by comparison with the drag measurements carried out with the original configuration components.
Figure 4 shows the layout of the different hub caps tested during the wind-tunnel activity. In particular, Fig. 4(a) shows the original hub cap of the helicopter model. The first optimised hub cap and the set of optimised fairings for blade stub attachments provided by ONERA (respectively called small hub cap and stub fairings from now on) are shown in Fig. 4(b). A second optimised hub cap was designed starting from the external shape of a full hub fairing optimised by DLR described in the work by Khier(Reference Khier12). However, the tested hub cap (called large hub cap from now on) presents a large open underside suitable for the mounting on the rotor hub that was not considered in the CFD optimisation by DLR (see Fig. 4(c)).

Figure 4. Layout of the hub caps tested in the wind tunnel.
The CFD-based optimisation activity was also dedicated to the sponsons. In particular, Fig. 5 shows the layout of the original and the new set of sponsons optimised by DLR’s computation tested in the wind tunnel (called new sponsons from now on).

Figure 5. Layout of the sponsons tested in the wind tunnel.
The experimental activity included tests of VG arrays positioned on the helicopter back-ramp area. In particular, the four most promising sets of 2 × 8 co- and counter-rotating VGs resulting from the CFD optimisation(Reference Boniface13) were considered for the wind-tunnel tests. The size and the pitch angle with respect to the local velocity field of the optimised VG configurations are reported in Table 1, where the chord length and the height of the VG are given with respect to the computed boundary layer displacement thickness (δ).
Table 1 Key parameters of the four VG configurations tested in the wind tunnel
The VGs were cut from a 1-mm-thick PVC sheet and glued on a thin strip made of the same material (0.5 mm thickness and 30 mm chord). The tests were performed with the VG arrays attached on the model slightly downstream of the fuselage upsweep, representing the best position indicated by the CFD activity to obtain the highest drag reduction. The layout of the co- and counter-rotating VG arrays positioned on the fuselage model is shown in Fig. 6.

Figure 6. Layout of the VG arrays on the fuselage model.
Table 2 summarises the model configurations tested during the wind-tunnel campaign.
Table 2 Summarised test matrix for both upside-down and upright model configurations

2.2 Stereo PIV set-up
Two different areas of investigation were investigated by stereo PIV surveys during the wind-tunnel activity. With the model in upside-down configuration, the aim of the survey was the investigation of the effect of the VGs in the area of the junction between the fuselage back ramp and the tail boom. With the model in upright configuration, PIV surveys were carried out in the area just ahead of the model fin to investigate the patterns of the rotor wake with the different hub caps tested. The PIV system was set up to measure the three velocity components on longitudinal X-Z plane windows at different span-wise locations of the model. This technique enabled reconstruction of the average three-dimensional flow field over a volume of interest, as performed in the work by Zanotti et al(Reference Zanotti, Ermacora, Campanardi and Gibertini16). A set of 100 image pairs was acquired for each measurement plane. The PIV measurements were carried out over a total number of 53 longitudinal planes for the surveys over the back-ramp region (5 mm spacing in span-wise direction) and over 27 longitudinal planes for the surveys ahead of the fin (10 mm spacing in span-wise direction). In the latter case, the choice of a lower number of PIV planes was dictated by the will to obtain a compromise between a reliable spatial resolution of the measurement and a duration of the survey suitable to avoid prolonged stress of the rotating system. Thus, the span-wise dimension of the measurement volume for the surveys carried out with both model configurations was equal to 260 mm centred on the model mid-span section. The dimensions of the longitudinal measurement windows were respectively 365 mm × 185 mm for the surveys in the back-ramp region and 157 mm × 310 mm for those ahead of the fin. The location of the measurement volumes with respect to the fuselage model is shown in Fig. 7.

Figure 7. PIV measurement volumes on the back ramp and ahead of the fin, with dimensions in millimeters.
The PIV instrumentation consisted of a Litron NANO-L-200-15 Nd:Yag double pulsed laser with a 200 mJ output energy and a wavelength of 532 nm, and two Imperx ICL-B1921M CCD cameras with a 12 bit, 1, 952 × 1, 112 pixel array. The laser was mounted on the ceiling of the wind-tunnel test section and was moved in span-wise direction by a single-axis traversing system. The CCD cameras were also moved in span-wise direction by means of two linear guides with high accuracy in position. The guides were positioned on a metallic strut attached on the side wall of the test section, enabling rotation of the cameras around the pitching axis of the model. With this solution, the image views were easily aligned with respect to the model angle-of-attack selected for the PIV survey. The cameras were equipped with a Nikkor 50 mm lens mounted on tilting mountings to achieve the Scheimpflug condition. The camera separation angle was set to 40° to obtain a correct optical access to the measurement area. During the PIV test run, the laser and the cameras were moved simultaneously in the span-wise direction to obtain correct focusing of the laser sheet with the image plane for each longitudinal measurement plane. The stereo PIV system layout inside the LGV test section is shown in Fig. 8.

Figure 8. Layout of the PIV instrumentation in the LGV test section.
Phase-locked PIV measurements were possible for the surveys in upright configuration with the rotating hub using the 1/rev signal measured by the Hall Effect sensor mounted on the rotor shaft. In particular, for these tests the images acquisition was carried out at ψ = 0°, corresponding to the azimuthal position of the master blade stub aligned with the fuselage mid-span plane.
The image-pairs analysis was carried out by PIVview 3C software(17), developed by PIVTEC. The multigrid interrogation method(Reference Raffel, Willert, Wereley and Kompenhans18) was used starting from a 96 pixels × 96 pixel to a 32 pixel × 32 pixel interrogation window. The accuracy of the present PIV measurement can be estimated considering a maximum displacement error of 0.1 pixels(Reference Zanotti, Ermacora, Campanardi and Gibertini19). Thus, taking into account the employed pulse-separation time and the optical magnification(Reference De Gregorio, Pengel and Kindler20), the maximum in-plane velocity components error is about 1% of the maximum in-plane velocity component. Due to the stereoscopic optical set-up, a slightly higher error can be estimated for the out-of-plane velocity component.
3.0 RESULTS
The main results of the comprehensive experimental campaign carried out with the model in both upright and upside-down configurations are outlined in the present section. The tests were performed with a wind-tunnel free-stream velocity U ∞ = 50m/s (Ma = 0.15). For the upright tests, the rotational speed of the rotor hub was set to ω = 710RPM (μ = 0.32 based on the blade tip velocity of the entire scaled rotor and on the free-stream wind-tunnel velocity). All presented data are corrected considering wind-tunnel effects. In particular, the wind-tunnel data was corrected for the horizontal buoyancy in the test section, the supporting pylon interference and the model solid blockage.
3.1 Upside-down configuration tests
As stated previously, the performance of the VG array on the back ramp and of the optimised sponsons was evaluated with the model in upside-down configuration to avoid the interference of the strut wake. The effect produced by VGs and optimised sponsons are presented in this section, adding their drag contribution measured during the tests in upside-down configuration to the baseline fuselage drag measured in upright configuration. This choice allowed one to consider the proper contribution of these components to the helicopter fuselage drag corrected for wind-tunnel effects (particularly for pylon interference). In fact, the measurements in an upright configuration indicated that the VGs and the new sponson effects were clearly influenced by the strut wake; the results of the tests performed with the optimised hub are also reported in Section 3.2.1, considering the additional drag differences measured for these components in upside-down configuration tests.
3.1.1 Load measurements
First of all, to evaluate the VG layout providing the best drag reduction, four selected arrays of VGs were tested at the cruise angle-of-attack of the actual helicopter (α = −1.8°) with the model equipped with the original sponsons (next called baseline fuselage). The effects of the different VGs and new sponsons are presented in Figs 9 and 10, where, as mentioned earlier, their drag contributions measured in upside-down configuration were added to the baseline fuselage drag measured in upright configuration.

Figure 9. Effect on measured drag of the different arrays of VGs at α = −1.8° for the original fuselage configuration with original sponsons: the indicated percentage drag differences are calculated with respect to the drag coefficient CDc measured at cruise angle-of-attack for the original model in upright configuration with the original sponsons and rotating hub.

Figure 10. Effect on drag of the best VG array and new sponsons measured for α-sweep tests, Ma = 0.15.
The VG study showed that the the higher drag reduction at cruise attitude is provided by the smaller counter-rotating VG array (see Fig. 9). This measured value of drag reduction (1.9%) is comparable to the one measured by Breitsamter et al(Reference Breitsamter, Grawunder and Ress5) for a light-class helicopter model. Indeed, in the latter work, a maximum drag reduction of 1.5% of the total helicopter drag was found using straight strakes and two pairs of VGs positioned slightly upstream of the back ramp, with dimensions and inclination relative to the incoming flow very close to the best VG configuration tested in the present experiments. The drag reduction value (of the order of 2%) obtained at cruise attitude using such passive devices, requiring very simple modification to existing helicopters, can be considered a useful result leading to a non-negligible benefit in terms of fuel saving. In fact, recent literature has shown that slightly higher values of drag reduction (an average of 10% of the baseline fuselage drag only) can be obtained by employing active flow control strategies as air-jet blowing actuators positioned at the back-ramp region(Reference Lienard, Allan, Le Pape and Schaeffler3,Reference Ben-Hamou, Arad and Seifert4) . However, it must noticed that this latter solution would produce apparent drawbacks on existing helicopters related to installation, power requirements and maintenance of such active actuators.
The overall performance of the best VG array and the new sponsons are shown in Fig. 10 in the range of angles of attack between − 6° ⩽ α ⩽ 6°.
The α-sweep test results comparison shows that the small counter-rotating VG produce a benefit in terms of drag reduction for angles of attack close to cruise attitude as well. In particular, the VGs are more efficient close to zero incidence. On the other hand, a decrease in VG performance is observed for angles of attack smaller than the cruise incidence. By adding the optimised sponsons, a further drag reduction is observed for negative angles of attack of the model, whereas the measured drag is slightly increased with respect to the baseline configuration with VGs. In particular, at cruise angle-of-attack, the optimised sponsons produce a further decrease of 0.9% of the drag measured in upright configuration for the original model with rotating hub.
3.1.2 Velocity and pressure measurements
The best VG configuration was the object of a detailed experimental investigation including pressure measurements and PIV surveys to achieve an insight about the flow physics related to the use of such devices.
The average pressure coefficient (Cp ) distributions measured over two selected sections downstream of the best VG array is compared in Fig. 11 with the ones measured for the baseline fuselage configuration. On both considered instrumented sections, an apparent increase of pressure on the back-ramp surface is observed when the VG array is mounted on the model, as indicated by the upward-oriented arrows. These steady pressure measurements confirm that the VGs are responsible for limiting the suction effect responsible for pressure drag rise. Moreover, re-energising the boundary layer, VGs are suitable to prevent or limit the flow separation on the back-ramp region. This effect is confirmed by the PIV survey results obtained with and without the best VG array.
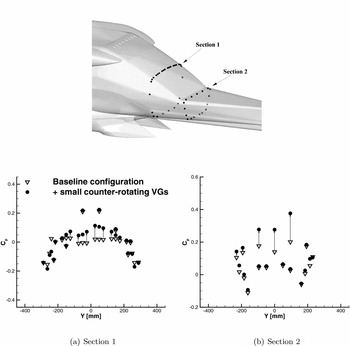
Figure 11. Effect of the best VG array on Cp distribution at selected fuselage sections for tests in upside-down configuration, α = −1.8°, Ma = 0.15.
The comparison of the averaged non-dimensional stream-wise velocity component u/U ∞ measured on a longitudinal and on different span-wise planes extracted from the measurement volume is reported in Fig. 12. For the baseline fuselage configuration, the flow close to the ramp is characterised by a large flow separation. The extent of the three-dimensional separated flow is highlighted by the back-flow region evaluated on X − Z and Y − Z planes. On the other hand, the back-flow region in the PIV volume of investigation vanishes when the model is equipped with the VG array, and the flow field shows an attached behaviour close to the back ramp. A similar effect due to the VG solution on the flow field over the back-ramp region was also described by Breitsamter et al(Reference Breitsamter, Grawunder and Ress5), where cross-flow PIV surveys depicted a reduction of the area of the mean axial velocity deficit located in the upper central back-ramp section.

Figure 12. Effect of the best VG array on the velocity field in the back-ramp region: PIV results for tests in upside-down configuration at α = −1.8°, Ma = 0.15.
The unsteadiness level of the flow field close to the back-ramp surface can be evaluated by the analysis of the unsteady pressure transducer signals. Figure 13 shows the comparison of the pressure signals’ Root Mean Square (RMS) measured by two Kulite transducers located on the mid-span plane of the back-ramp downstream of the VG array. A higher value of the pressure signals’ RMS is apparent for the baseline fuselage configuration with respect to the ones calculated with the small counter-rotating VG. Indeed, the amplitude of the pressure fluctuations is quite decreased when the VGs are present, as confirmed by the comparison of the same pressure signals’ spectrum shown in Fig. 14 and coherently with the quite regular behaviour of the flow observed by the PIV surveys over the back-ramp region.

Figure 13. Comparison of the Kulite pressure signals’ RMS measured on the fuselage back ramp for tests in upside-down configuration, α = −1.8°, Ma = 0.15.

Figure 14. Comparison of the back-ramp Kulite pressure signals’ spectrum for tests in upside-down configuration, α = −1.8°, Ma = 0.15.
3.2 Upright configuration tests
The tests with the model in upright configuration were mainly addressed to evaluate the effects of the different solutions optimised to reduce the rotor hub drag. Figure 15 shows the helicopter model equipped with the different optimised rotor hub components in the LGV test section.

Figure 15. The helicopter model with the optimised hub caps in the LGV test section.
3.2.1 Loads measurements
An accurate estimate of the contribution to the aerodynamic performance was obtained by adding all optimised components, starting from the original to the final optimised configuration. As mentioned previously, in upright configuration, the VGs and the new sponson effects were clearly influenced by the strut wake. Thus, in the present section, these measured spurious drag contributions were removed from the global measured drag, and the drag differences evaluated for the VGs and the new sponsons in upside-down configuration were added to consider the proper effects of these components to the total drag of the optimised model.
The comparison of the drag coefficients measured for the different rotor hub configurations at cruise attitude is shown in Fig. 16. In this figure, the contribution of the different optimised components are indicated in terms of percentage drag differences calculated with respect to the drag measured at cruise angle-of-attack for the original model configuration.

Figure 16. Effect on measured drag of the different rotor hub configurations at α = −1.8° for tests in upright configuration with a rotating hub, Ma = 0.15, ω = 710RPM: the indicated percentage drag differences are calculated with respect to the CD measured at cruise angle-of-attack in upright configuration for the original model with a rotating hub.
At cruise angle-of-attack, the small hub cap produces a higher drag reduction with respect to the large hub cap. A slight drag decrease can be observed by adding the blade stub attachment fairings to the small hub cap, whereas they produce a small decrease in the large hub-cap performance. Generally, the wind-tunnel activity showed that at cruise attitude, an overall maximum drag reduction of 6.1% with respect to the original configuration can be obtained by the optimised helicopter configuration equipped with the small hub cap, the blade stub fairings, the new sponsons and the small counter-rotating VG array.
Another interesting result was the drag reduction obtained with the large hub cap if compared to the wind-tunnel data measured by Martin et al(Reference Martin, Mort, Squires and Young1). In fact, these tests showed that a circular-arc hub fairing with a diameter and thickness to rotor radius ratio similar to the large hub cap tested in the present experiment produces an increase in the total drag if tested with an unfaired mast.
A more general overview of the performance of the optimised components can be deduced from the comparison of the drag measurements carried out in the α-sweep tests. The drag coefficient curves comparison in the range between − 6° ⩽ α ⩽ 6° is shown in Fig. 17.

Figure 17. Effect on measured drag of the different rotor hub configurations for α-sweep tests in upright configuration with a rotating hub, Ma = 0.15, ω = 710 RPM.
The model configuration with the small hub cap and the new sponsons produces an apparent drag decrease with respect to the original model configuration in the whole range of angles of attack considered around the cruise attitude. The addition of the stub attachment fairings produces a further slight decrease of the model drag, particularly from the cruise attitude towards positive angles of attack. The model configuration with the large hub cap shows worse performance with respect to the small hub-cap configuration in the whole considered range of incidences. However, for negative angles of attack, a benefit with respect to the original model configuration is still apparent, whereas a performance decrease is observed for positive incidences. For the latter hub-cap configuration, the use of the stub attachment fairings does not produce an appreciable increase in performance in terms of drag reduction in the whole range of angles of attack considered.
3.2.2 Velocity and pressure measurements
PIV surveys and unsteady pressure measurement results were carried out to investigate possible “tail-shake” effect with the different optimised hub-cap configurations. The comparison of the phase-averaged PIV results with the original and optimised hub-cap components at cruise angle-of-attack are illustrated in Fig. 18, showing the contours of the non-dimensional stream-wise velocity component on a longitudinal and span-wise plane extracted from the measurement volume. A quantitative evaluation on the extent of the rotor hub wake is obtained by the comparison of the stream-wise velocity component profiles extracted at model mid span on the span-wise measurement plane closest to the fin (Fig. 19).

Figure 18. Effect of the hub caps on the rotor hub wake: phase-averaged PIV results for tests in upright configuration with rotating hub at α = −1.8°, Ma = 0.15, ω = 710RPM, ψ = 0°.

Figure 19. Comparison of the stream-wise velocity component profiles extracted from PIV measurement volume on the vertical (red) line for the different hub-cap configurations.
The PIV results analysis shows that the velocity deficit region measured for the original hub-cap configuration is confined in the lower part of the measurement volume close to the tail boom. Thus, in the present configuration, the rotor hub wake influences the lowest part of the fin only (see Fig. 18(a)). On the other hand, a wider velocity deficit region can be observed from the PIV results obtained with both the large and small optimised hub caps. In particular, the area with the higher velocity deficit is more extended for the large hub-cap configuration (see Fig. 18(b) and (c)). This means that the optimised hub caps do not deflect the wake enough to avoid collision with the fin. Moreover, the blade stub attachment fairings do not produce appreciable effects on the rotor hub wake (see Fig. 18(d)).
The unsteady pressure measurements carried out on the fin provide interesting information about the unsteadiness of the rotor hub wake for the different hub caps tested. Figure 20 shows the comparison of the pressure signals’ RMS measured at cruise angle-of-attack by the Kulite transducers located on the port side of the fin. This side, corresponding to the upper side of the fin aerofoils, is more sensitive to the instantaneous incidence variations.

Figure 20. Comparison of the Kulite pressure signals’ RMS measured on the fin port side for the different hub-cap configurations at cruise attitude.
In particular, the RMS of the pressure signals measured with the original hub cap by the two highest Kulite transducers (KF1 and KF2) is lower with respect to the ones measured with both the small and the large hub cap. The RMS value comparison shows that the flow impinging on the higher part of the fin presents the highest level of unsteadiness for the rotor hub configuration equipped with the large hub cap. The spectrum of the KF1 transducer pressure signal confirms this feature. In fact, the highest amplitude peak corresponding to the rotor 4-per-rev frequency is obtained for the signal measured with the large hub-cap configuration (Fig. 21(a)). The measurements of the lower KF3 transducer show a similar level of pressure fluctuation for all three hub-cap configurations tested, as also confirmed by the spectra comparison shown in Fig. 21(b). On the other hand, a higher value of the signal RMS for the original hub-cap configuration can be observed from the lowest KF4 transducer measurements.

Figure 21. Comparison of the port side Kulite pressure signals’ spectrum for the different hub caps at cruise attitude.
4.0 CONCLUSIONS
A comprehensive wind-tunnel test campaign was performed in the POLIMI LGV to assess the effectiveness of helicopter components optimised by CFD for drag reduction. In particular, a heavy-class helicopter model was set up to be tested in both upright and upside-down configurations.
An accurate evaluation of the aerodynamic drag was carried out to evaluate the performance of different hub caps, a set of blade stub attachment fairings and a new set of sponsons. Moreover, the use of different arrays of VGs located on the model back ramp was investigated for the same purpose. Pressure measurements and a stereo PIV survey enabled detailed insight into the flow physics related to the use of the optimised components.
The wind-tunnel tests carried out with the model in upright configuration with the rotating hub confirm the effectiveness of the optimised components, showing an overall drag reduction of about 6% at cruise attitude with respect to the original model configuration. Moreover, stereo PIV surveys enabled the evaluation of the wake patterns of the different rotor hub configurations tested. The flow field surveys, combined with the unsteady pressure measurements on the fin, were also useful to investigate the performance of the optimised hub caps on possible tail-shake effects.
The upside-down measurements confirm that the best performance in terms of drag reduction is obtained with an array of counter-rotating VGs positioned on the fuselage back-ramp area slightly beyond the pronounced fuselage upsweep. PIV results clearly show that their action eliminated the recirculating region at the junction with the tail boom responsible for helicopter drag penalties. A drag reduction of the order of about 2% was found with the use of the best VG array. This can be considered useful result, as it produces the benefit of a non-negligible reduction of fuel consumption with a very simple modification to existing helicopters.
ACKNOWLEDGEMENTS
The research leading to these results has received funding from the European Community’s Seventh Framework Programme (FP7/2007-2013) for the Clean Sky Joint Technology Initiative under grant agreement 325997.


