


NOMENCLATURE
Abbreviations
- CAD
computer-aided drawing
- FEA
finite element analysis
- HP
high pressure
- HPT
high-pressure turbine
- IP
intermediate pressure
- IPC
intermediate pressure compressor
- IPT
intermediate pressure turbine
- LHM
latent heat of melting (energy/volume)
- LP
low pressure
- LPC
low-pressure compressor
- LPT
low-pressure turbine
- NGV
nozzle guide vane
Symbols
- A
contact area
- Cp
specific heat
- F
force
- R
radius
- T
temperature
- V
velocity of disk
- β
heat partition ratio, relative flow angle
- ρ
density
- μ
friction coefficient
- ω
angular speed
1.0 INTRODUCTION
This study investigates the modelling of post shaft failure using the LS-DYNA FEA software as well as analytical methods. Shaft failure in a gas turbine engine can have consequences such as
∙ overspeed and burst of free running turbine disks and/or blades,
∙ secondary damage to the engine oil and piping systems due to the rearward turbine movement,
∙ engine power loss or engine destruction, and
∙ damage to airframe due to the liberation of high energy debris.
The work reported herein focuses on a shaft failure scenario in which the turbine is unlocated. The adopted FEA methodology is verified with a steel bar, ‘continuous-drive’, friction welding experiment and the same methodology is then applied to the study of shaft failure. To determine the gas torque and axial force acting on the turbine after failure, an analytical turbine performance model and a friction formulation are applied. The obtained values are used as boundary conditions in LS-DYNA ‘thermal–structural’ analysis. The results of this investigation show that the key parameters affecting turbine angular speed during the event are the axial force acting on the turbine wheel, and the rate of turbine rearward dislocation.
In addition to the modelling of the post shaft failure event, this study also attempts to highlight the possible application in engine design of the modelling tools discussed. To that end, integrated performance and friction models are used in a parametric study to investigate the effect on overspeed of the rubbing between the turbine wheel and a stationary knife seal component. The radius and the area of the stationary seal platform are changed, and the design space is explored in terms of turbine acceleration, turbine dislocation rate and seal mass.
1.1 Description of the event
In a gas turbine engine, the turbine and compressor spools are coupled to each other and the power extracted from the expansion side is transmitted to the compression side. A schematic representation of a three-shaft, high bypass ratio turbofan engine( 1 , Reference Whurr 2 ) is shown in Fig. 1. The LP shaft rotates on three bearings and torque is transmitted from the LPT to the LPC which is the ‘bypass’ fan. The IP shaft rotates on three bearings and an ‘inter-shaft’ bearing, and gas torque is transmitted from the IPT to the IPC. The third shaft system is the HP shaft and this system rotates on two bearings. In normal operation, the compression side spool and the expansion side spool are coupled and rotated at the same angular speed.
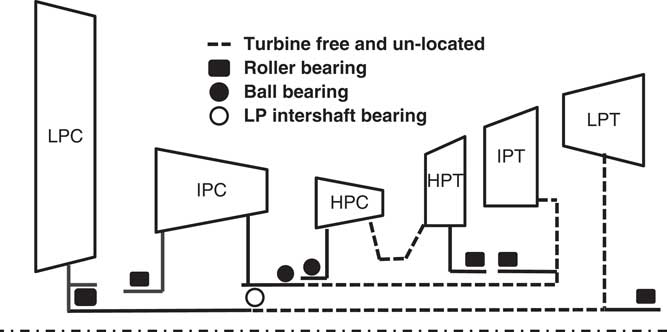
Figure 1 (Colour online) Schematic representation of a three-shaft turbofan engine.
In case of a shaft failure, the compression and expansion sides are decoupled from each other and the turbine overspeeds due to the continuing expansion through its stage(s). According to the bearing arrangement and shaft failure position, the free running turbine can either move rearwards, due to the axial load, or remain axially located. Rearward movement is possible if the bearing support does not apply an axial constraint. In the case where the free running turbine can move, the type of the failure is called unlocated. In Fig. 1, the shaft failure positions where the turbine would be unlocated are shown using dashed lines.
Failure of the mechanical systems may occur due to several reasons. ‘Operation-related’ factors are generally wear, corrosion and structural loading. Additionally to these factors, other parameters that lie on the ‘root-cause’ of the failure may be assembly or design errors, manufacturing defects, casting discontinuities, improper maintenance and unforeseen operating conditions( 3 ). Shaft failure in an engine can be related to any of these aspects.
In 2010, during a Qantas airways flight, a Boeing 747-438 sustained an uncontained engine failure( 4 ). One of the RB211-524G2-T engines failed and high energy debris were liberated through the casing and nacelle. According to the subsequent investigation, fatigue failure of a blade in the second stage of the LP turbine resulted in secondary blade release and unbalance. Rotating unbalance in the LP spool overloaded and failed the roller bearing of the LP turbine. The LP turbine started to orbit, as a consequence of the bearing failure, and contacted the IP turbine causing damage. The IP shaft sheared as a consequence of the damage and became unlocated. Because of the IPT wheel overspeed and the contact with the casing, the blades were released. In this case, although there was no disk burst, due to blade to vane impact between IPT and LP NGV, the turbine casing ruptured and high energy material was released.
1.2 Role of friction in post shaft failure
Following a shaft failure, hazardous consequences must be avoided. General engine integrity has to be conserved and all debris should be radially contained so that it does not penetrate the engine’s casing; it is expected that some debris may exit the engine through the nozzle, which cannot be avoided. Providing a ‘fail-safe’ environment depends on one or a combination of the following conditions, namely
∙ accurate modelling of the event and designing components according to the progression of the event,
∙ detection of overspeed and providing an inherent protection mechanism and
∙ demonstrating safety with small-scale experiments or a full-scale engine test.
An overspeeding unlocated turbine will eventually contact downstream stationary components due to the axial force acting on it. The generated friction at the contact interface is one potential way to limit turbine acceleration, as explicitly mentioned in EASA AMC E 850 certification standards( 5 ). Retaining the rotating components in their plane of rotation, possible ways of generating friction can be disk rubbing, blade interference and blade shedding. Blade interference is also called as blade meshing, blade clashing and blade tangling( 6 , Reference Gonzalez and Pachidis 7 ). Blade shedding is a controlled blade failure in order to reduce the radial loads on the disk and reduce the risk of disk burst( Reference Ortiz, Herran and Chalons 8 ).
For clarity and illustration purposes, Fig. 2 shows the sketches of the different scenarios mentioned above. Figure 2(a) shows an intact turbine rotor, which can also be considered as a located turbine after a shaft failure. Figure 2(b) represents the radial interaction of rotor with the casing. This is called blade shedding, and this sketch is also valid for tip rubbing due to small radial deflections. Figure 2(c) and (d) describes the axial interaction of the dislocated turbine rotor with downstream stationary components. All these mechanisms to arrest turbine speed have their own challenges in engine design and modelling. These potential solutions normally require a test to prove their viability. However, they can be allowed if it can be demonstrated through modelling and simulation that they can lead to predictable and safe outcomes( 5 ).
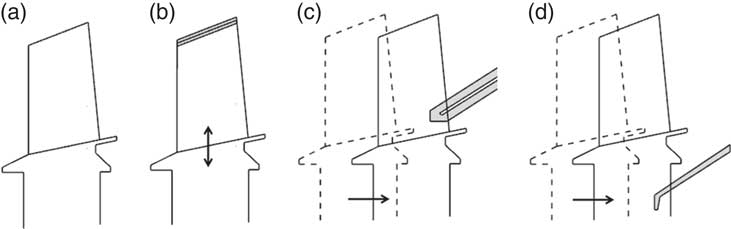
Figure 2 Possible scenarios. (a) Intact rotor, (b) blade shedding, (c) blade interference and (d) disk rubbing.
1.3 Design choices and modelling approaches
Component failures are not desired. However, they are the possible consequences of some of the operating conditions in aircraft engines. Several actions are taken to prevent their occurrence or minimise their effect if they do happen. Design choices to minimise their undesired consequences, and various modelling approaches are all active topics in aircraft engine design to make the event predictable and controllable.
For example, in an air turbine starter, rings have been implemented to separate the blades from the disk in case of an unlocated shaft failure( 9 ). The target of the design is to isolate the disk from the gas torque which may cause overspeed and burst.
Another protection system is proposed by Coxhead( Reference Coxhead 10 ) which is based on creating unbalance in the IPC of a ‘three-shaft’ engine during a located shaft failure. There are three masses added to the IP shaft and these masses are axially and radially balanced in normal operation. These masses are also arranged in the axial direction in such a way so that in case of a located IP shaft failure they stay on different sides of the shafts. When they become separated, the masses create unbalance in the IPC and prevent compressor recovery from surge during engine run down. Since the compressor does not recover, there won’t be any significant pressure rise in the IPC to be expanded through the turbine(s). Ferlauto and Taddei( Reference Ferlauto and Taddei 11 ) studied axial compressor rotating stall in 2D by lumping the meridional flow at the mean radius. The study aims the simulation of flow control strategies which can target to avoid performance reductions in stalled operation or promote stalled operation as an overspeed prevention mechanism.
Very few attempts to model shaft failure have been reported in the public domain up to now. Psarra( Reference Psarra 12 ) generated ‘wear maps’ to represent the friction due to disk rubbing and axial dislocation of the free running turbine after an unlocated shaft failure. LS-DYNA FEA software was used, and the study was concentrated on disk rubbing conditions, namely, the contact between the free running IP disk and LP NGV seal segment. Gonzalez and Pachidis( Reference Gonzalez and Pachidis 7 ) modelled the friction generated by tangling (interference) of blades and vanes. A set of correlations was obtained through a series of design of experiments with LS-DYNA FEA software to calculate the contact friction energy and rotor axial displacement. Computational cost is very high due to the millions of degrees of freedom in the analysis of this kind of interaction in turbines. As a potential way of reducing the computational cost, Cendón et al( Reference Cendón, Erice, Gálvez and Sanchez-Galvez 13 ) used a cyclic symmetry of the blades for a blade to vane interference study, and Hermosilla et al( Reference Hermosilla, Alcaraz and AJA 14 ) used rigid blades in a blade shedding analysis of a Trent engine LPT.
Haake et al( Reference Haake, Fiola and Staudacher 15 ) presented a shaft failure simulation methodology based on integrated component performances and friction characteristics between components. The simulated performance of the compression system was verified against experimental observations with the ‘post-stall’ operation verified using results from ‘fuel-spike’ tests. The turbine capacity was read from a graph as a function of the turbine exit total pressure to ambient pressure ratio. The current study considers only the turbine assembly, and the handling of the multiple contact points is similar to the work of Haake et al.( Reference Haake, Fiola and Staudacher 15 ) As a further attempt, the finite element models are run in real time to be used together with the analytical method which can provide fast approximations to the overspeed behaviour.
The novelty of the work reported herein lies in the development of a generalised modelling approach that can produce useful engine design guidelines to minimise the terminal speed of a free running turbine after an unlocated shaft failure. The study considers the friction generated between rotating and stationary components as an overspeed prevention mechanism.
2.0 METHODOLOGY
The geometry of interest is the HPT of a ‘three-shaft’, civil, ‘large-fan’ engine. First of all, the adopted LS-DYNA FEA modelling approach is verified using a steel bar, ‘continuous-drive’, friction welding experiment. Subsequently, the FEA methodology is applied to a post shaft failure simulation. The boundary conditions for the FEA simulations are generated using integrated, analytical, turbine performance and friction models, and the results are compared against each other. After obtaining agreement between the FEA and analytical approach, the integrated analytical formulations are used in a design exploration study. The target of the study is to extract those key factors affecting turbine behaviour in case of excessive axial movement and overspeed conditions, post shaft failure. More specifically, one of the stationary components in the turbine assembly is parameterised for design space search. This stationary element is a knife seal which experiences disk rubbing after failure and excessive axial movement by coming into contact with the retention plates of the free running turbine rotor. Design parameters of interest are the area and the radius of the knife seal. A set of simulations are carried out with the integrated analytical performance and friction tools to find the response of the rotor in terms of overspeed and axial dislocation.
2.1 LS-DYNA verification against welding experiments
‘Continuous-drive’, friction welding experiments of two steel bars were published by Bahrani and Duffin( Reference Bahrani and Duffin 16 ) and Bahrani et al( Reference Bahrani, Healy and Mcmullan 17 ) in terms of axial shortening rate, equilibrium torque, coefficient of friction at the welding interface and width of plastically deformed region. They also presented the derived interface temperatures and metal viscosity according to their calculations.
Continuous-drive friction welding is a metal bonding process including four phases where the speed of the rotary specimen is controlled by the direct drive. In the first phase, a rotating specimen is accelerated by a direct drive and pushed against a stationary piece. The temperature of the friction interface increases during this phase. In the second, axial shortening of the welded specimens starts. The removed material is centrifuged in the radial direction and this is called radial upsetting. The third phase is the equilibrium phase where the rotational speed, axial force, friction torque at interface, interface temperature, axial shortening and radial upsetting ideally remain constant. In the fourth phase, the rotating specimen is brought to rest and the axial forging continues to ensure the weld quality.
In this study, the LS-DYNA FEA verification is done at the equilibrium phase, and the simulation results are compared against reported experimental values. The welded rods have an inner diameter of 12.7mm and an outer diameter of 19.0mm( Reference Bahrani and Duffin 16 , Reference Bahrani, Healy and Mcmullan 17 ). The axial length of the each welded rod is 40.0mm in the FEA model. Three models with different mesh densities are used, namely, Mesh 1, 2 and 3. Total numbers of elements are 15,360, 19,200 and 28,800 for each rod, respectively. The different parameters in the mesh size are the length of the elements in the axial direction near the welding interface. Mesh 1 has four units of element axial length. Mesh 2 has two units, and Mesh 3 has one unit of element axial length. After a predefined distance from the friction interface, the element length increases as illustrated in Fig. 3(a). The mesh density in the radial direction is the same for all three cases and is given in Fig. 3(b). Figure 3(c) describes the process where one element is rotated and forged into a stationary element.
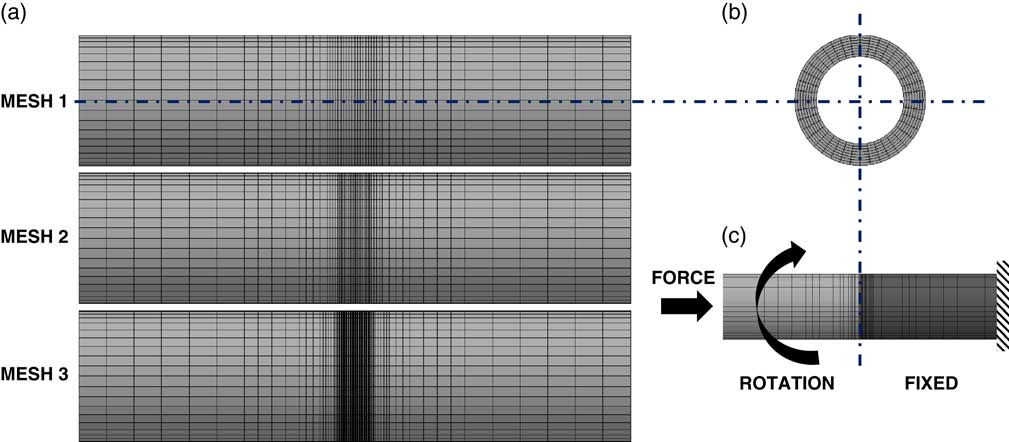
Figure 3 (Colour online) Finite element model of the steel bar friction welding experiment. (a) Three different meshes from front view, (b) side view of all three meshes and (c) Description of the friction welding.
The material model used in the FEA computations is the ‘Johnson–Cook’. This material model is composed of two parts, namely the constitutive and the damage model. The constitutive model provides an approximation to the yield strength of the material, and the damage model provides the effective plastic strain at failure. The failure strain represents a cumulative damage on a structure. The material model also includes the effects of the temperature and strain rate in the constitutive and damage models, respectively. The properties of steel are reported by Johnson and Cook( Reference Johnson and Cook 18 ).
A ‘thermal–structural’ calculation is invoked in LS-DYNA. The rotating bar is modelled with rigid solid elements, and the static bar is modelled with deformable solid elements. Before the simulation of the equilibrium phase in the steel bar welding experiment, the one-dimensional transient temperature distribution across the rod is calculated by an explicit finite difference calculation. The obtained temperature distribution across the static steel rod is given as an initial condition to both rods at the beginning of the equilibrium phase simulation. A prescribed rigid body rotation is given to the rotating bar, with an initial angular speed, and this is then pushed against the static bar with constant axial force. Between the rotating and the static components, the ‘eroding surface to surface’ contact is defined. Metallographic examination of the interface region for the investigated experimental conditions showed that the deformation of the rotating and static parts is symmetrical in the axial and radial directions( Reference Bahrani and Duffin 16 ). Using the rigid formulation for the rotating bar, the ‘symmetry’ condition dictates that the simulated axial shortening rate will be half the experimental value, since only the deformable elements will erode. This is done to simplify the model and reduce the associated computational cost.
During the FEA simulation, the eroded elements are removed from the computation and there is no formation of radial upsetting. The axial displacement of the rigid rotating bar is plotted in Fig. 4. The slope of the axial displacement is the axial shortening rate. In Fig. 4, the slope of the straight full lines represents the experimental axial shortening rate at 16,000N axial force and 416.4 rad/s angular speed. The dashed lines are the obtained trajectories in time of the simulated rotating specimens. The trajectories of Mesh 2 and Mesh 3 are shifted in the y-axis direction for illustration purposes. The effect of mesh size on displacement in the axial direction can be clearly seen. Every step movement occurs with the deletion of a mesh row. Mesh 3, which has the highest density and friction interface, shifts from the experiment value by about 5% at around 0.2s. Since the mesh is only increased in the axial interface, the aspect ratio becomes higher having a value of 4. The other meshes have aspect ratios of 2 and 1 for Mesh 2 and Mesh 1, respectively. The numerical procedure can be improved by keeping the element density high, while keeping the element aspect ratio close to 1. The reproduction of the results and the good agreement with the experimental observations allowed for the simulation methodology to be subsequently used in the post shaft failure simulation of unlocated turbines.
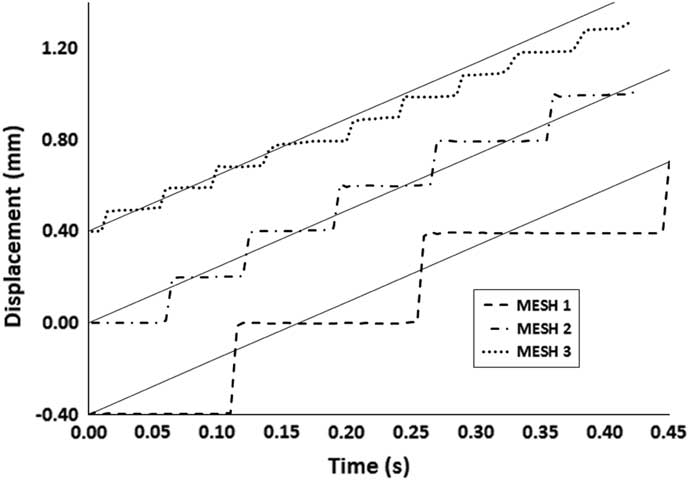
Figure 4 Axial displacement of the left steel bar for the three meshes.
3.0 APPLICATION OF METHOD TO TURBINES
The application of the FEA methodology to unlocated turbine shaft failure requires additional effort. During the event, the gas torque will accelerate the turbine wheel. Since the turbine is decoupled from the compressor and is free to move axially due to the bearing arrangement, the pressure difference between the upstream and downstream sides of the turbine will push the turbine rearwards. In this study, the axial force is calculated from the pressure difference across the turbine disk and flow path areas. An analytical performance model is used to define the transient evolution of pressures across the turbine during the event. The performance model is also coupled with a friction model to define the counter torque which acts against the gas torque. The rate of axial dislocation is also calculated by the friction model. The time evolution of the gas torque and the axial force is used as boundary conditions in the LS-DYNA computations. Further details on the analytical performance and friction models are given in the following paragraphs.
3.1 Performance model: Axial load and gas torque on turbine
The axial load on the turbine wheel depends on various aerodynamic and mechanical factors during the post shaft failure. These factors can be listed as compressor performance, secondary air system response and turbine performance.
Handling of the complete event requires a sophisticated transient model and in this study, for design purposes, a reduced order approach with simplifying assumptions is used to calculate the turbine torque and the axial force acting on the wheel. Therefore, an atmospheric discharge of the gas at constant turbine entry temperature is considered. Then, the turbine performance calculations are carried out using a ‘mean-line’ analysis.
Using a time-varying total pressure at the turbine inlet, the axial load and the gas torque are calculated for each time step. The total pressure evolution at the inlet of the turbine rotor is given in Fig. 5. The decay also includes the presence of compressor pulsation which can be seen as the difference between the full and dashed lines. It is possible that there will be partial or full recovery of the compression system after a shaft failure event which might continuously provide HP gas at the turbine inlet at a reduced level( 1 ). The assumptions for the performance calculations are listed below:
∙ Discharge of the gas from combustor at constant temperature.
∙ The turbine total to total pressure ratio and efficiency are constant.
∙ The effect of cooling mass flow rate is not taken into account in continuity.
∙ The flow enters to the rotor row with zero incidence and exits with zero deviation.
∙ The upstream turbine disk cavity is at the same pressure with the upstream gas path.
∙ The downstream turbine disk cavity pressure is equal to the downstream gas path.
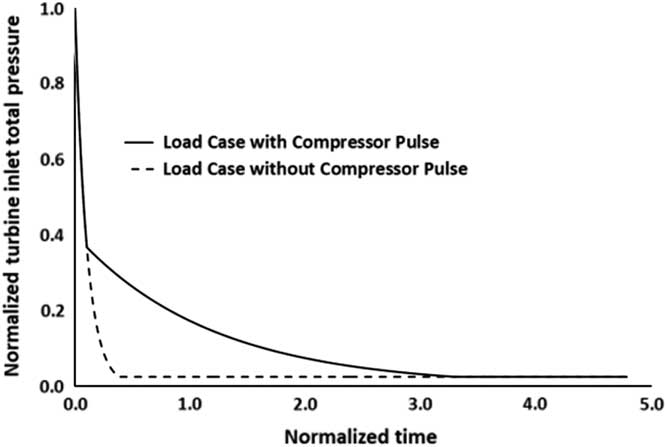
Figure 5 Discharge of gas from upstream combustor reservoir.
During intact operation, the gas path is sealed from the disk cavities in order to minimise leaks. However, with the dislocation of the turbine, the seals open at the front of the disk to equalise the pressures between the gas path and the disk cavity. At the rear of the disk and with the movement of the disk, the air will be kept sealed and will maintain its HP level or the damaged seals will allow the equalisation of the pressures between the gas path and the rear disk cavity. This condition requires a transient modelling of the secondary air system. According to the conditions mentioned above, the disk cavities are assumed to be at the same pressure with the gas path without loss of generality.
Haake et al( Reference Haake, Fiola and Staudacher 15 ) plotted the change in turbine inlet total temperature as a function of time during turbine dislocation. Assuming a reference temperature of 1,000K, the difference between the turbine inlet temperature at the beginning and at the end of the event will be in the order of 100–300K. However, the turbine inlet temperature is also a function of the engine control system which shuts the fuel flow after the detection of the shaft break. Additionally, the turbine performance is affected by the dislocation which may drastically increase tip clearance losses if the flow path has a high hade angle. Moreover, during the event, the axial velocity of the flow entering the stage should be expected to be either constant or decreasing. However, with the increase in the rotational speed, the velocity triangles are heavily distorted to result in the decrease of turbine expansion and efficiency. The simplifying assumptions in the model can lead to discrepancies from a real event; however, these assumptions can be considered as a worst-case scenario making the methodology applicable for a structural design study.
3.2 Friction model
The contact between the rotating turbine wheel and stationary components involves disk rubbing and blade interference. The frictional torque at the contact interface is calculated by a friction clutch approach. The pressure is assumed to be constant across the contact surface and the corresponding frictional torque is calculated.
The calculation of the axial dislocation rate of the turbine is based on the application of a solid melting process, as introduced in shaft failure modelling by Gonzalez( Reference Gonzalez 19 ). The solid melting process was proposed by Carslaw and Jaeger( Reference Carslaw and Jaeger 20 ).
By neglecting radiation and surface convection, a 1-D heat transfer is assumed (Equation (1)). The flux term in Equation (2) includes a conductive and a convective term for the heat flow. The heat is generated at the interface by friction. Due to the high turbine end load after the shaft break and the high rotational rubbing speed, the large frictional power heats up the frictional interface to the melting temperatures rapidly. Based on this condition, a quasi-steady temperature distribution is assumed. By inserting Equation (2) into Equation (1) and removing the transient term (Equation (3)), the steady temperature distribution is given in Equation (4) with the boundary conditions which are given by Equations (5)–(7). The frictional power per unit area is given in Equation (8), where the first term is the friction torque which acts against the gas torque to arrest turbine overspeed:
 $${\rm \rho }.c.{{\partial T} \over {\partial t}}{\plus}{{\partial ({\rm flux})} \over {\partial x}}{\equals}0$$
 $${\rm flux}_{x} \;{\equals}\;{\minus}k{{\partial T} \over {\partial x}}{\plus}{\rm \rho }.c.T.V$$
 $${{\partial T} \over {\partial t}}\;{\minus}\;{k \over {{\rm \rho }.c}}.{{\partial ^{2} T} \over {\partial x^{2} }}\;{\plus}\;V.{{\partial T} \over {\partial x}}\;{\equals}\;0$$
 $$T\;{\equals}\;T_{s} \;{\plus}\;\left( {T_{m} \;{\minus}\;T_{s} } \right).{\rm e}^{{{{{\minus}V.x.\rho .c} \over k}}} $$
 $${\minus}k{{\partial T} \over {\partial x}}\;{\equals}\;q_{{\rm \rmu }} \;{\minus}\;{\rm LHM}.{\rm V}\,@\,x\;{\equals}\;0{\rm }\left( {{\rm friction}\,{\rm interface}} \right)$$
 $$T\;{\equals}\;T_{m} \,@\,\,x\;{\equals}\;0{\rm }\left( {{\rm friction}\,{\rm interface}} \right)$$
 $$T\;{\equals}\;T_{{{\rm solid}}} \,@\,x\to\infty$$
 $$q_{{\rm \rmu }} \;{\equals}\;\left( {F.R.{\rm \rmu }} \right).{\rm \romega }.{1 \over A}$$
With the continuous centrifugation of the molten material from the interface, the flux into the solid is zero. The analytical expression is obtained by inserting Equation (4) into Equation (5) to calculate the movement of the frictional interface which is given in Equation (9). The term β in the velocity equation represents the heat partition between the surfaces that are in contact. Barber( Reference Barber 21 ) provided an expression for the heat partition based on the thermal properties of contacting structures. The latent heat per unit volume (J/m3) is given with the LHM parameter. The frictional torque and the gas torque are then used to calculate the rotational speed by explicit time integration with the information of rotor inertia and the turbine gas torque (Equation (10)):
 $$V\;{\equals}\;{{\left( {1{\minus}{\rm \beta }} \right)} \over {\left( {{\rm \rho }.C_{p} .\left( {T_{{{\rm melt}}} \;{\minus}\;T_{{{\rm solid}}} } \right)\;{\plus}\;{\rm LHM}} \right)}}.{{F.R.{\rm \rmu }.{\rm \romega }} \over A}$$
 $${\rm \romega }^{{t\;{\plus}\;1}} \;{\equals}\;{{\left( {{\rm Torque}_{{{\rm gas}}}^{t} \;{\minus}\;{\rm Torque}_{{{\rm friction}}}^{t} } \right).{\rm Inertia}} \over {{\rm \Delta }t}}\;{\plus}\;{\rm \romega }^{t} $$
Assuming the rotor wheel rigid and considering 100% erosion of the static part, contact area and contact radius values can be obtained at each axial position by translating the rotor body in a CAD tool. The analytical friction formulation starts with establishing contact radii and contact areas for each axial displacement. These values are then interpolated during the analysis. The axial force and the torque acting on the turbine are calculated through a ‘mean-line’ analysis. During the implementation of the velocity equation, the disk is assumed to move at a speed that matches that of the contact regions where there is disk rubbing. In the case of multiple contacts, the net force across the turbine wheel is distributed proportionally to the areas, and the minimum velocity coming from the simultaneous contacts is considered as the disk velocity. By calculating the frictional force and the torque, the new rotational speed for the next time step can be calculated from momentum and inertia. The axial load and the gas torque are taken as boundary conditions from the analytical formulation. They are applied with a time curve in the FEA simulations.
3.3 Turbine finite element model
A ‘thermal–structural’ solution is applied in LS-DYNA for the simulation of the contact between the rotor and the downstream components. During the event, the temperature of the contact interfaces increases. The failure strain limit is reached due to the nature of the impact and also due to the reduced material strength at high temperature. The material model used in the FEA computations is the ‘Johnson–Cook,’ and Inconel 718 material properties are defined for all parts. The four main contact regions between the turbine wheel and the downstream stationary components are illustrated in Fig. 6(a). In Region 1, blade to NGV flow path contact and blade shank platform to NGV flow path contact occur. Region 2 shows the contact between rotor retention plate and the stationary knife seal component. In this region, the rotor has an axial seal arm extension. The knife edge seal and the seal arm provide sealing of the gas path from the lower space. Region 3 shows the contact between the seal elements and downstream support structures. The seal arm in this area has two extensions which point vertical and horizontal directions. Region 4 includes contacts at the shaft assembly. Due to the radius, contacts in this region have the lowest frictional torque capacity in terms of overspeed reduction.
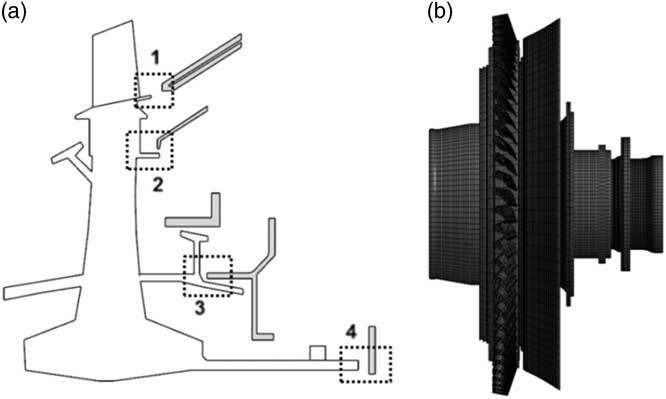
Figure 6 (a) Four main contact regions in the turbine assembly and (b) front view of the finite element model.
The finite element model of the turbine assembly has 288,000 solid elements. The rotating turbine wheel is composed of blades, disk, upstream drive arm, retention plates, seals and downstream shaft. All these parts are modelled as rigid bodies. The downstream components are NGV inner annulus platform, knife seal and seals, all modelled as deformable bodies. The rigid assumption of the HPT wheel is consistent with the full downstream component erosion assumption of the CAD analysis and friction model. This assumption brings an advantage in friction model – FEA consistency. Additionally, the assumption reduces FEA computational cost since there is no ‘stress–strain’ calculation in rigid elements. Considering a similar simulation duration, finite element model aspect ratios are kept close to 1 for the turbine simulations using friction welding analogy.
For the ‘thermal–structural’ analysis, a ‘time-dependent’ axial force and gas torque are applied to the turbine wheel, a uniform initial temperature is applied to all parts and an initial angular speed to the rotating parts. The turbine assembly FEA model is illustrated in Fig. 6(b). An ‘eroding surface to surface’ contact is defined between the rotor and the downstream components.
3.4 Turbine overspeed simulation results
Figure 7 compares the LS-DYNA computations against the results obtained from the integrated analytical tool. Results are plotted in terms of axial dislocation and rotor acceleration. The axial dislocation of the turbine rotor alone is not enough to prevent overspeed. The effect of this is indirect. It is an indication of how fast the turbine wheel reaches a certain axial position. If the contact path during the axial movement has an increasing radius, a fast turbine dislocation will generate a larger frictional torque to prevent excessive acceleration. Additionally, if the turbine moves faster, blade interference will take place earlier. Blade interference is important since it promotes friction, and the destruction of the blades will reduce the efficiency and torque generated by the turbine.
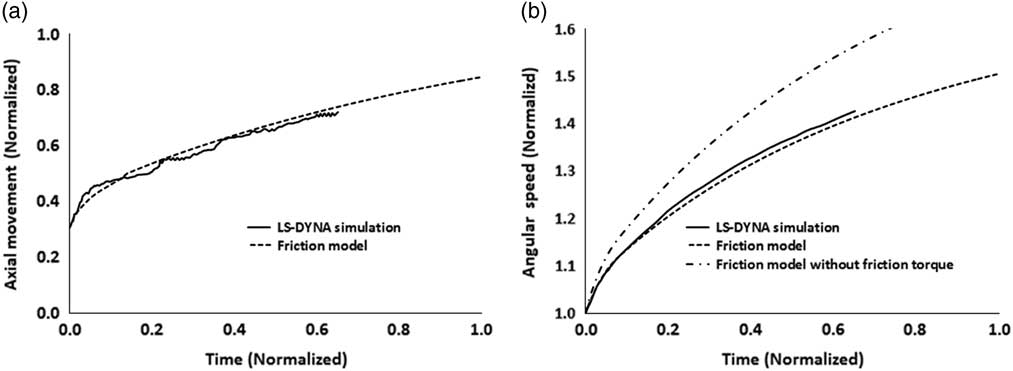
Figure 7 Turbine post shaft failure simulation. (a) Rotor displacement and (b) rotor acceleration.
As mentioned before, in this study, mechanical damage effects are ignored, and the turbine performance is considered unaffected throughout. The effect of friction on overspeed can be seen in Fig. 7(b) where the actual acceleration is compared against frictionless acceleration. A very good qualitative and quantitative agreement can be observed between analytical and numerical results, with the lower-order model producing very similar results to the higher-fidelity, 3D FEA tool.
Results are plotted using a normalised time scale of 1. This is the time when the axial mechanical friction methods should take place effectively as the axial load drops below 15% of the initial load. Within the time period until the turbine end load drops to 50% of the initial, modern engine protection methods like fuel shut off, which are based on sensor detection, have enough time to operate. However, since the analytical model does not consider the mentioned control system effects, it simply tracks the overspeed curve. At two time units, the acceleration curve smoothly reaches a plateau of around 1.55 angular speed units.
3.5 Design space exploration of a stationary seal element
After the comparison of the analytical and finite element models, a design space exploration was conducted. The coupled analytical performance and friction tool allows for a faster and easier study of the various design attributes, compared to the full 3D FEA simulation.
According to the 2nd region as illustrated in Fig. 6(a), the contact radius and area of the knife seal, as it rubs against the turbine wheel, are defined as variables. These variables are changed parametrically, and the obtained geometries are compared against each other in terms of turbine terminal speed, turbine dislocation rate and the stationary component mass. Figure 8 illustrates the entire design space considered. The horizontal axis shows the mass change of the redesigned knife seal component with respect to the baseline geometry. The vertical axis shows the change in contact mean radius between the rotor and the knife seal. The plotted contact mean radius increase corresponds to the value at the edge of the knife seal for each individual design. So it is the value at the initial contact point. However, during the entire analysis, the contact radius changes with the dislocation. Every line plotted represents an isoline of change in terminal speed with respect to baseline.
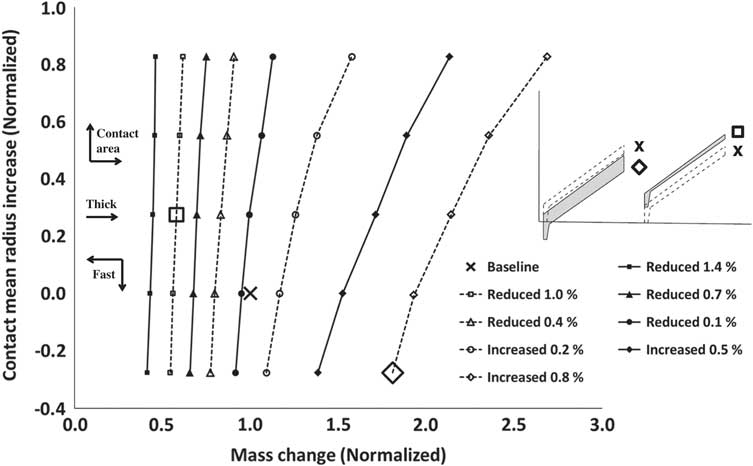
Figure 8 Design space of rotor post shaft failure behaviour by speed isolines with sample geometries.
Apart from the parameters which are given as the radius at the initial contact point, mass and the rotor speed, the arrows are given for qualitative information for the contact area, thickness and the dislocation rate. With increasing contact area and radius, the mass of the knife seal geometry increases. Additionally, the material removal rate, which is also the dislocation rate, decreases. Due to reduced velocity, the contact radius does not increase enough, so the terminal speed with respect to the baseline increases in this case. For the same contact mean radius, if the contact area decreases, the rotor dislocates faster and the contact interface sees higher radii values. This condition also implies that the stationery component becomes thinner. For this reason, the terminal speed is reduced moving towards the left-hand side (on the x-axis).
The reduction in terminal speed is a desired outcome. However, the decreased thickness of the stationary component may raise integrity problems during nominal engine operation. So the reduced area and the dislocation rate act in the opposite sense, and hence, the component needs to be optimised considering the different ‘trade-offs’. Illustrative thick and thin configurations and their respective positions within the design space can also been seen in Fig. 8.
An interesting observation, based on the results obtained, is the location of the baseline configuration on the ‘performance chart’ shown in Fig. 8. The speed lines start to become more vertical after a certain value of knife seal mass, moving from right to left. The baseline configuration is located at a position where it is not possible to have a further reduction in mass while moving on the same terminal speed isoline. This implies that if an integrity issue arises related to the thickness of the knife seal, any further thickness increase for the same terminal speed, will require a drastic change (increase) in terms of knife seal radius. Also, the radius of the knife seal has a counterpart on the disk side which is the retention seal arm, as sketched in Region 2 of Fig. 6(a). The increase in radius of the knife edge seal will require significant changes to the disk design. However, when the first line from the right in Fig. 8 is considered, a thickness increase is quite possible without a change in terminal speed. So according to the parametric study, the location of the baseline design on the performance chart can be considered to be at the limit of any further potential improvement from a terminal speed reduction point of view.
About the use of the same material in the contact analyses, one should note that the use of different materials can change the frictional behaviour and the wear characteristics. A lower strength material can fail sooner than a higher strength material or difference in thermal properties may lead to a temperature distribution to soften one material more than another. The honeycomb seals or other stationary components can be considered to be weak when compared to rotating parts, however, Soupizon( Reference Soupizon 22 ) gives an example of struts to be capable of cutting through the blades of a dislocating rotor to secure the disk from bursting. When different design features of the assembly are considered, assuming same materials provides a reasonable starting point for design purposes.
An experiment to characterise this extremely remote event is expensive, and an engine test would result in the complete destruction of the whole engine. On the other hand, modelling the dynamic response of the engine requires handling of the control systems, turbomachinery aerodynamics, combustor aerodynamics, secondary air systems and axial friction. With the verification of the individual sub-systems at intact engine conditions, a model that incorporates each of those sub-systems can be applied for the fully characterisation of the post failure event. Under these conditions, the experimental comparison becomes relevant; however, the integrated approach may still need an experimental correction since a real unlocated event also includes distinct characteristics from the intact conditions like
∙ radial rubbing between parts due to severe vibration,
∙ ingress, purge or gas accumulation in the secondary air system and in the flow path which can potentially change the direction of the turbine end load, and
∙ deterioration of the turbine performance due to dislocation and the loss of aerodynamic shape by fracture.
For the sub-system verification, the friction modelling approach in this manuscript is supported by finite element modelling with a friction welding analogy which is similar to the structural interactions after a shaft break. As a future application from a modelling point of view, the friction can be calculated in an integrated approach which takes into account the whole engine dynamics. But primarily, the method can be used as a stand-alone design approach to exploit the turbine end load, which is the highest available source of load after a shaft break, in order to get a desired fail-safe outcome in the engine. This may include
∙ A redesign of parts to maximise friction up to the time when the control system takes action.
∙ A redesign of parts to prevent reduction of the turbine end load by potential gas accumulation at the rear of the turbine.
∙ A redesign of parts to maximise turbine dislocation for maximum turbine performance deterioration.
4.0 SUMMARY AND CONCLUSIONS
As mentioned previously, the novelty of this work lies in the development of a generalised modelling approach that can produce useful engine design guidelines to minimise the terminal speed of a free running turbine post shaft failure. The HPT geometry of a ‘three-shaft‘ civil, ‘large-fan’ engine is used as an example. The study considers the friction generated between rotating and stationary components as an overspeed prevention mechanism and involves an integrated performance and friction model to track the axial movement and acceleration of the turbine. The study is supported by ‘high-fidelity’, 3D FEA simulations to verify the aforementioned analytical model.
The study considers blade interference and disk rubbing conditions. A ‘continuous-drive’, friction welding experiment of two steel bars is simulated using FEA, as conditions after an unlocated shaft failure can be considered similar to welding. In both cases, the interface temperatures and the high axial forces result in softening, plastic deformation and melting of the material.
The comparison between the integrated model and LS-DYNA simulations revealed that the analytical method can be applied successfully in fast design space exploration tasks in order to investigate turbine behaviour. As a case study, the knife seal of an HPT geometry is parameterised to investigate impact on turbine terminal speed after shaft failure. It was shown that reduced seal thickness and reduced radius result in a faster rearward turbine movement. Since the geometry has an increasing radius, the fast movement increases the contact radius quickly which increases the frictional torque on the turbine. Since the seal component has a counterpart on the rotor side, the change in seal radius will also have a direct effect on disk design. Furthermore, any reduction in thickness to promote quick rubbing will need to be checked from an integrity point of view.
The study concludes that a successful ‘design for shaft failure’ will need to achieve the right ‘trade-off’ between terminal speed reduction and stationary component integrity, whilst also taking into account disk design complexities.
Acknowledgement
The authors would like to express their gratitude to Rolls-Royce plc for supporting this research and permission to publish the paper.


