NOMENCLATURE
- R a
-
profile average height (μm)
- R y
-
maximum peak-to-valley profile height (μm)
- R z
-
average maximum height of the profile (μm)
- S a
-
residual surface average height (μm)
- S y
-
maximum peak-to-valley surface height (μm)
- S z
-
average maximum height of the residual surface (μm)
- K t
-
stress concentration factor
- ρ
-
notch root radius (μm)
- v c
-
Cutting speed (m/min)
- f z
-
feed rate (mm/z)
- a e
-
radial depth of cut (mm)
- σ11
-
residual stress in cutting direction (Mpa)
- σ22
-
residual stress in the direction that perpendicular to the cutting direction (Mpa)
- |σrs |
-
mean value of residual stress (Mpa)
- Nf
-
low-cycle fatigue life
- HV0.05
-
micro-hardness (Mpa)
1.0 INTRODUCTION
Low weight, high specific strength and other excellent properties make titanium alloy Ti-6Al-4V have wide applications in manufacturing advanced engineering components, such as aero engine casing and impeller blade. Reliability and service life are particularly important for these components. As a consequence, the requirement of machining-induced surface integrity is upgraded. Furthermore, the relationship between machining-induced surface integrity and fatigue performance should be characterise for structural fatigue life optimisation design.
Surface topography introduces stress concentration on the free surface that accelerates crack initiation and propagation compared to a relatively smooth surface(Reference Cheng and Liao1). Two-dimensional roughness parameters, R a (arithmetic average roughness), R y (peak-to-valley height roughness) and R z (average peak-to-valley height), are always associated with fatigue performance(Reference Wang, Meletis and Huang2). All three parameters provide a simple and useful means of quantifying profile height distributions, but they should not be used on an individual basis for estimating fatigue performance. Therefore, it makes sense for the relationship between surface topography and fatigue performance of metals to be expressed in terms of stress concentration factor, K t (Reference Peterson3). Arola and Ramulu suggested a stress concentration factor, Kt = 1 + 2RaRy (ρRz )−1, where ρ is notch root radius(Reference Arola and Ramulu4). Fatigue life model based on K t is more accurate than that based on a single roughness parameter(Reference Yao, Wu and Jin5).
Having compressive residual stress is shown to have a positive effect on prolonging service life of the component, while tensile residual stress plays an opposite role(Reference Yakovlev6). Hence, it is important to obtain the compressive residual stress, and to explore the response relationship between residual stress and fatigue performance under different machining conditions. Zlatin and Field showed that the compressive residual stress is generated in gentle milling, while the tensile residual stress is always in abusive milling(Reference Zlatin and Field7). Sridhar et al. found that by increasing the cutting speed, more compressive residual stress was generated in milling IMI-834(Reference Sridhar, Devananda and Ramachandra8). Yet Guerville et al. drew quite the opposite conclusion that more tensile residual stress was found with increasing the cutting speed(Reference Guerville, Vigneau and Dudzinski9). It is difficult to obtain consensual conclusions due to the high uncertainty of the experimental process and the different properties of workpiece materials. Few researches in the current literature relate residual stress induced by peripheral milling of titanium alloy Ti-6Al-4V and its effect on fatigue performance.
Apparently relationships between microstructural features and fatigue performances of titanium alloys are hard to characterisedue to the fact that these alloys have an extremely complicated microstructure(Reference Leyens and Peters10). The microstructure of Ti-6Al-4V encompasses a large scale of grain size that can vary significantly under different cutting conditions. As a comprehensive characterisation of the microstructure of the surface material, micro-hardness can be used to characterise the effect of microstructural features on fatigue performance. Relevant researches showed that a certain increase in the hardness over a certain range helps to prolong the fatigue life of components on high cycle fatigue(Reference Sealy, Guo and Caslaru11-Reference Polasik14). Nevertheless, machining-induced surface integrity is crucial to fatigue cumulative damage in low-cycle fatigue. The role that variations in the Ti-6Al-4V micro-hardness have on variation in the low-cycle fatigue performance is not very well understood.
The goal of this work is to identify a relationship between surface integrity, milling process parameters and fatigue behaviour of Ti-6Al-4V. Three aspects are contained in the present study as follows: First, surface integrity including surface topography, residual stress, microstructure and micro-hardness was characterised in peripheral milling of titanium alloy Ti-6Al-4V; second, low-cycle fatigue performance of machined specimens was studied on the basis of the tension-tension tests; third, the effects of surface integrity factors (stress concentration factor, residual stress and micro-hardness) on fatigue performances were discussed.
2.0 EXPERIMENTAL WORK
2.1 Workpiece material
The material studied was α +β two phase titanium alloy Ti-6Al-4V, which was formed by the free forging and re-crystallisation annealing process. Microstructural features photographed by the Scanning Electron Microscope (SEM) is shown in Fig. 1, the original microstructure of the material, primary α grains as those that are lower in grayscale intensity and the lamellar α +β colonies as those areas higher in grayscale intensity. β phase was a boundary phase which was attached to the α matrix with a small amount. The volume fraction of β phase of as-received material is 13.5%, and the chemical compositions of both phases are listed in Table 1.
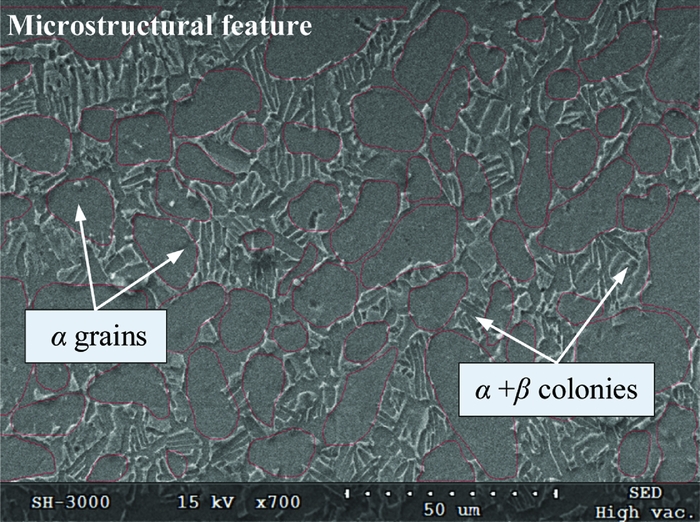
Figure 1. Microstructural feature of Ti-6Al-4V alloy studied.
Table 1 Chemical compositions of α and β phases of Ti-6Al-4V alloy studied

2.2 Specimen preparation
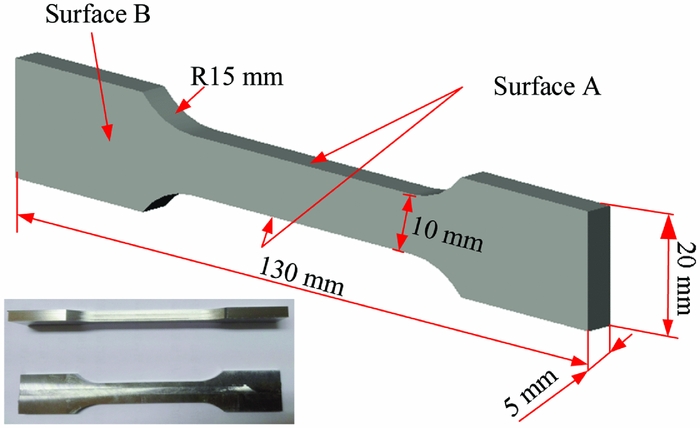
Figure 2 shows the sketch of the fatigue specimen. Surface A, the investigated surface, is machined using peripheral milling. The machining experiments were carried out on a vertical-type machining centre (DAEWOOACE-V500). Milling tools materials were cemented carbides with 4-flute tool with variable helix angles (38° and 41°). The diameter of the cutter was 6 mm. The milling mode was down milling. Each test specimen was machined with a new tool to exclude the impact of tool wear. The tests were performed with dry machining due to concern regarding the safety of the environment. Surface B is processed by end milling, grinding and polishing.

Figure 2. Sketch of the fatigue specimen.
In order to obtain different surface integrity of surface A, orthogonal experimental design method was applied, and 16 groups of experiments were carried out. Cutting speed v c, feed rate f z and radial depth of cut a e are given in Table 2.
Table 2 Orthogonal experiment table
2.3 Measurement of surface integrity
2.3.1 Surface topography
Surface topography of surface A was measured using an optical microscope KEYENCE VR-3000. The valuation area was set at 2.6 mm × 1.0 mm. 2D parameters of R a (profile average height), R y (maximum peak-to-valley profile height), R z (average maximum height of the profile) and 3D parameters of S a (residual surface average height), S y (maximum peak-to-valley surface height), S z (average maximum height of the residual surface) were studied. These parameters were taken at three locations and repeated twice at each location on the face of the machined surface, and then the average values were obtained.
2.3.2 Residual stress
For polycrystalline materials, corresponding macro strain of residual stress was considered to be the sum of lattice strain. As a consequence, residual stress can be calculated by measuring lattice strain on the basis of the Hooke's law and the theory of elastic mechanics. The X-ray diffraction method, which is based on the Bragg's law, expressed as Equation (1), is able to fulfill the task
 $$\begin{equation}
n\lambda = 2d\sin \theta ,
\end{equation}$$
$$\begin{equation}
n\lambda = 2d\sin \theta ,
\end{equation}$$
where n is an integer representing the order of diffraction, λ is the wavelength of x-ray, d is the interplanar spacing of crystal planes, and θ is the diffraction angle.
A Proto-LXRD diffractometer with Cu Kα radiation tube was used to measure the machining-induced residual stresses. Residual stresses of surface A were measured in two directions: parallel (σ11) and perpendicular (σ22) to the cutting direction in the machined surface. The testing standard is ASTME915-2010(15), using the sin2 ψ method, where ψ is the tilt angle of stress coordinates for normal direction of the diffraction plane. The basic testing parameters of the residual stress are listed in Table 3.
Table 3 Basic testing parameters of residual stress

2.3.3 Micro-hardness
Micro-hardness on and below the machined surface (Surface B) were measured using micro-hardness tester HVS-1000, and the test load was 0.05kg. Below the machined surface, measurements were taken at 20-μm intervals with a depth of 200μm. Five locations at each specimen were measured, and the average values were employed.
2.3.4 Microstructure
Mosaic block was made to identify the microstructural features on the machined surface (Surface A). Specimens were ground, polished, and then etched in 5 ml HNO3 (65% conc.) +3 ml HF (40% conc.) +100 ml H2O at room temperature for 10 seconds(Reference Sealy, Guo and Caslaru11). A SAE-3000M SEM was utilised to picture microstructures.
2.4 Fatigue test set-up
Stress-controlled low-cycle fatigue tests were performed on an Instron 8801 electro-hydraulic fatigue testing machine. Servo-hydraulic and servo electric machines were employed for the tests to generate a sinusoid waveform with a frequency of 20Hz. All tests were performed under constant amplitude force control at room temperature utilising a stress ratio of R = 0.1. The maximum stress was set to 1,000 MPa, which is slightly above the yield strength of as-received material Ti-6Al-4V at room temperature (894-903 MPa), and all fatigue tests were compliant with BS 3518-1:1993 (Method of fatigue testing). Tests were stopped when the specimen broke, and the tensile-tensile fatigue testing set-up and conditions are listed in Fig. 3.
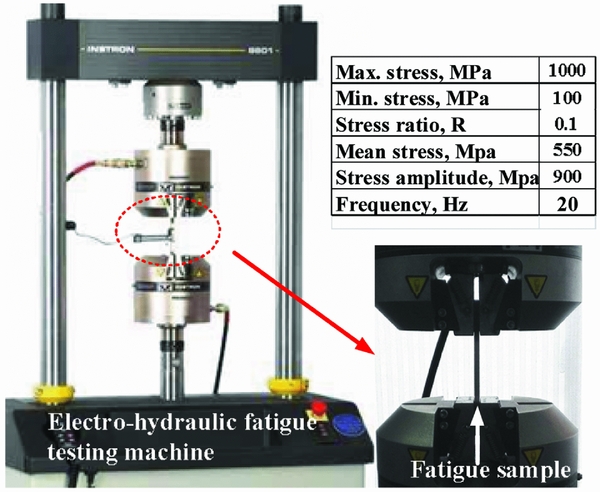
Figure 3. Tensile-tensile fatigue testing set-up and conditions.
3.0 RESULTS AND DISCUSSION
3.1 Surface integrity and fatigue performance
3.1.1 Surface topography
In Fig. 4, the surface topology induced by the peripheral milling can be observed. Uniform space ridges along the feed direction can be found. These ridges are caused by the relative movements of the cutter and specimen resulted in the final surface topography, which explicitly reflects the movement track of cutting edge.
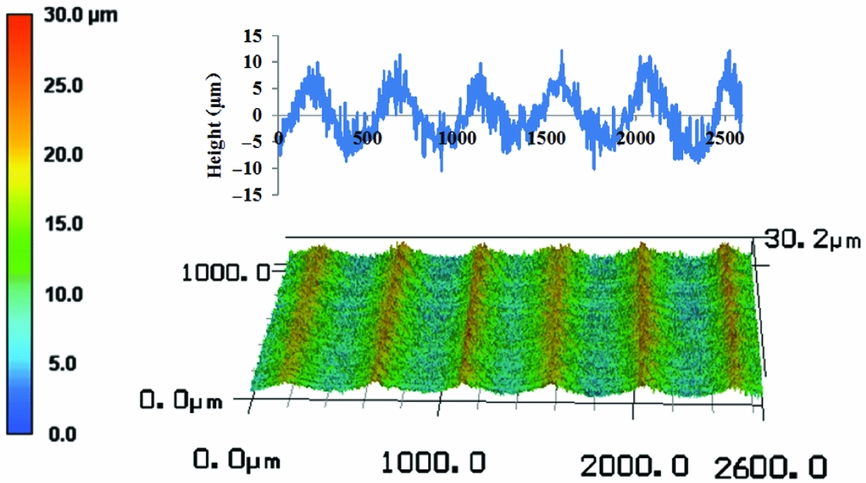
Figure 4. Features of surface topography induced by peripheral milling (vc = 50 m/min, fz = 0.05 mm/z, ae = 2.0 mm).
For the fact that the calculation process of 3D surface topography parameters considered more features of the machined surface, including surface defects as adhered material particles, tearing surface, and debris of microchips, etc. The magnitude of the 3D surface topography parameters is greater than the magnitudes of the corresponding 2D parameters. It was validated by Fig. 5, the effect of cutting conditions on machined surface roughness. In Fig. 5, it can also be found that 3D parameters showed almost the same trend as 2D parameters under different cutting conditions. Seen from Figs 5(a)–5(c), an increase of cutting speed caused a decrease of R a, R y, R z (S a, S y, S z). This is probably due to the fact that more cutting heat was taken away by chips and the built-up edge was reduced. The feed rate effect on the surface roughness value in Figs 5(b)–5(e) showed that it almost linearly increased with the increased feed rate. As for the effect of radial depth of cut in Figs 5(g)–5(i), surface roughness trends showed concave features, while convex for S z.
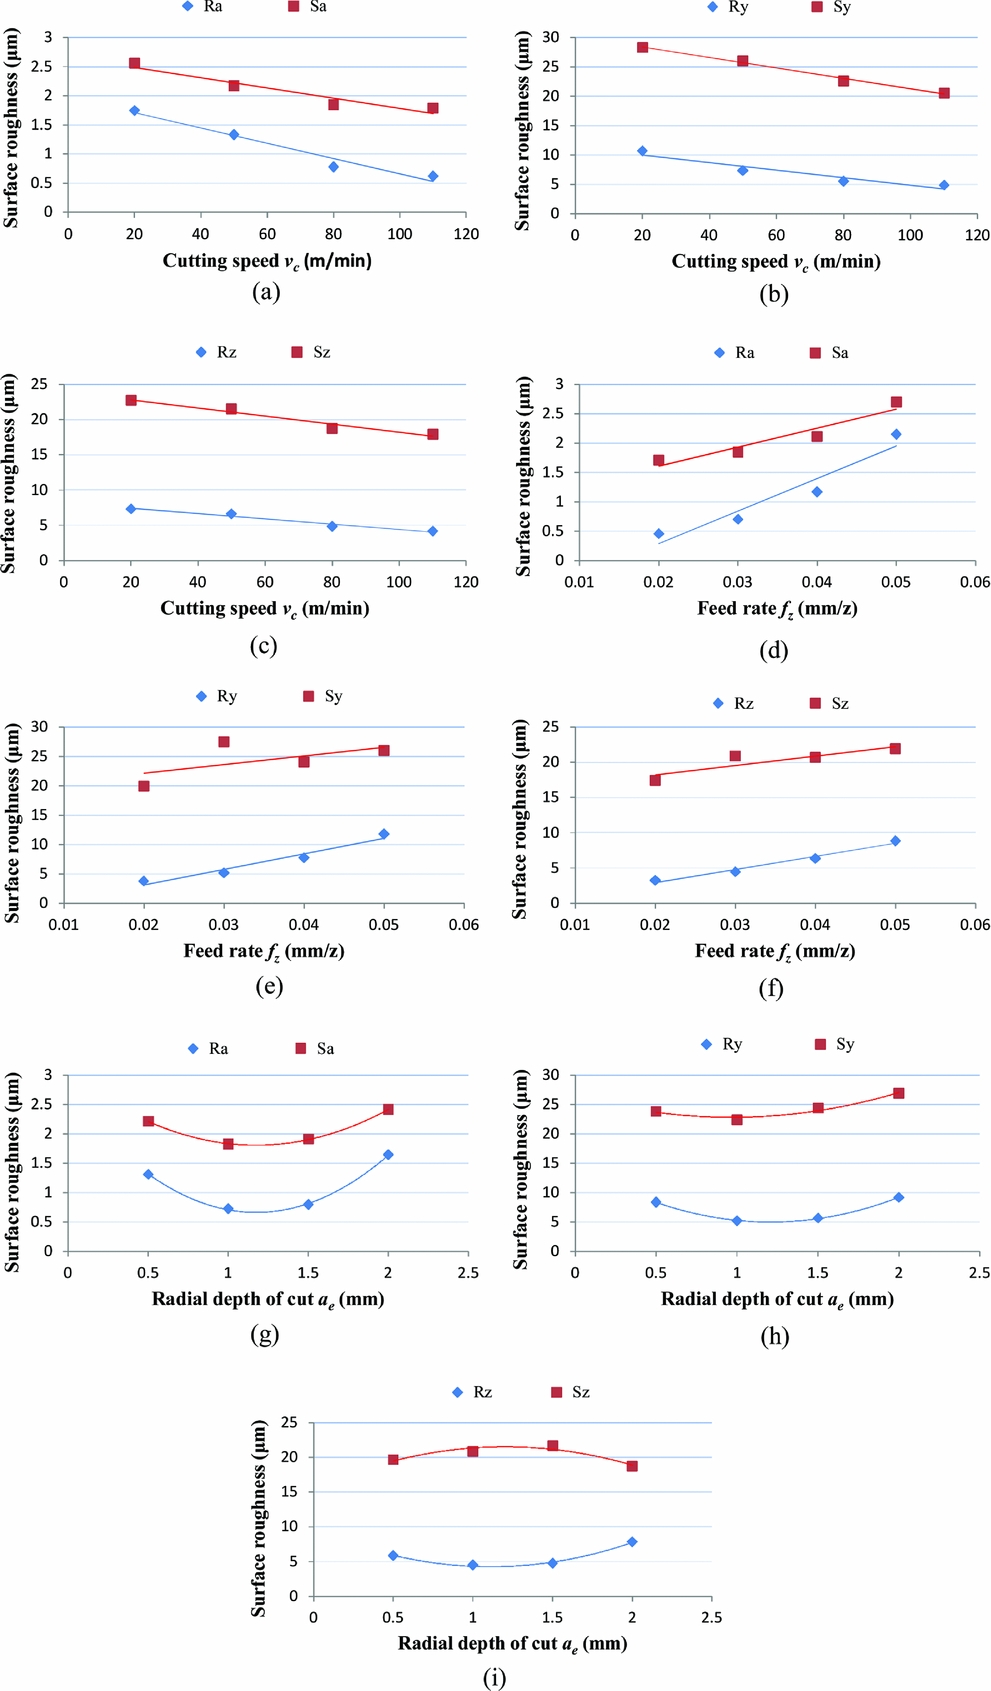
Figure 5. Effect of cutting conditions on machined surface roughness.
3.1.2 Residual stress
The degree of thermal and mechanical work associated with cutting is decisive of the residual stress form at the machined surface(Reference Sunder16). In the present study, residual stresses are compressive stresses at the machined surface. That is mainly because more mechanical work was generated during the machining process. In the case of the higher cutting speed and feed rate, more heat is generated. As a consequence, the mathematical value of compressive stress will decrease. As shown in Fig. 6, the response relationships between surface residual stress and cutting conditions, residual stresses in length and thickness directions present almost the same trend with the variation of cutting conditions. Increasing the cutting speed and feed rate decreases the magnitude of the values of the compressive stress, while the radial depth of cut had no obvious effect on the magnitude of compressive stress. It can also be seen in Fig. 6 that there are large standard deviations in residual stress measurements and four main kinds of errors such as calculation error, sample acceptance error, instrument measurement error, and operation error are responsible for this phenomenon. In order to reduce the influence of test errors on the reliability of fatigue analysis results, the average value of the measured residual stresses was applied in the study.
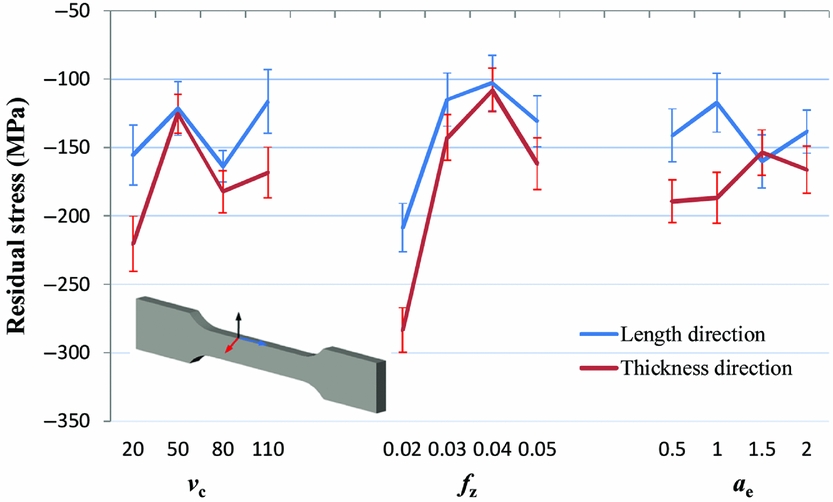
Figure 6. Response relationships between surface residual stress and cutting conditions.
3.1.3 Micro-hardness
Due to the mechanical effect and the heat generation at the shear zone, work-hardening combining with surface-softening occurred on the machined surface at the same time. However, it is unable to define the extent of the hardening and softening effect according to the existing literature. Under the conditions of the present study, obvious work-hardening was observed on the machined surface. Hardening rates were in the range of 13.6% to 43.4%. Figure 7 shows micro-hardness profiles below the machined surface of partial specimens.
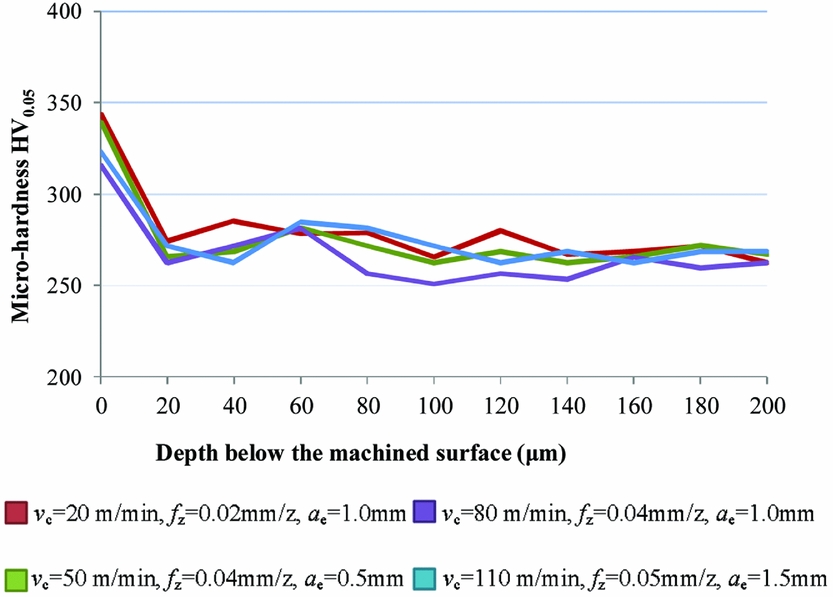
Figure 7. Micro-hardness profiles below the machined surface.
3.1.4 Microstructure
In the aspect of microstructural features of machined Ti-6Al-4V, lamellar α +β colonies were regarded as a unit. And then profiles of α phase were picked up using Image-Pro-Plus software. Size distribution and average diameter of α grains were evaluated.
Figure 8 shows the microstructures and α grain size distributions of the original material and the machined surface under different cutting conditions. α grain diameters of the original material ranged from 6 μm to 24 μm, and the average value is 11.7 μm. Grain refinement of α grain was noticed at the machined surface under different cutting conditions. The grain refinement rate, which is defined as the ratio of grain size changes to the initial grain size, under the cutting condition of (b), (c) and (d) in Fig. 8 were 30.34%, 29.1% and 27.35%, respectively. Meanwhile, with the decrease in the size of α grain diameter and the increase in the number of α grain, the volume fraction of the boundary phase (β phase) was found increased through visual observation.

Figure 8. Microstructure and α grain size distribution of the original material and the machined surface.
Based on the orthogonal experimental analysis method, the response relationships between the grain refinement rate and the cutting conditions were obtained in Fig. 9. In the range of experimental parameters, the α grain refinement rate decreased distinctly with the increase of cutting speed but slightly increased with the increase of the feed rate. The parameter of the depth of cut played an opposite role in increasing the grain refinement rate.
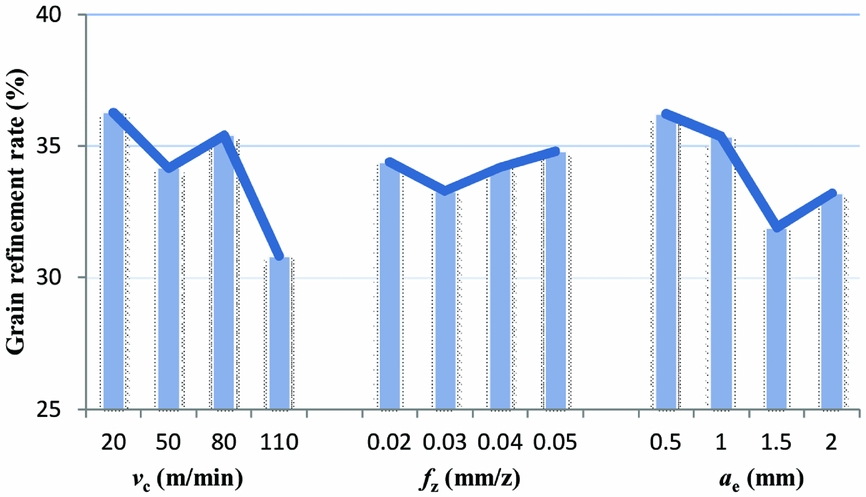
Figure 9. Response relationships between α grain refinement rate and cutting conditions.
3.1.5 Low-cycle fatigue performances
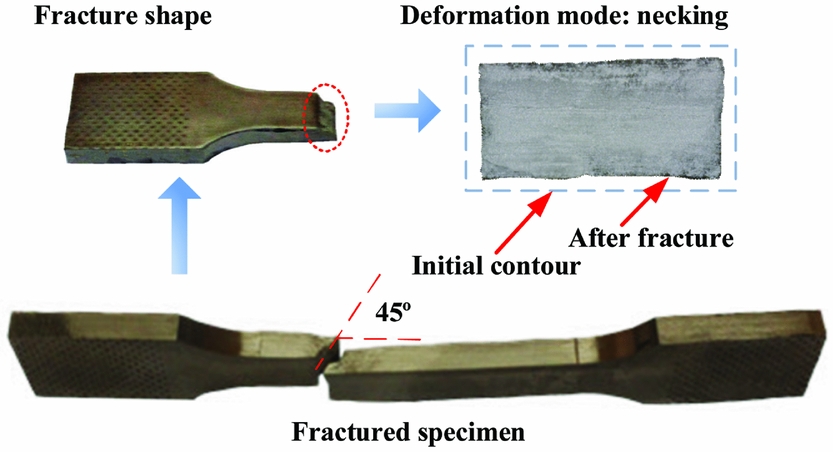
For all the specimens studied, the numbers of cycles to failure were in the range of 2,510 to 8,141. Forty-five-degree shear fracture surfaces were formed on the fractured specimens. That is because the slip systems are in the best orientation on these surfaces. The main deformation mode of the test specimens is necking, and the reduction ratio of areas was up to 30.2%. All these phenomena were shown in Fig. 10.

Figure 10. Features of the fractured specimen.
Figure 11 shows the typical macroscopic fracture morphology of Ti-6Al-4V under tensile-tensile fatigue tests. High alternate stress in the low-cycle fatigue tests caused the fatigue crack size to quickly reach the critical value and produced an instantaneous fracture. As a consequence, the crack propagation region was not large, and there was not a sharp division between the fatigue crack source region and the crack propagation region. In the mixed region of crack source and propagation, multi-sources were observed, and multiple stress concentration is the main reason for this phenomenon.

Figure 11. Macroscopic fracture morphology of Ti-6Al-4V.
Figure 12 shows the typical microscopic fracture morphology of Ti-6Al-4V under tensile-tensile fatigue tests. The fatigue-crack source region is the earliest fracture, where crack propagation rate is slow. Repeated friction occurred during the crack opening and closing with loading cycles in this region. As a consequence, the fatigue-crack source region looks neat and smooth. Moreover, slip lines and elongated dimples were observed in the mixed region of crack source and propagation. Breaking region showed the transient characteristic of the static load. Equal-axis dimples were finally generated on the fracture surface.
Figure 12. Microscopic fracture morphology of Ti-6Al-4V.
3.2 Influence of surface integrity on fatigue performance
Stress concentration factor Kt , mean value of residual stress |σ rs | and micro-hardness HV0.05 were selected as the three main factors to evaluate the influence of surface integrity on low-cycle fatigue life, Nf . Details of these factors are listed in Table 4.
Table 4 Surface integrity factors and fatigue life data
Based on the surface integrity factors and fatigue life data, the response curves between Kt , |σ rs |, HV0.05 and Nf are shown in Fig. 13.
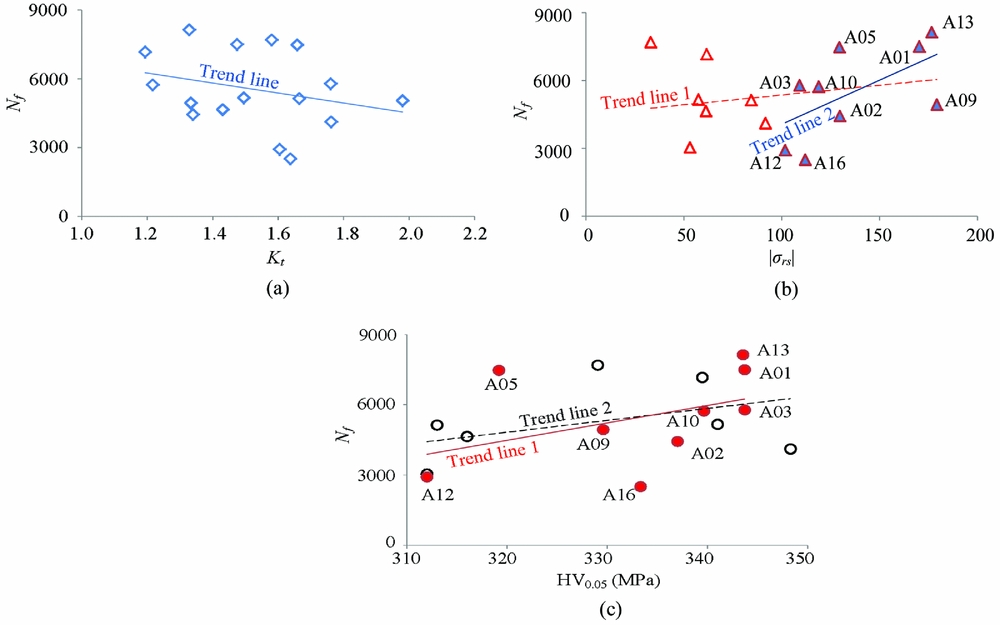
Figure 13. Response curves between Kt , |σ rs |, HV0.05 and Nf .
Under high alternate stress of the low-cycle fatigue tests, plastic deformation occurred and strain superimposed gradually (Ratchet effect) on the material surface. As a consequence, the influence of surface topography on the fatigue performance is changed from stress concentration to strain concentration, and the influence of the stress concentration factor on the low-cycle fatigue life is weakened. However, strain concentration on the surface of the specimen is the same as that in the stress concentration area, the stress concentration factor, which takes into account the characteristics of the surface topography, can also be used to reflect the state of strain concentration. Even if the degree of stress concentration is reduced, it still has an effect on low-cycle fatigue performance. Figure 13(a) shows that fatigue life decreased slightly with the increase of the stress concentration factor Kt .
The residual stress state induced by machining plays a dominant role in extending or shorting the fatigue performance of metallic materials, while residual stress relaxes significantly or even completely under high-loading conditions and the effect on the fatigue performance is weakened or disappeared. According to the relaxation criterion, the residual stress will be relaxed only when the total load, which is the superposition of the maximum value of the alternating load and the residual stress value, is greater than the yield limit of the material. As seen from Table 2, part of the specimen is under the alternating loads to meet the stress state of the residual stress relaxation conditions and there is also a part of the specimen without relaxation due to the large residual stress, such as specimen A01, A02, A03, A05, A09, A10, A12, A13 and A16. As shown in Fig. 13(b), the fatigue performance of the fatigue specimens with the occurrence of residual stress relaxation and no relaxation was different. For the specimens with residual stress relaxation, the residual stress has no significant effect on the low-cycle fatigue performance (Trend line 1), while for the specimens with no stress relaxation, the low-cycle fatigue life increases obviously with the increase of residual compressive stress (Trend line 2).
Micro-hardness is the result of the combination of strain hardening and thermal softening. It is also a comprehensive characterisation of the microstructure of the surface material. With the increase of the micro-hardness of the machined surface, the plasticity and toughness of the surface layer decrease, and the surface crack is suppressed. Even in the presence of micro-cracks on the machined surface, the increase of yield limit of the surface material makes the expansion of micro-cracks need more stress values and more cycles. Therefore, the increase of micro-hardness will lead to the improvement of the fatigue life. Under the high alternate stress of low-cycle fatigue tests, for the plastic flow of the surface material, the effect of micro-hardness on the low-cycle fatigue life is not significant, as described by trend line 2 in Fig. 13(c), and the improvement of micro-hardness can be improved for the specimen without residual stress relaxation, as described by trend line 1.
On the basis of the above analysis, the influence of the key factors of surface integrity on the low-cycle fatigue performance of the specimens can be divided into two cases: residual stress relaxation and no relaxation. According to the data of surface integrity and low-cycle fatigue life, the linear regression analysis method is used to establish the empirical model of low-cycle fatigue life in two cases:
Residual stress relaxation,
 $$\begin{equation}
{N_f} = {10^{2.2503}}K_t^{ - 1.3779}HV_{0.05}^{0.6851}
\end{equation}$$
$$\begin{equation}
{N_f} = {10^{2.2503}}K_t^{ - 1.3779}HV_{0.05}^{0.6851}
\end{equation}$$
 $$\begin{equation}
{N_f} = {10^{ - 6.7537}}K_t^{ - 0.4113}{\left| {{\sigma _{rs}}} \right|^{1.0839}}HV_{0.05}^{3.2069}
\end{equation}$$
$$\begin{equation}
{N_f} = {10^{ - 6.7537}}K_t^{ - 0.4113}{\left| {{\sigma _{rs}}} \right|^{1.0839}}HV_{0.05}^{3.2069}
\end{equation}$$
Under the condition of residual stress relaxation, the influence of the stress concentration factor on the low-cycle fatigue life of the machined surface is higher than that of the micro-hardness, which is the main factor to determine the low-cycle fatigue life of titanium alloy Ti-6Al-4V. For the specimens with no residual stress relaxation, the higher the residual compressive stress, the higher the fatigue life, and the influence of residual stress on fatigue life is only lower than that of micro-hardness, which is higher than that of stress concentration factor.
4.0 CONCLUSION
For the purpose of improving the reliability and prolonging the service life of Ti-6Al-4V components, machining-induced surface integrity and its effect on fatigue life are investigated. Indicators such as stress concentration factor that calculated by surface roughness parameters, residual stress, microstructure and micro-hardness are included. Conclusions can be summarised as follows:
The values of 3D surface topography parameters are larger than those of 2D ones, while both kinds of parameter values showed almost the same change trend with different cutting conditions. The values of surface roughness are proportional to cutting speed, and inversely proportional to feed rate. The radial depth of cut has no significant effect on surface roughness. Residual stresses are compressive stresses at the machined surface in the present study. Increasing the cutting speed and feed rate decreased the mathematical values of compressive stress. Radial depth of cut had no obvious effect on the magnitude of compressive stress. Work-hardening was observed on the machined surface and the hardening rates were in the range of 13.6% to 300 43.4%. The α grain refinement rate decreased distinctly with the increase of cutting speed but slightly increased with the increase of feed rate. Radial depth of cut played an opposite role in increasing the grain refinement rate.
The results of tensile-tensile fatigue tests show that the numbers of cycles to failure were in the range of 2510 to 8141. The main deformation mode of the test specimens is necking, and the reduction ratio of areas was up to 30.2%. Widths of crack source and propagation regions are small due to the large stress amplitude. Slip lines and elongated dimples were observed in the mixed region of crack source and propagation. The equal-axis dimple is a typical feature on the fracture surface.
Stress concentration can reduce the fatigue life, while the stress concentration factor cannot express the low-cycle fatigue performance significantly due to the ratchet effect. Increasing the residual compressive stress and micro-hardness is beneficial to prolonging the fatigue life, but when the surface material of the specimen is subjected to plastic deformation due to yield, the residual stress on the surface is relaxed, and the effect on the fatigue performance has disappeared. Under the condition of residual stress relaxation, the stress concentration factor is the main factor to determine the low-cycle fatigue life of titanium alloy Ti-6Al-4V. For the specimens with no residual stress relaxation, the influence of residual stress on fatigue life is only lower than that of micro-hardness, which is higher than that of stress concentration factor.
ACKNOWLEDGEMENTS
This work was supported by the National Natural Science Foundation of China (51425503, 51375272, U1201245), Major Science and Technology Program of High-End CNC Machine Tools and Basic Manufacturing Equipment (2014ZX04012014) and grants from Taishan Scholar Foundation (TS20130922).