


NOMENCLATURE
- α
the significance level
- N
number of registered damage events
- T
total flight time until damage in cycles or flight hours
- λ
damage intensity
- E realistic
impact energy related to realistic event
- E maximum
impact energy related to remote (extremely improbable) event
- (nω2)α
the magnitude of nω2 criterion at significance level α
- P(E)
probability to encounter an impact with an energy exceeding a given value of E
- P E
probability of exceeding of energy E
- P impact
probability of obtaining an impact in operation
- P maximum
probability of extremely remote event
- P realistic
probability of realistic event
1.0 INTRODUCTION
The problem of internal delamination caused by accidental impact is known to be the major challenge in aircraft composite primary structure safety provision. The most reliable way to learn the laws of impact damage formation is to study the operating experience related to in-service damageability.
One of the first studies on the classification of accidental impact damage was presented in the work of Sikorsky Aircraft Division in 1980( Reference Cook, Adami, Digenova and Maass 1 ), where the damage tolerance approach for composite elements accepted later by majority of aircraft manufacturers has been proposed. In accordance with this method, the estimation of damage occurrence can be made based on the type of damage expected during maintenance process.
The considerable input into a study of metal and composite aircraft structures accidental impact scenarios was made in studies( Reference Kan, Cordero and Whitehead 2 , Reference Gary and Riskalla 3 ) performed in the 1990s of the 20th Century. The extensive research program focused on in-service damageability of US Navy fighters (Northrop and MCAir survey) became the basis for statistical analysis made by Kan et al.( Reference Kan, Cordero and Whitehead 2 ). This database included 1,644 dents registered on a metal structure of F-4, F-111, A-10 and F-18B aircraft and was used for the development of a probabilistic approach for composite structures certification. Research of Gary and Riskalla( Reference Gary and Riskalla 3 ) was also dedicated to the probabilistic design of composite structures and included statistical data on 1,484 accidental damage from low-velocity impacts collected on the composite elements of aircraft of US domestic air carriers: Delta Airlines, United Airlines and American Airlines. Cumulative operating time analysed in the report( Reference Gary and Riskalla 3 ) resembled 3.8 m flight hours.
In the 21st Century, aircraft manufacturers pay a lot more attention to the problem of impact damage threat. For damage tolerance certification of composite airframe, the fleet experience with total flight time of more than 30 m flight hours was taken into consideration by Airbus( Reference Morteau and Fualdes 4 , Reference Faivre and Morteau 5 ). One should also mention the domestic study( Reference Ushakov, Stewart, Mishulin and Pankov 6 ) in which the service data of military and transport aircraft MiG-29, Sukoi 27 and Antonov 124 were summarised and analysed by Ushakov et al( Reference Ushakov, Stewart, Mishulin and Pankov 6 ) for the development of structural safety probabilistic model.
The methodological basis developed in the above studies established foundations of damage tolerance philosophy used for composite primary structures nowadays. Following this approach, in the current study, for the purposes of damage tolerance analysis, the statistical data collected from the Russian aircraft fleet were interpreted and the input for characterisation of composite wing accidental impact scenarios was provided.
2.0 METHODOLOGY
2.1 Damage tolerance approach
The modern damage tolerance approach accepted for airframe composite structures requires that any impact damage in the composite structure either should be detected or should not reduce the structural strength below ultimate load capability. This approach is described in advisory circulars( 7 , 8 ) and based on the five category classification of the damage potentially expected in operation. Damage is classified depending on the detectability, or more specifically – depending on the operating time needed for reliable detection of this damage within the accepted aircraft maintenance program. For each category, the requirements for static and fatigue loads are established, in which the damaged structure must withstand while operating up until the moment of damage detection. The Category 1 addresses non-detectable damages and limited by two thresholds: threshold of detectability (known as barely visible impact damage) and energy threshold (‘realistic’ energy level) whichever comes first. The Categories 2 and 3 address visible impact damages and damages caused by the severe impacts.
There are at least two ways to identify which energy level can be considered as ‘realistic’ and each one is recognised as applicable according to Advisory Circulars of FAA( 7 ) and EASA( 8 ).
According to the deterministic approach, the energy thresholds are to be evaluated based on the prescribed impact parameters: impacted zone of structure, impact energy and frequency of event. First, this approach was applied by Cook( Reference Cook, Adami, Digenova and Maass 1 ) for the zoning of a UH-60A Black Hawk helicopter: for each zone of the fuselage, the impact energy exceedance curves were generated and taken as damage tolerance criteria (the considered impact threat scenarios were mostly related to mistakes during standard maintenance procedures). Later this approach was developed by Kan et al.( Reference Kan, Cordero and Whitehead 2 ) who investigated the relationship between low-velocity impacts energies and damage sizes in wing panels of different thickness. As a result of these studies, the value of 100 ft-lbs (136 J) was adopted for the realistic energy threshold.
Probabilistic approach proposed by Rouchon( Reference Rouchon 9 ) implies the determination of the realistic energy level on the basis of in-service statistical data relevant to actual operating conditions. This approach was used in the current study for the estimation of wing damage tolerance parameters.
2.2 Field survey
Design of MS-21 aircraft with full composite wing has led to urgent need of an advanced certification approach( Reference Dubinskii and Safonov 10 ). As a part of this approach the in-house studies on impact threat scenarios typical for local operational conditions were initiated.
On the first stage of those studies, Feygenbaum and Dubinskii( Reference Feygenbaum and Dubinskiy 11 ) performed the analysis of 1258 damage events registered in operation and during maintenance of a commercial fleet. The work was continued by the team of experts from industry research institutes and airlines who collected and analysed data on accidental damages registered between year 2000 and 2016. The data came from periodic reviews of structure for airworthiness, operator’s reports, maintenance checks, failure registration cards, manufacturer databases, reports on structural condition assessment needed for service life extension and other documents containing relevant information (see the sources of information breakdown in Fig. 1.)
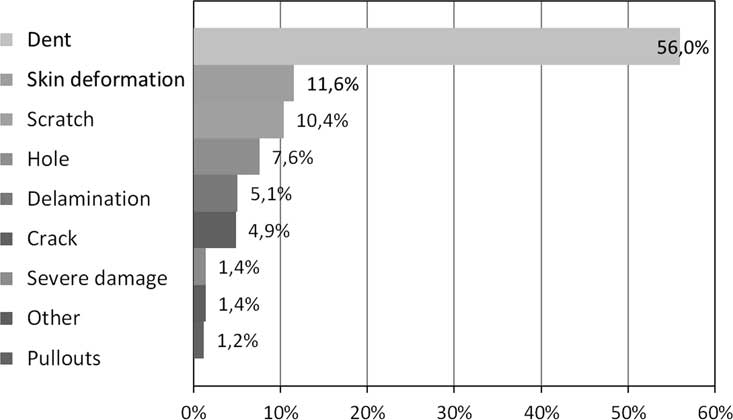
Figure 1. Breakdown of field damage data sources.
About 30 thousand documents related to 35 aircraft types were reviewed to identify approximately 5,300 damage incidents of various source and nature from barely visible surface deformations and scratches to very large damage causing a real threat to the structural integrity of airframe. Of these, about 2,000 damage records were made on local fleet aircraft types (Ilyushin, Antonov, Tupolev and Yakovlev) and about 3,300 records on Boeing aircraft used by local operators. The operating time of the considered fleet resembled about 4 m flight cycles (F.C.) and 10 m flight hours (F.H.)
More than 80% of damages were related to errors during ground handling: falling baggage, dropped tools, collisions with airfield infrastructure and ground service vehicles. The ground hail, wind gusts and snow/sand storms caused about 10% of damage. Other 10% of damage sources were foreign objects impacts: runway debris, uncontained rotor burst, bird strike and tire explosion( Reference Fеygenbaum, Sokolov, Bozhevalov and Arepev 12 ).
The types of damages were classified according to the breakdown shown in Fig. 2. The dent appeared to be the most frequent type (more than 50%), with depth sizes ranging from 0.1 mm to 50 mm. Out of this breakdown for the purposes of current study, only the wing skin surface dents (Fig. 3) were taken into consideration since this type of damage provides possibility to recover impact energy from dent geometry that is required for damage tolerance analysis.
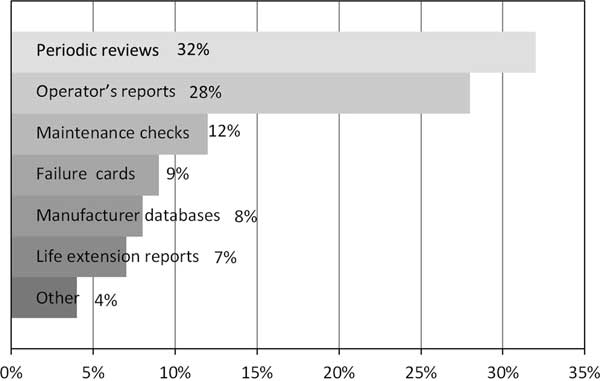
Figure 2. Breakdown of damage type.

Figure 3. Wing skin metal dent examples.
2.3 Probabilistic model
In order to evaluate the probability of accidental in-service impact into the wing of commercial aircraft, the following simple probabilistic model was used.
The in-service damageability of the aircraft is considered as a random stream of events taking place in time one after another. It is assumed that damage events occur independently (the occurrence of one event does not affect the probability that a second event will occur), that damage events occur at constant rate and that two events cannot occur at exactly the same instant. Under those assumptions, the exponential distribution can be applied( Reference Feller 13 ):
 $$f(t){\equals}{\rm \lambda e}^{{{\minus}{\rm \lambda }t}} ,$$
and the damage probability function P D can be expressed as
 $$P_{D} (t){\equals}(1{\minus}{\rm e}^{{{\minus}{\rm \lambda }t}} )$$
Here, t is the time, λ is the damage events intensity (parameter, inverse to average flight time until damage event T measured in F.H. or F.C.):
 $${\rm \lambda }{\equals}1\,/\,T $$
The damage intensity for the given aircraft type averaged on the fleet is
 $${\rm \bar{\lambda }}_{i} {\equals}N_{i} \,/\,T_{{\Sigma i}} $$
Here, N i is the total number of registered damage events for all aircraft of type i, T Σi – total flight time measured in F.H. or F.C. In Table 1 the average flight time until damage and damage intensity for 16 aircraft types is presented.
Table 1 Average flight time until damage and damage intensity for different aircraft types

It follows from Table 1 that the damage events intensity per F.H. averaged over the full data set makes
 $$\bar{\lambda }{\equals}\mathop{\sum}\limits_{i{\equals}1}^n {N_{i} } \,/\,\mathop{\sum}\limits_{i{\equals}1}^n {T_{{\Sigma i}} } {\equals}5.43{\times}10^{{{\minus}4}} $$
For the qualitative characterisation of wing damageability, it was proposed to divide aircraft wing into zones and determine the impact threat for each one. The generic wing structure of commercial aircraft consists of wingbox, leading edge, trailing edge, wing to body fairing, flaps, slats, ailerons, interceptors, airbrakes and wingtips. Where applicable, the inboard/central/outboard parts of each element were allocated and for each part the top and bottom surface were considered separately. In total, it made N z =34 zones of the wing, see Table 2.
Table 2 Conditional probability of wing element impact damage for different aircraft types

The impact threat for each zone was estimated by methods of conditional probability analysis (the conditional probability is a measure of the probability of an event given that another event has occurred (
Reference Ross
14
)). In the current case, it means that in order to evaluate the conditional probability of the impact into given zone of the wing element
 $\bar{p}_{z}^{n} $
, one should take into account the following probabilities:
$\bar{p}_{z}^{n} $
, one should take into account the following probabilities:
∙ averaged probability
 $\bar{p}_{e} $
that the wing element is damaged given that the airframe damage occurred;
$\bar{p}_{e} $
that the wing element is damaged given that the airframe damage occurred;∙ averaged probability
$\bar{p}_{{{\rm dent}}} $
that the wing element is impacted (damage has the form of surface dent) given that the wing element is damaged;∙ probability
$p_{{{\rm sq}}}^{n} $
that zone n is impacted given that the wing element containing zone n is impacted


 $$\bar{p}_{z}^{n} {\equals}\bar{p}_{e} \cdot \bar{p}_{{{\rm dent}}} \cdot p_{{{\rm sq}}}^{n} $$
 $$\bar{p}_{e} {\equals}n_{e} \,/\,N_{{\rm \Sigma }} \,\bar{p}_{{{\rm dent}}} {\equals}n_{{{\rm dent}}} \,/\,N_{{\rm e}} \,p_{{{\rm sq}}}^{n} {\equals}s_{n} \,/\,S_{{{\rm element}}} $$
Here, n e is the number of wing damage events, N Σ is the total number of damage events, n dent is the number of dents on the wing element, N e is the total number of damage of all types registered on the element, s n is the area of the zone n and S element is the total area of the wing element containing zone n.
The conditional probabilities of the accidental impact into the allocated zones of the wing averaged on all considered aircraft types are presented in Table 2. Here
 $\bar{p}_{{zn}}^{n} $
is the
$\bar{p}_{{zn}}^{n} $
is the
 $\bar{p}_{z}^{n} $
normalised per unit.
$\bar{p}_{z}^{n} $
normalised per unit.
For the further analysis, in order to establish the realistic impact energy level and compare it to the similar estimations made by other authors, it is necessary, in accordance with Rouchon model(
8
), to determine the probability of impact into wing. The superposition theorem for homogeneous processes(
Reference Kingman
15
) gives for wing damage events intensity
 $\bar{\lambda }_{{{\rm wing}}} {\equals}\bar{\lambda } \cdot \mathop \sum\limits_{n{\equals}1}^{N_{z} {\equals}34} \bar{p}_{z}^{n} $
. Then the conditional probability of whole wing structure impact damage, derived from Equation (2) for t=1 F.H. and for the sum of
$\bar{\lambda }_{{{\rm wing}}} {\equals}\bar{\lambda } \cdot \mathop \sum\limits_{n{\equals}1}^{N_{z} {\equals}34} \bar{p}_{z}^{n} $
. Then the conditional probability of whole wing structure impact damage, derived from Equation (2) for t=1 F.H. and for the sum of
 $\bar{p}_{z}^{n} $
presented in Table 2 becomes
$\bar{p}_{z}^{n} $
presented in Table 2 becomes
 $$P_{{{\rm impact}}} {\equals}(1{\minus}{\rm exp}({\minus}\bar{\lambda }_{{{\rm wing}}} )){\equals}(1{\minus}{\rm exp}({\minus}{\rm \bar{\lambda }} \cdot 0.2097))\,\cong\,10^{{{\minus}4}} $$
The distribution of
 $\bar{p}_{{zn}}^{n} $
over the wing structure provides possibility to have the picture of wing relative damageability and understand in which zones of the wing the impact threats are more likely. In Fig. 4, one can see the qualitative distribution of impact intensity over the top and bottom surfaces of the generic wing.
$\bar{p}_{{zn}}^{n} $
over the wing structure provides possibility to have the picture of wing relative damageability and understand in which zones of the wing the impact threats are more likely. In Fig. 4, one can see the qualitative distribution of impact intensity over the top and bottom surfaces of the generic wing.

Figure 4. Wing relative damageability
 $\bar{p}_{{zn}}^{n} $
.
$\bar{p}_{{zn}}^{n} $
.
It follows from Fig. 4 that the wing panels are the least prone to damage, as the main risk of collision with objects is related to wing edges. Slat and inboard flap are most damaged elements of the wing: the damage comes from flight hail, runway debris, errors during taxiing, collisions with ground service equipment (GSE) and aerodrome structures.
Those observations and the impact distribution data presented in Table 2 and in Fig. 4 were obtained on aircraft types of different airframe configuration, see Table 1. Nevertheless, the facts that wing of generic transport category aircraft possesses a certain number of standard elements, (wingbox, high-lift device, ailerons and air brakes) and that the commercial fleet nowadays goes through very similar field maintenance procedures lead to the assumption that the generic accidental impact scenarios needed on the stage of preliminary design can successfully be taken from the above analysis. The evaluation of impact threats and corresponding structural damage related to the specific aircraft type should be done on the late development stage addressing the detailed design scheme and expected operating conditions.
2.4 Impact energy distribution
Statistical data on accidental impact damage collected on metal aircraft skins can be used for damage tolerance evaluation of similar composite structures. In order to do, this it is necessary to convert the metal dent depth into impact energy. For this purpose, the original analytical method( Reference Dubinskiy, Zharenov, Pavlov and Ordyntsev 16 ) based on the establishment of three-dimensional relationship between the impact energy, dent depth and thickness of the skin was developed. The relationship for duralumin alloy 1163 that is used in skin panels of most aircraft types, mentioned above, was generated and validated experimentally. The impact cases valid for conversion were selected from the damage database and translated into impact energy survey. The resulting energy range covered three orders of magnitude, from a few joules to several thousand joules.
Unlike the Northrop and MCAir survey analysed by Kan et al.( Reference Kan, Cordero and Whitehead 2 ), the TsAGI and GosNII GA database includes a significant number of high energy impact events. For damage tolerance analysis, it would be reasonable to make the same data extraction as in Northrop and MCAir study where the depth of registered metal dents did not exceed 0.1 in (2.5 mm). The cumulative probability distributions (probability to encounter the impact energy E or less) for full and for limited data samples are shown in Figs 5 and 6.

Figure 5. Cumulative impact energy probability for full data sample (Lognormal scale).

Figure 6. Cumulative impact energy probability for limited data sample (Weibull scale).
The empirical distribution of full data sample (Fig. 5) is very close to a logarithmically linear function. The hypothesis, that impact energies are distributed according to logarithmically normal law, was checked by nω2 criterion for two unknowns( Reference Martynov 17 ). The calculated statistic value nω2=0.1215 appeared to be less than the criterion value (nω2)α=0.125 taken at the accepted significance level α=0.05( Reference Casella and Berger 18 ). Thus, the hypothesis about normality of experimental data has been confirmed at a significance level of 5% or more. The Weibull function established from the same data does not agree with the empirical distribution (Fig. 5).
The distribution of limited empirical data sample agrees neither with Lognormal nor with Weibull distribution: both hypotheses have too low significance level α<0.001 by the Anderson-Darling criterion( Reference Lawless 19 ). It follows from Fig. 6 that the left-hand side is better described by the Weibull distribution and the right-hand side – by Lognormal law. Thus for the limited data sample of the given survey there is no definite distribution law, it can only be stated that Weibull distribution can be reasonably used for small energies while Lognormal distribution is more suitable for moderate energy impacts consideration.
The R-squared regression errors for the fitted distributions are given in Table 3.
Table 3 R 2 regression errors for Lognormal and Weibull distributions

2.5 Impact energy characterisation for damage tolerance analysis
Although it is reasonable to assume that for the determination of realistic impact energy level the use of limited data sample is more adequate than the use of full data sample which includes such unrealistic events as serious collision with airfield buildings, equipment, GSE and other aircraft, for the purposes of damage tolerance analysis, both data samples were considered. The reason for full data sample analysis importance is that the sampling criteria taken from the Northrop and MCAir survey, in which dents larger than 2.5 mm were not registered at all, may be not always be valid for composites, (for their impact sensitivity and brittle behavior). If one assumes that at least one high energy impact event remains unreported or ignored by technical personnel during aerodrome maintenance, it is reasonable to make estimation on the full data sample.
According to the Rouchon model( Reference Rouchon 9 ) and the approach presented in Handbook( 20 ), the probability P(E) to encounter an impact in operation with an energy exceeding E is the product of two independent probabilities: the probability of obtaining an impact in operation P impact and the probability of exceeding a certain level of energy P E (E):
 $$P(E){\equals}P_{{{\rm impact}}} \cdot P_{E} (E)$$
The empirical distributions of P(E) determined on the basis of TsAGI and GosNII GA impact energy survey for two P impact estimations (the first one P impact=10−4 derived above from local field data, see Equation (8), and the second one P impact=10−3 taken from Gary ( Reference Gary and Riskalla 3 ) and Airbus ( Reference Morteau and Fualdes 4 ) studies) are shown on Figs 7 and 8. The full and limited data sample distribution functions were approximated, respectively, by Lognormal and Weibull laws.

Figure 7. Probability to encounter in operation an impact with an energy exceeding E for full data sample (Lognormal law).

Figure 8. Probability to encounter in operation an impact with an energy exceeding E for limited data sample (Weibull law).
According to the advanced non-conservative damage tolerance methodology presented in Refs 4,9,18 the ‘realistic’ and ‘severe’ energy levels can be derived from energy distribution function under the following assumptions.
The impact with ‘realistic’ or higher energy aircraft may experience not more often than once per lifetime. Taking service life of modern aircrafts for 105 F.H., the probability of ‘realistic’ energy level can be determined as P(E realistic)=10−5 F.H. The ‘severe’ or ‘maximum possible’ energy level may be determined by criterion of almost improbable event, namely 10−9: P(E maximum)=10−9 F.H.
Using the relationships in Figs 7 and 8, the energy levels corresponding to those probabilities were determined, and the summary results are presented in Table 4.
Table 4 ‘Maximum’ and ‘Realistic’ energy levels determined according to probabilistic approach( 8 )

‘Unrealistic’ scenarios (Fig. 7): Under the assumption that any damage in the wing structure may remain undetected for considerably long time comparable with heavy inspection interval, the full data sample can be applied for damage tolerance analysis. In the conservative case (P impact=10−3), the ‘threshold’ energy exceeds thousand joules and the probability of exceeding of 136 J makes only 10−4, which means that the aircraft can encounter an impact with energy over 136 J about 10 times per service life.
‘Realistic’ scenarios (Fig. 8): Under the assumption that all high energy impacts are immediately reported, the limited data sample should be used for damage tolerance analysis. The impact energy which aircraft may encounter during its lifetime determined for conservative case P impact=10−3 makes E realistic=36 J. This figure matches Airbus threshold value E realistic=35 J( Reference Morteau and Fualdes 4 ) which was determined under the same assumptions but on very different data set, namely Northrop and MCAir survey of US Navy fighters. The P(E) distribution calculated for US Navy data( Reference Kan, Cordero and Whitehead 2 ) is also shown for comparison. The trend lines in Fig. 8 confirm that impact of 136 J accepted as a threshold value in Boeing damage tolerance methodology( Reference Fawcett and Oaks 21 ) can be considered as a remote event.
3.0 DISCUSSION
On the one hand, improbable events may not be considered as applicable data for the evaluation of ‘realistic’ energy threshold and thus the estimations made in Table 3 on full data sample are ultraconservative and for the first look are not adequate. On the other hand, domestic experience shows that for various reasons, even very serious incidents can be left unreported, which is much more dangerous for composites than for metal structures because of hidden internal damages. The following example related to wing damage event from TsAGI and GosNII GA field survey can be mentioned. It is known that the critical design case for the composite wing is compression after impact. The well-known sources of impacts for upper wing panel (compressed zone) are standard tool drop, tool box drop and walking on the prohibited areas. However, along with the aforementioned sources, the performed analysis revealed another dangerous scenario which was never taken into account. It appears that the severe damage to the upper panel may be caused by the impact of a deicing hand on the ramp right before aircraft departure. It is expected that such kind of event should be immediately reported, but unfortunately the field experience indicates the opposite. Another example is High Energy Wide Area Blunt Impact phenomena( Reference Defrancisci, Chen and Kim 22 , Reference Kim, Defrancisci and Chen 23 ) which recently became a matter of concern for FAA( 24 ). Those facts confirm that in some cases, severe events should not be addressed as extremely improbable and make the consideration of unrealistic impacts part of design and certification process.
In the frameworks of certification process, the structural safety for all scenarios expected in operation during the aircraft life cycle should be demonstrated. But should all of the noted scenarios be taken into account for design and maintenance program development? The operational manuals provide clear guidance on aircraft maintenance procedures and are specifically designed to minimise errors in ground handling. It is also assumed that airfield personnel do not intentionally damage aircraft. In the same time, the missing of large internal damage in composite primary structure may lead to catastrophic situation. The solution of this problem should be based on an integrated approach in the design, certification and operation phases: introduction of advanced techniques of structural health monitoring, arrangement of training courses focused on composite structures maintenance, inclusion of conditional inspections to the Aircraft Maintenance Manual and an understanding of the rare but not improbable damage scenarios.
As for realistic scenarios, considered on the basis of TsAGI and GosNII GA limited energy data, the analysis resulted in very similar to Airbus( Reference Morteau and Fualdes 4 ) estimation of energy cut-off despite differences in origin of field data (US Navy fighters versus Russian commercial planes), energy recovery method (experimental calibration of dents on full scale wing versus three-dimensional relationship established analytically and verified on components( Reference Kingman 15 )) and applicable probabilistic distribution (Weibull versus Lognormal).
A few words should be said about the inspection methods suitable for the detection of the impact damages described in the above analysis. Despite the considerable advances in non-destructive inspection (NDI) techniques, the visual inspection remains the basic method of airframe integrity control in operation. One of the reasons for that is potential increase of operation costs related to introduction of complicated NDI methods which may bring down the competitiveness of composite aircraft compared to the metal ones. The general principle is as follows: if any signatures of disintegrity are revealed during visual inspection, then an in-depth analysis of material in this zone has to be performed using special instruments. The several decades of local commercial fleet operating history monitoring led to the conclusion that ultrasonic, thermography and low frequency acoustic methods (e.g. tap-testing) are the most efficient for the damage detection in composite structures. The recent comparative study of those methods (with addition of radiography and eddy-current) demonstrated that for the detection of impact-caused delamination in empennage stiffened composite panel, the ultrasonic technique is the most adequate and reliable( Reference Fеygenbaum, Mikolaychuk, Metelkin, Dubinskiy and Gvozdev 25 ).
4.0 CONCLUSIONS
The study of field impact survey containing the broad range of damage events registered on Russian commercial fleet for more than 15 years provided possibility to make the following conclusions.
The Rouchon method( Reference Morteau and Fualdes 4 , Reference Rouchon 9 , 20 ) to a large extent is invariant to data type and thus has wide scope of application in statistical analysis.
The threshold value of 136 J accepted by many manufacturers for the category of undetectable defects can be considered sufficiently reliable provided that aerodrome personnel have received proper training and understand the conditional inspections required for GSE strikes.
Depending on accepted assumptions, the analysis of the same data may lead to results that differ from each other by orders of magnitude. The assumption that damage may be missed in operation leads to an energy threshold value that is greater (i.e. more conservative) than accepted in Airbus( Reference Morteau and Fualdes 4 ) and Boeing( Reference Fawcett and Oaks 21 ) damage tolerance methodology.
Thus, the significance of obtained results is determined by the fact that they reflect realistic maintenance conditions, which should eliminate extra conservatism in composite design but in the same time take into account severe scenarios for balancing of too an optimistic approach. Based on this study, the damage tolerance parameters for composite wing of commercial aircraft can be reliably substantiated, the maintenance program can be optimised and the damage inspection methods can be improved.


