


NOMENCLATURE
- A
rotor disk area πR 2
- c
blade chord
- C p
obstacle surface pressure coefficient
 $\frac{p - p_\infty }{0.5\rho V_T^2}$
- C T
rotor thrust coefficient
$\frac{T}{\rho A V_T^2}$- D
rotor diameter
- F
force on obstacle surface
- H
rotor operating height
- p
obstacle surface pressure
- p ∞
ambient pressure
- R
rotor radius
- T
rotor thrust
- u
velocity in the x (horizontal) direction
- V T
rotor blade-tip speed, ΩR
- x, y, z
coordinate system on the obstacle face
- X
displacement between the rotor axis and the obstacle front face
- v
velocity in the vertical direction
- Z
flow field coordinate equivalent to vertical distance above ground
- Γ
tip vortex circulation
- ν
air kinematic viscosity
- ρ
air density
- Ω
rotor rotational speed
- FFT
Fast Fourier Transform
- GARTEUR
Group for Aeronautical Research and Technology in Europe
- IGE
In Ground Effect
- OGE
Out of Ground Effect
- PIV
Particle Image Velocimetry
- RMS
Root Mean Square


1.0 INTRODUCTION
Helicopters currently carry out a wide range of civilian and military applications including air ambulance, sea and mountain rescue, police surveillance and troop transport. These roles utilise the vertical take-off, landing and hovering capabilities of helicopters, but very often helicopters must operate in close proximity to obstacles such as buildings, cliffs, ships and other structures, in addition to operating in ground effect. The structure of the helicopter rotor wake when operating both In Ground Effect (IGE) and Out of Ground Effect (OGE) was investigated by Fradenburgh(Reference Fradenburgh1) and more recently by others. IGE, the rotor wake was found to separate into two distinct flow regimes, the main downstream flow, which develops into a wall jet and a recirculation zone located under the rotor axis. This region of recirculating air is responsible for the radial deflection of the wake at the ground plane. The rotor wake consists of blade-tip vortices trailed from each rotor blade, which convect down towards the ground, as well as vortex sheets trailed behind the blades. OGE, these vortices diffuse before they interact with the ground plane, but when operating IGE, the trailed-tip vortices can lead to unsteady flow velocities in the wall jet if they reach the ground plane as demonstrated by the experiments of Lee et al(Reference Lee, Leishman and Ramasamy2). Knight(Reference Knight and Hefner3), Hayden(Reference Hayden4) and Betz(Reference Betz5) focused on the performance improvements experienced by a rotor when operating IGE, which produces significantly more thrust for a given power. With respect to rotor performance, a rotor is described as being IGE when it is operating below a height of one rotor diameter off the ground, after which the performance effects are negligible and the rotor is described as operating OGE.
An interesting phenomenon commonly associated with helicopter operating IGE is so-called brownout, and recently, this helped to renew interest IGE of a helicopter rotor wake. Brownout occurs when dust and other particles are swept up by the rotor wake forming clouds that can impair pilot vision; brownout was reportedly responsible for 3 out of every 4 accidents involving U.S. army helicopters when they were operating in Iraq and Afghanistan, and the phenomenon has been the subject of a few experimental and computational investigations, for example by Nathan and Green(Reference Nathan and Green6), Johnson et al(Reference Johnson, Leishman and Sydney8), Phillips and Brown(Reference Phillips and Brown9) and Wadcock et al(Reference Wadcock, Ewing, Solis, Potsdam and Rajagopalan10) because of its importance in helicopter operations. The structure of the rotor wake IGE is one of the features responsible for brownout, and more detailed understanding of this phenomenon would potentially lead to a better understanding of how to reduce the risk of accidents occurring relating to helicopter brownout in the vicinity of an obstacle.
While investigations of plane ground effect on a rotor wake are relatively few in number, investigations into the interactions of the rotor wake impinging upon an obstacle are very limited indeed. The formation of regions of recirculating air between a rotor and an obstacle on the ground was found by Timm(Reference Timm11) to depend on the operating height of the rotor, the height of the obstacle and the displacement between the rotor drive shaft and the obstacle profile, but the obstacle employed was akin to a wall or barrier. Some recent research in this field has investigated the interaction between a helicopter and a ship air wake, with the aim of generating an understanding of a manoeuvring helicopter in ship environments (Crozon et al(Reference Crozon, Steijl and Barakos12)). An experiment carried out in support of this scenario by Nacakli and Landman(Reference Nacakli and Landman13) illustrated the technical requirements when investigating such a complex flow field. Particle Image Velocimetry (PIV) investigations demonstrated the deformation of the rotor wake and the presence of a recirculating vortex when a rotor was operating at certain locations within the air wake of a ship. Quinliven and Long(Reference Quinliven and Long7) investigated the rotor inflow and aeromechanics due to the wake of a large obstacle, and their investigations raised questions about the modelling methods employed in addition to providing useful observations about modifications to the rotor inflow in the presence of an obstacle. Gibertini et al(Reference Gibertini, Grassi, Parolini, Zagaglia and Zanotti14) demonstrated the variations in rotor thrust C T on a helicopter model in the vicinity of a stationary obstacle. Their work concentrated upon rotor thrust and figure of merit measurements while the rotor was IGE due to the obstacle upper surface, or the ground, or a combination of the two. Flow visualisation in limited areas using PIV and surface pressure data were also presented, and they were able to identify configurations where particularly strong obstacle surface pressures due to the rotor wake interaction were observed.
The motivation behind most rotor/obstacle interaction studies has been for helicopter behaviour in the ship air-wake interface, and investigations have tended to concentrate upon the rotor aeromechanics for good reason. Rotor/obstacle flow field is an important aspect of ground effect, and this aspect together with aerodynamic loading on obstacles due to the rotor wake have received little attention. Weak structures or untethered objects present hazards of their own in addition to the effect of the recirculating wake on the helicopter rotors. The relative lack of theoretical, computational and experimental investigations of the interaction of rotor wakes with ground obstacles has been recognised by the international community, and the GARTEUR organisation set up Action Group 22 (AG22) in response to this need. AG22 comprises industrial research and academic partners from France, Germany, Greece, Italy, The Netherlands and the UK, and was set up to provide an experimental database of measurements and a set of computational tools, with well-defined test cases including confined spaces and cuboid obstacles for a rotor in hover (see Visingardi et al(Reference Visingardi, De Gregorio, Schwarz, Schmid, Bakker, Voutsinas, Gallas, Boisard, Gibertini, Zagaglia, Barakos, Green, Chirico and Giuni15)). This paper describes experimental work done as part of this Action Group. An experiment to investigate a rotor wake interaction with a prototype obstacle is thus described in this paper. The emphasis is upon the wake interaction with the obstacle rather than the effect on the rotor thrust and performance. Flow visualisation shows significant rotor wake induced velocities over the obstacle surfaces, and high positive pressure and suction regions develop as a consequence. Furthermore, the obstacle surface pressures are highly unsteady. Forces of the order of the rotor thrust are induced on the surfaces, and unsteady pressure indicates local, unsteady loading of the same order as the mean loading. Vortex-edge interactions occur as the rotor tip trailed vortices pass over the obstacle edge, and other interactions are set up due to the formation of recirculating flow in the confined space between the rotor, obstacle and ground.
2.0 EXPERIMENTAL METHOD
2.1 Rotor and obstacle model
The rotor used in this experiment was a D = 0.3 m diameter, fixed pitch, two blade rotor with untwisted, untapered, carbon fibre blades with a uniform chord length of c = 0. 03 m. At the fixed blade pitch 8° and test rotor speed of 4,000 rpm, the thrust coefficient was C T = 0.006 OGE. The rotor had no cyclic pitch input, and there were no lead-lag or flap degrees of freedom. The blades were very lightly loaded and were assumed to be rigid. The blade-tip speed was V T = 63.9 m/s, which was the scaling velocity used for the pressure coefficient. The tip chord Reynolds number was 1.3 × 10⁵, but the important fluid dynamics were driven by the trailed vortex wake. The work of Gibertini et al(Reference Gibertini, Grassi, Parolini, Zagaglia and Zanotti14) used a 4-blade scale model MD500 helicopter with an internal six component balance, and their tip Reynolds number was comparable at 2.14 × 10⁵. Tip Mach numbers were 0.188 for the current work and 0.286 for the work of Gibertini et al, and their OGE thrust coefficient was 0.007. The rotor test parameters were similar for the two sets of experiments. The potential parameter space for the choice of obstacle shape and size is enormous. Gibertini et al(Reference Gibertini, Grassi, Parolini, Zagaglia and Zanotti14) used a 1.2D high × 2.67D × 2.13D parallelepiped to model the obstacle. For the current experiments, a 0.3 m cube (1D) represented the obstacle, and a total of 180 pressure tappings were installed on the top and one side (front), distributed as shown in Fig. 1. Compared to the study by Gibertini et al(Reference Gibertini, Grassi, Parolini, Zagaglia and Zanotti14), the resolution of pressure tappings is higher and they are distributed more finely close the edges. The pressure tappings were connected by 0.15 m flexible tubes to a Scanivalve ZOC23B pressure scanner with ±2.5 kPa range. The pressure scanner is capable of responding to very high-speed unsteady pressure signals for a single channel (>10 kHz) if arranged appropriately, but the sampling rate per channel is reduced when multiplexing over multiple channels, and in this case, the sampling rate was set to 625 Hz per channel to allow features of the unsteady pressure signal to be resolved. The long connecting tube has the effect of attenuating and phase shifting the unsteady pressure, but this would be identical for each tapping. Calibration tests indicated that the scanning module sensors would respond to pressure changes less than 0.1Pa, equivalent to a C p error of 0.0004 with the scaling used in this paper. The rotor and obstacle were situated in the middle of a large, unventilated room with a flat, horizontal floor, and a 6 m ceiling height, and there were no floor obstructions over a radius of at least 10 rotor diameters. The test laboratory had no ambient flow, and any recirculation of flow into the rotor would have been due to obstacle effects only and not a consequence of the test environment. The co-ordinate system is shown in Fig. 2, where the (y, z) plane is aligned with the front surface of the obstacle and the (z, x) plane was aligned with the obstacle and the rotor axis. The parameter X is the distance between the rotor axis and the obstacle front face. Given that the cube side length is equal to the rotor diameter D, the rotor axis is directly over the upper surface of the cube when X/D = −0.5.
Figure 1. Schematic diagram of the obstacle and the locations of the pressure tappings.
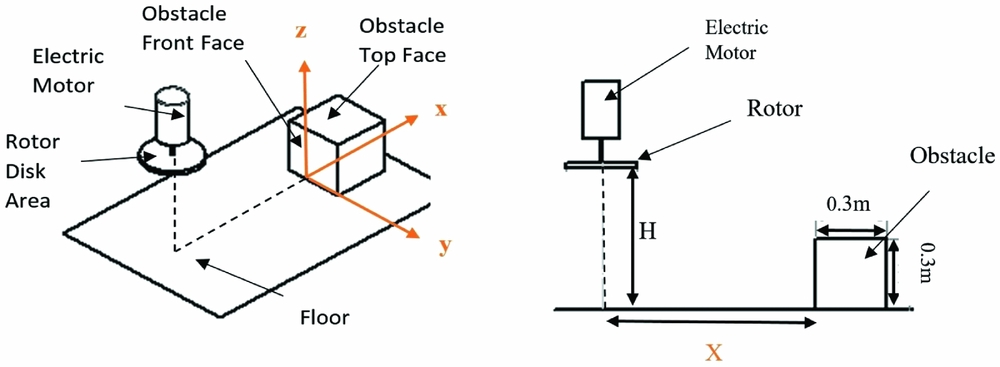
Figure 2. Pressure tapping experimental rig configuration and axis definitions.
The obstacle upper and front surface pressures were measured for the configurations shown in Table 1. The pressure scanner was zeroed before each experimental run following a 60 second period with the rotor at rest. The rotor was brought up to its operating rotational speed, and measurements were recorded after 20 seconds to allow transients to decay. Measurements were recorded at a frequency of 625 Hz for 4.8 s for each pressure tapping location.
Table 1 Table of experimental configurations for surface pressure measurement; ‘x’ indicates measured configurations
Smoke flow visualization was used to examine the structure of the rotor wake. Oil-based smoke was introduced into the airflow at the end of an electrically heated smoke wand, and this allowed both the blade-tip vortices and the structure of the rotor wake/obstacle interaction to be visualised. A high energy, 1 μs pulse width stroboscope was used with a digital video camera running at 133 frames per second for illumination and digital video recording. Smoke was entrained into the vortex wake by positioning the smoke wand close to the edge of the rotor disc, and the vortex cores were clear for five or so helix windings until turbulent diffusion of the smoke led to the rapid loss of definition of the vortex filaments.
2.2 Particle Image Velocimetry (PIV)
It was not possible to perform PIV in the same laboratory as the flow visualisation and pressure measurement tests. Instead quantitative flow visualisation using two-component PIV was conducted in a closed return wind tunnel with a 1.05 m × 0.85 m octagonal working section. A 0.15 m diameter, uniform chord length 14 mm, two blade propeller with a 12.7 cm pitch was used as the rotor with a 0.15 m cube obstacle. This smaller rotor system was operated at a constant rotational speed of 6,000 RPM for all tests to give a blade-tip velocity of V T = 47 m/s (tip Reynolds number 44,500). The Reynolds number is low compared to the pressure data tests, but the tip vortex circulation Reynolds number was measured from high magnification PIV to be Γ/ν = 16,000 and, consequently, the vortex dynamics are inertia dominated. A schematic diagram is shown in Fig. 3, and note that the wind tunnel was not run during the tests. PIV seeding was provided by a smoke generator that provided a fine mist with nominal particle diameter 0.2 μm. The PIV laser light sheet was produced parallel to the wind-tunnel longitudinal axis using a Spectra-Physics, Lab 130-10 Nd:YAG, single cavity, double pulsed, frequency doubled laser with a wavelength of 532 nm, a pulse duration of 8 ns and a flashlamp rate of 10 Hz. A Redlake Megaplus 4 megapixel (2048 × 2048 pixel) digital video camera fitted with a 105 mm focal lens set to  $f\#$ = 2.8 was used for PIV image recording, and 144 image pairs at a rate of 3 per second were taken for each experimental configuration. The time delay between image pairs was set to 75 μs, which is appropriate for the field of view and the velocity scales to be resolved.
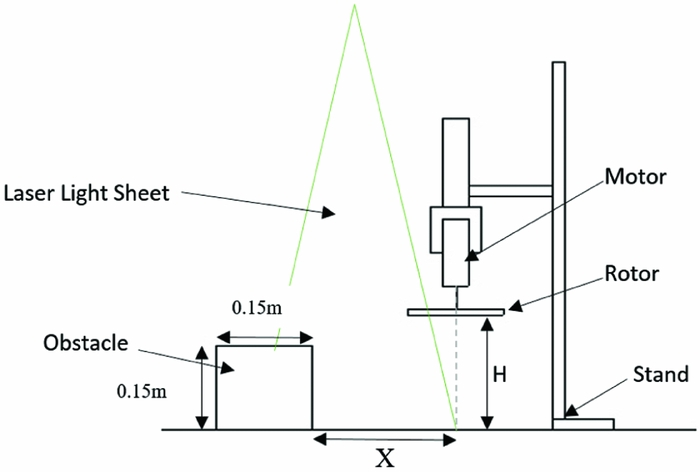
Figure 3. Schematic diagram of the experimental rig used for PIV experiments.
Post processing of the raw PIV images was completed using MATLAB and the open source script PIVlab(Reference Thielcke and Stamhuis16). This allowed the two velocity component mean flow velocities to be completed. PIV sampling was performed independent of rotor phase. The rotor was observed to cause laser shadow or glare depending on its azimuthal position, and badly affected individual image pairs were eliminated from the overall analysis. Measurements were made to within 5 mm of the ground and 3 mm from the obstacle surface because glare made PIV analysis of the image regions at closer displacements unreliable. The results presented in this report were produced using an iterative Fast Fourier Transfer (FFT) correlation algorithm incorporating multiple interrogation passes and window deformations. A triple pass algorithm was implemented with an initial interrogation window size of 64 × 64 pixels and a final interrogation window size of 32 × 32 pixels with 50% overlap. The PIV was done to aid the flow visualisation, to show the trajectory of the mean wake flow, and reveal where the kinetic energy is highest. Assessment of accuracy using the wind-tunnel mean flow indicated an absolute accuracy of 1%, but this will be degraded in the regions of high shear in the vortex dominated wake flow.
3.0 RESULTS
3.1 Flow Visualization
Mean flow velocity plots are presented in Figs 4 through 6. During PIV data collection the camera was located with reference to the obstacle front surface, and the size of the investigation area changed for each experimental configuration. For Fig. 4, frame (a) with rotor height 1.93D above the ground and no obstacle, the classical ground effect wake configuration can be seen, with the wake broadening as the flow approaches the ground before the high momentum flow spreads radially outward. Frame (b) shows the obstacle at X/D = −0.5, with the rotor axis directly above the centre of the obstacle. The upper surface of the obstacle presents a zone of enhanced ground effect, and the flow spreads out as it approaches the obstacle upper surface; but after the wake shear layer passes over the edge of the upper surface, it then proceeds downwards at a shallow angle. A gentle recirculation is induced between this strong shear layer, the obstacle side face and the ground, and this is shown by the streamlines on the PIV plot. The wake shear layer itself is a highly unsteady flow because it contains the trailed-tip vortices, so the impingement of this shear layer on the obstacle is expected to induce strong, unsteady pressure signals in that vicinity. Frame (c) of this figure shows the obstacle outboard at X/D = 1.0. The rotor wake impinges on the ground and spreads out in a similar way to frame (a), but the presence of the obstacle prevents the further radial spreading of the wake and deflects the wake flow upwards. The PIV shows a strong variation of mean velocity on the side of the obstacle from the ground upwards, with very low mean velocity at the ground, suggesting high pressure, and velocity increasing further up, suggesting a fall in pressure in that direction. The mean flow streamlines suggest a gentle recirculation between the rotor and the obstacle face. Figure 5 shows two obstacle spacings with the rotor height 1.43D. Frame (a) with the rotor axis directly above the centre of the obstacle can be compared with Fig. 4 frame (b) for the higher rotor height. The wake velocities are larger at the lower rotor height, but the overall features are similar. Frame (b) of Fig. 5 shows the obstacle at X/D = 0.5, so the edge of the rotor disc is directly over the edge of the obstacle. As the wake approaches the ground, the presence of the obstacle prevents it from spreading out radially; instead, the obstacle face and the momentum due to the remainder of the rotor wake flow deflects the flow into the out-of-plane direction, which cannot be detected with the two-component PIV. Flow is drawn over the top of the obstacle towards the rotor wake, and this flow then turns downwards to pass over the vertical face of the obstacle due to the entrainment of the rotor wake. Finally, Fig. 6 shows the rotor at height 1D above the ground, showing the flow without the obstacle and the flow with the obstacle at X/D = 1. Compared to the higher rotor height in Fig. 4 for the same obstacle spacing distance, the wake velocity is higher, velocity magnitude close to the obstacle face is greater, and the recirculation between the obstacle face and the rotor appears to be stronger. While the subject of this paper is not the so-called brownout phenomenon due to ingestion of fine dust particles into the rotor wake, the flow visualisation using PIV implies that the presence of the ground obstacle would worsen the effect due to the wake confinement and recirculation close to the rotor.
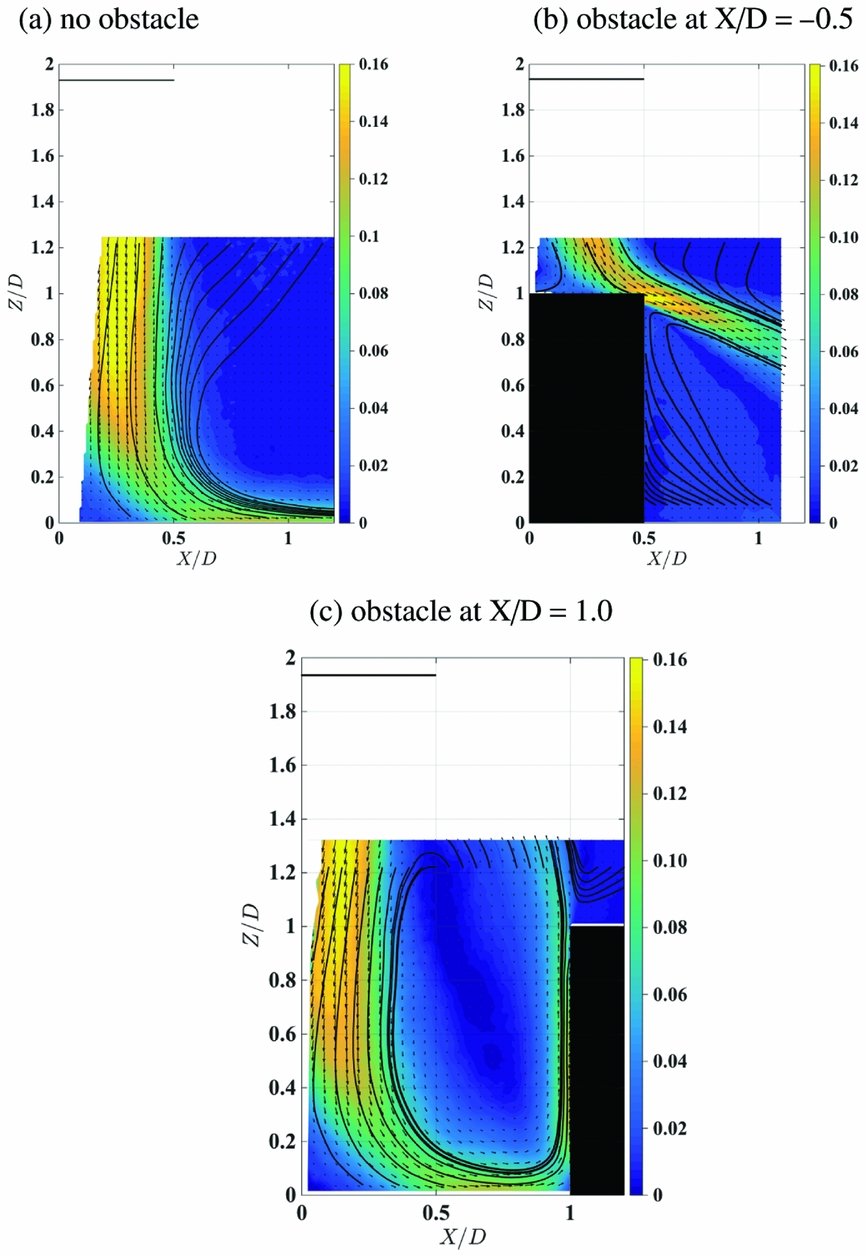
Figure 4. Contour plot of the PIV mean flow velocities produced with the rotor at H/D = 1.93 with (a) no obstacle, (b) obstacle at X/D = −0.5, (c) obstacle at X/D = 1.0. The contours are in-plane velocity magnitude; velocity is scaled by the tip velocity V T. Velocity vector arrows indicate magnitude and direction, and the solid lines are mean flow streamlines.
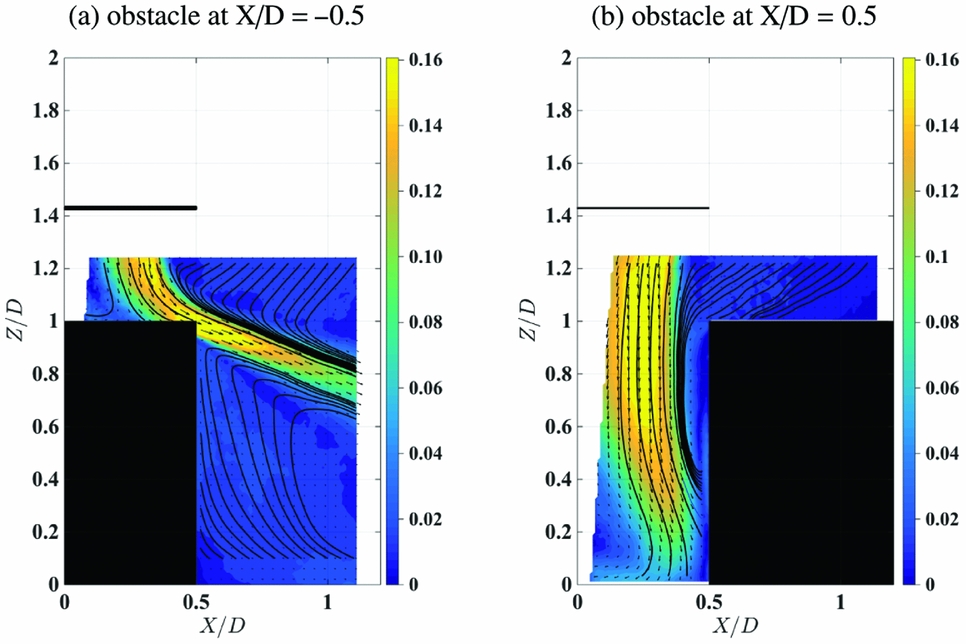
Figure 5. Contour plot of the PIV mean flow velocities produced with the rotor at H/D = 1.43 with the obstacle at (a) obstacle at X/D = −0.5, (b) obstacle at X/D = 0.5. The contours are in-plane velocity magnitude; velocity is scaled by the tip velocity V T. Velocity vector arrows indicate magnitude and direction, and the solid lines are mean flow streamlines.
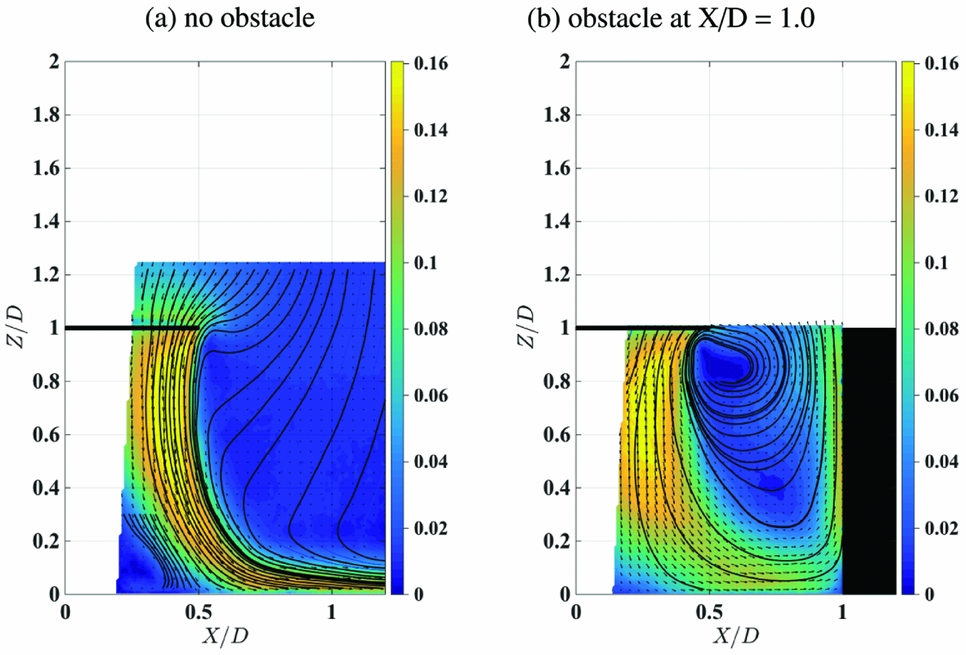
Figure 6. Contour plot of the PIV mean flow velocities produced with the rotor at H/D = 1.0 (a) without the obstacle, (b) with the obstacle at X/D = 1.0. The contours are in-plane velocity magnitude; velocity is scaled by the tip velocity V T. Velocity vector arrows indicate magnitude and direction, and the solid lines are mean flow streamlines.
Smoke flow visualisation was most effective when the smoke wand was positioned to permit smoke entrainment into the vortices as they formed. Figure 7 shows a typical rotor wake visualisation with the rotor at 1.93D above the ground and the rotor axis directly over the centre of the obstacle. Feature (i) shows the vortex cores, (ii) is the rotor and (iii) is the swan neck of the smoke wand. Faint wisps of smoke can be seen to the left of the vortex cores, and these are the helical vortex filaments. This figure shows the trajectory of the vortex cores down towards the obstacle surface, suggesting that the vortex cores impinge on the obstacle edge. Figure 8 shows the rotor at height 1.93D but with the obstacle at X/D = 0. The image again shows a freshly formed vortex core, the vortices passing down towards the obstacle; but the smoke trajectory at the obstacle upper surface is outboard, (ii), indicated by the arrow. The wispy, helical vortex filaments are clearly visible in this image, (i). Figure 9 with the rotor at 1.93D and the obstacle at X/D = 0.5 now shows the vortices passing to the left of the obstacle edge and down past the vertical face. Figure 10 with the rotor at a lower height and the rotor axis directly above the centre of the obstacle, shows the rotor wake impingement on the obstacle edge; a young vortex is shown springing from the edge of the rotor disc, and the smoke shows the track of the vortex filaments, with (ii) indicating an aged, deflected vortex after it has passed over the edge. The trajectory of the smoke is reflected in the mean flow streamlines of the PIV in Fig. 5 frame (a). Finally, Fig. 11 shows a highly distorted vortex filament (ii) that has passed over the corner of the obstacle; at this rotor height, the vortices are relatively young when they impinge on the obstacle edge, and without the obstacle present, the vortices would present as smoothly curved helical filaments. Filament distortion due to interaction with the corner of the obstacle is evident in this picture.
Figure 7. Smoke flow image of the rotor wake produced with the rotor at H/D = 1.93 and the obstacle at X/D = −0.5. (i) Blade-Tip Vortices, (ii) Rotor, (iii) Smoke Wand.
Figure 8. Smoke flow images of the rotor wake produced with the rotor at H/D = 1.93 and the obstacle at X/D = 0.0. (i) Part of helical vortex filament; (ii) vortices impacting on upper surface of obstacle.
Figure 9. Smoke flow image of the rotor wake with the rotor at H/D = 1.93 and the obstacle at X/D = 0.5. Smoke entrained into the vortices passing down past the front face of the obstacle.
Figure 10. Smoke flow image of the rotor wake produced with the rotor at H/D = 1.43 and the obstacle at X/D = −0.5. (i) Blade tip vortex; (ii) Deflected blade tip vortex.
Figure 11. Smoke flow image of the deformation of the blade-tip vortex interactions with the obstacle produced with the rotor operating at H/D = 1.43 and the obstacle located at X/D = −0.5. (i) Vortex filament prior to passing over corner; (ii) Deformed segment of vortex filament after passing over corner.
3.2 Surface pressure distributions
Contour maps of the mean coefficient of pressure −C p have been plotted onto the front and top surfaces of the cuboid obstacle to give an overview of the loading distributions. Pressure coefficient is scaled with the blade-tip dynamic pressure,  ${1 \over 2} \rho V_T^2$. Results are shown in Figs 12–14 for 1.93D, 1.43D and 1.0D rotor height, respectively. For Figs 12 and 13, rotor obstacle spacing increases from frame (a), with the rotor directly above the centre of the obstacle, to frame (i) at X/D = 4. High positive pressure on the upper surface is observed for all cases where the rotor disc overlaps with the upper surface of the obstacle, and the pressure is higher if the rotor is closer to the obstacle surface. Frame (b) of both figures at X/D = 0 shows an interesting crescent-shaped band of high pressure. Flow visualisation for 1.93D rotor height for this configuration is shown in Fig. 8, where the spreading out of the smoke has been annotated for clarity. The high pressure is due to the direct impingement of the wake vortices onto the surface, and the crescent shape is a consequence of the subsequent spreading out of the wake flow over the upper surface. Frame (b) at the lower rotor height, Fig. 13, shows a similar feature but with higher pressure. Frame (d) of Figs 12 and 13 is for rotor spacing X/D = 0.5, and suction can be see on the top surface and positive pressure can be seen on the front surface. PIV showed entrained flow over the upper surface towards the rotor (frame (b) of Fig. 5), and both flow visualisation (Fig. 9) and the PIV show the wake passing down the side of the obstacle at this spacing. The induced flow towards the rotor causes the suction on the upper surface, and the wake flow down the side causes the high positive pressure around the ground/obstacle edge. The effect is greater at the lower rotor height due to the increased confinement of the wake by the ground and the obstacle. Flow visualisation and PIV showed the development of the recirculation zone between the obstacle and the rotor as the obstacle was moved even farther outboard, and the subsequent pressure distributions in frames (e) to (h) of these figures show high pressure associated with the impingement of the recirculation on the ground/obstacle edge, and lower pressure higher up as the flow accelerates towards the top surface. Frame (i) on both figures shows notionally ambient pressure on both the upper and front surfaces at the obstacle distance X/D = 4. Figure 14 shows pressure distributions for rotor height 1.0D, and obstacle locations from X/D = 0.75 outboard are shown. The upper surface pressure shows only weak suction, and this will be due to rotor inflow and wake recirculation. The front face shows high positive pressure at the ground/obstacle edge with suction higher up, and this is due to the recirculation zone set up between the rotor, ground and obstacle. At lower rotor heights, more intense pressure is observed on the obstacle front face.
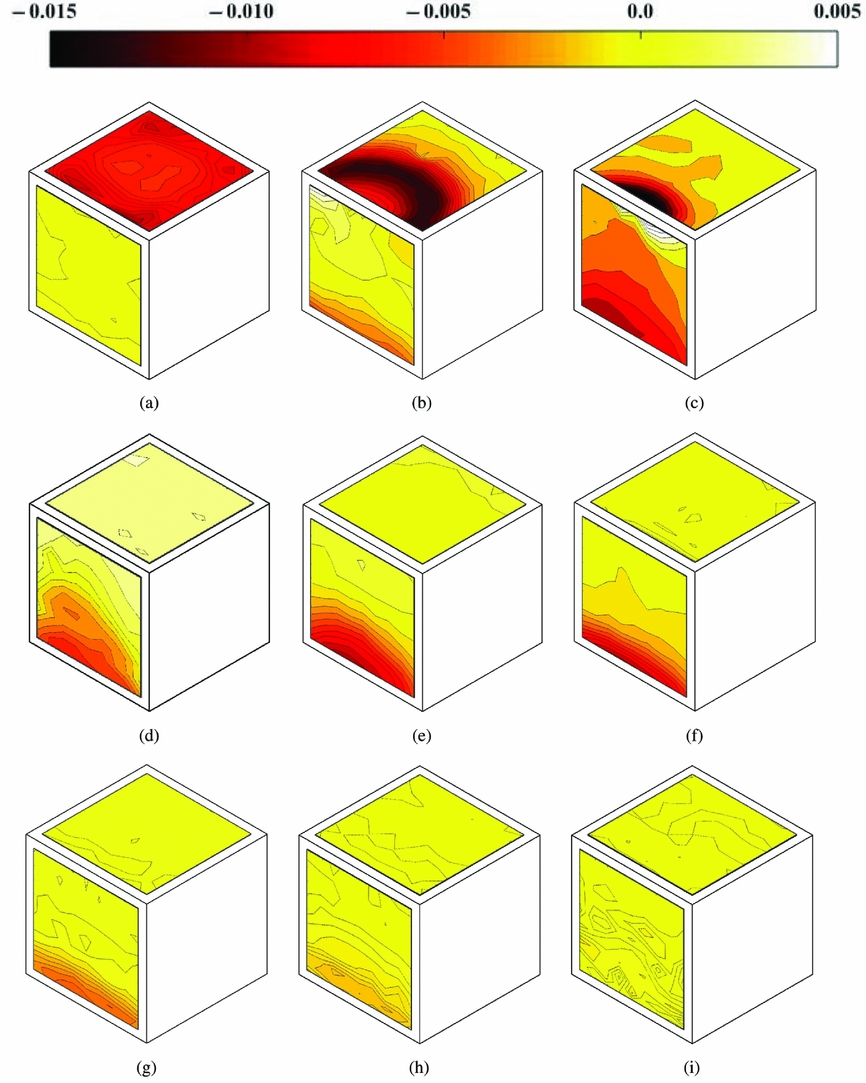
Figure 12. Surface plots of pressure coefficient (-C p) on the obstacle front and top faces with the rotor at H/D = 1.93 and the obstacle at: (a) X/D = −0.5, (b) X/D = 0, (c) X/D = 0.25, (d) X/D = 0.5, (e) X/D = 0.75, (f) X/D = 1.0, (g) X/D = 2.0, (h) X/D = 3.0, (i) X/D = 4.0.
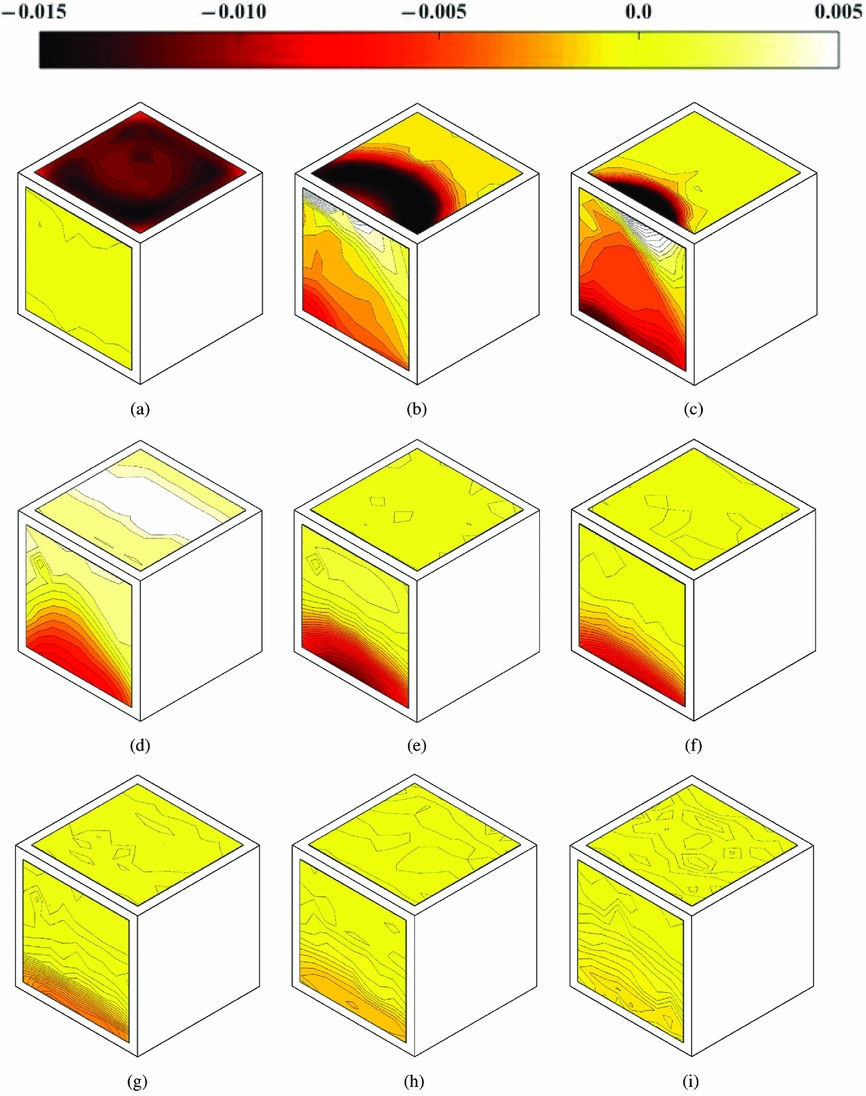
Figure 13. Surface plots of pressure coefficient (-C p) on the obstacle front and top faces with the rotor at H/D = 1.43 and the obstacle at: (a) X/D = −0.5, (b) X/D = 0, (c) X/D = 0.25, (d) X/D = 0.5, (e) X/D = 0.75, (f) X/D = 1.0, (g) X/D = 2.0, (h) X/D = 3.0, (i) X/D = 4.0.
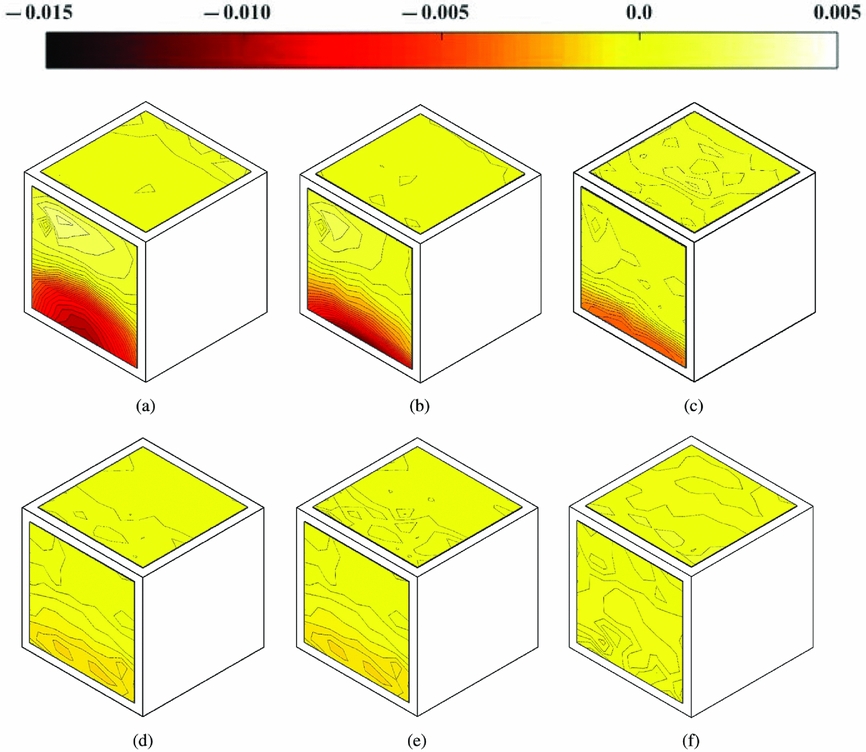
Figure 14. Surface plots of pressure coefficient (-C p) on the obstacle front and top faces with the rotor at H/D = 1.0 and the obstacle at: (a) X/D = 0.75, (b) X/D = 1.0, (c) X/D = 2.0, (d) X/D = 3.0, (e) X/D = 3.5, (f) X/D = 4.0.
4.0 DISCUSSION
The PIV, flow visualisation and surface pressure distributions show large-scale recirculation zones (of the order of the rotor diameter in scale), wake impingement, vortex interactions and the development of strong positive and suction pressures during the wake/obstacle interactions. Compared to the work reported by Gibertini et al(Reference Gibertini, Grassi, Parolini, Zagaglia and Zanotti14), the current study uses a different-shaped obstacle (1D cube compared to the parallelepiped), there is a higher spatial resolution of pressure measurements with a coverage that extends closer to the front face/upper face edge and front face/floor edge, and the coverage of the flow field using PIV is more extensive to show induced flow phenomena close to the surfaces. Additionally, (described later in this section) unsteady pressure data are available.
Integration of the surface pressure distributions reveals the surface forces, and Figs 15 and 16 show these forces for the top and front surfaces, respectively. The forces have been scaled with the rotor thrust T, and the plots show the variation of the force with rotor height and distance of the rotor from the obstacle. Figure 15 for the top surface shows a high positive (down) force when the rotor is directly above the obstacle, and this force reduces rapidly to a negative (upwards) force at X/D = 0.5 when the rotor disc edge is above the obstacle edge. The forces have stronger magnitude at the lower rotor height. The positive force when the rotor overlaps the upper surface is due to the direct wake impingement, and the suction is due to the induced flow over the upper surface by the wake movement down the side. As obstacle distance increases, the net force becomes negligible, and the rotor and wake are too far from the obstacle top to have any significant effect. Forces on the front face, Fig. 16, are lower in magnitude and have a more dramatic variation. A positive force is towards the obstacle. When the rotor is directly over the obstacle the side force is almost zero, but movement of the obstacle results in maximum side force at X/D = 0.25. This is part way between the cases when the wake impinges directly onto the upper surface at closer obstacle spacing, or passes down past the front face at higher obstacle spacing. The highest positive pressure is observed at the obstacle/ground corner in this case. It was not possible to do PIV for this case because of excessive shadow beneath the rotor hub, but the flow visualisation results suggest the high positive pressure at the ground is the result of passage of wake flow down the side of the obstacle and its subsequent impingement on the ground. At higher obstacle spacing, the wake vortices impinge on the ground (as revealed by the PIV), so the side force is low, and as obstacle spacing increases further, the recirculation builds up, causing an increase of side force that diminishes to zero as the obstacle distance increases and the recirculation becomes less energetic. When the rotor disc is below the plane of the upper surface, the side force is initially weak at close obstacle spacing, and becomes positive as the recirculation zone\break builds up.
Figure 15. Variation of the non-dimensional force F/T exerted on the top face of the obstacle as the lateral displacement X/D between the rotor axis and the obstacle front face varied.
Figure 16. Variation of the non-dimensional force F/T exerted on the front face of the obstacle as the lateral displacement X/D between the rotor axis and the obstacle front face varied.
The rotor wake/obstacle interaction is fundamentally an unsteady process. Root Mean Square (RMS) of the time varying pressure signal relative to the mean pressure has been calculated from the pressure data, and representative RMS pressure distributions are shown on Figs 17 and 18 for the top and front faces, respectively. The top surface RMS pressures, Fig. 17, are for rotor height 1.43D. High RMS signals on the top surface are only observed when the rotor disc overlaps with the top of the obstacle. The impingement of the rotor vortices on the top surface is shown by the curved arc of high RMS pressure, while low RMS pressure is observed around the rotor axis location. Particularly strong RMS pressure levels are seen for the obstacle spacing X/D = 0.25, and in this case, the wake vortices impinge close to the upper edge of the obstacle. At this obstacle position, high RMS pressures are observed along the top line of pressure tappings on the front face also. At higher rotor/obstacle spacing, the RMS pressure on the upper surface becomes very low as the wake impingement ceases. Note that the RMS pressure levels are about one third of the level of the mean pressure, so the local unsteady loading is significant. PIV data on Fig. 5 show the rotor wake trajectory at this rotor height for rotor spacings X/D = −0.5 with wake impingement on the top surface and X/D = 0.5 without wake impingement on the top surface, and these would help to explain the RMS pressure distributions. Figure 18 for the front of the obstacle shows three rotor heights for rotor spacing X/D = 0.75. Frame (a) for this figure is for rotor height H/D = 1.43, and the RMS signal shows a moderate unsteady pressure just above the obstacle/ground edge. Frame (b) for the lower rotor height H/D = 1.0 shows a much higher unsteadiness in the pressure signal, the reason for this being the greater confinement of the rotor wake due to the lower rotor height; and frame (c) for H/D = 0.5 shows even greater RMS signal again. The front face shows the strongest signal around the obstacle/ground edge, where wake impingement on the front face occurs, and this in turn is stronger at the lower rotor height. The unsteadiness of the signal is driven by the recirculation set up between the rotor, ground and obstacle front face, and this carries the wake vortices towards the obstacle and up the front face, see Fig. 5. At high obstacle spacing, the RMS signals are low, and this is due to the attenuation of the wake vortices caused by their spreading out over the ground and the turbulent diffusion of the vorticity.
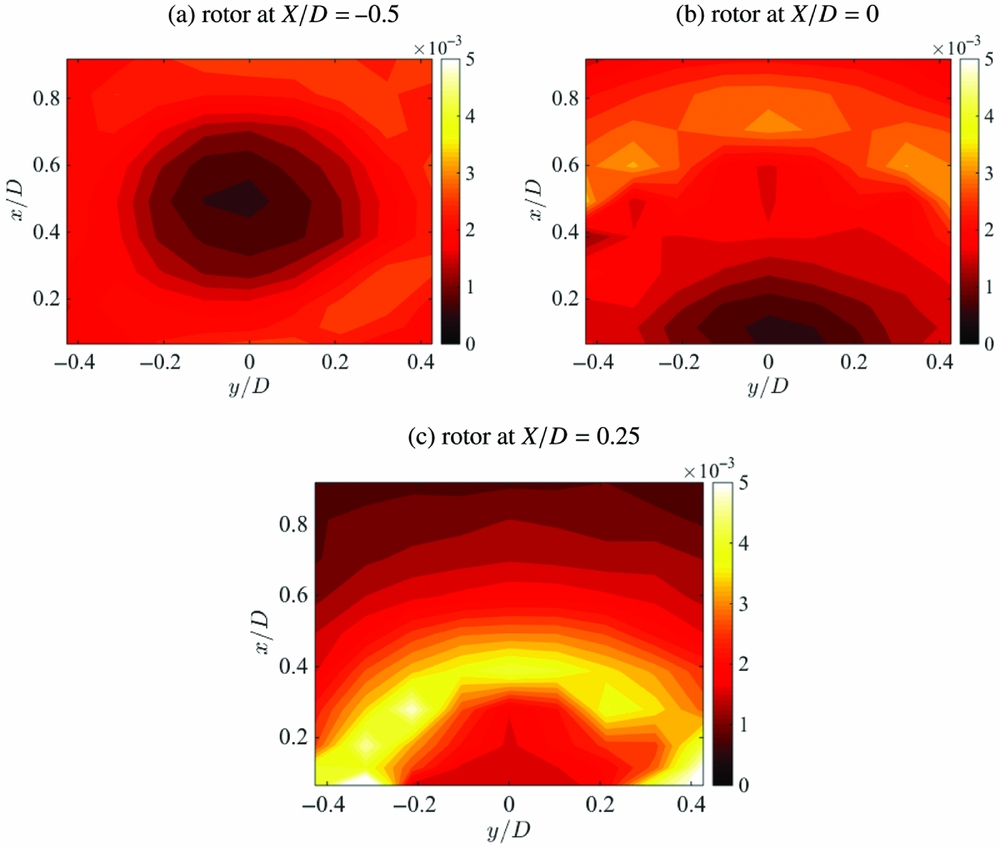
Figure 17. Contour plots of the RMS pressure variation on the obstacle top face with rotor height at H/D = 1.43 and obstacle at (a) X/D = −0.5, (b) X/D = 0, (c) X/D = 0.25.
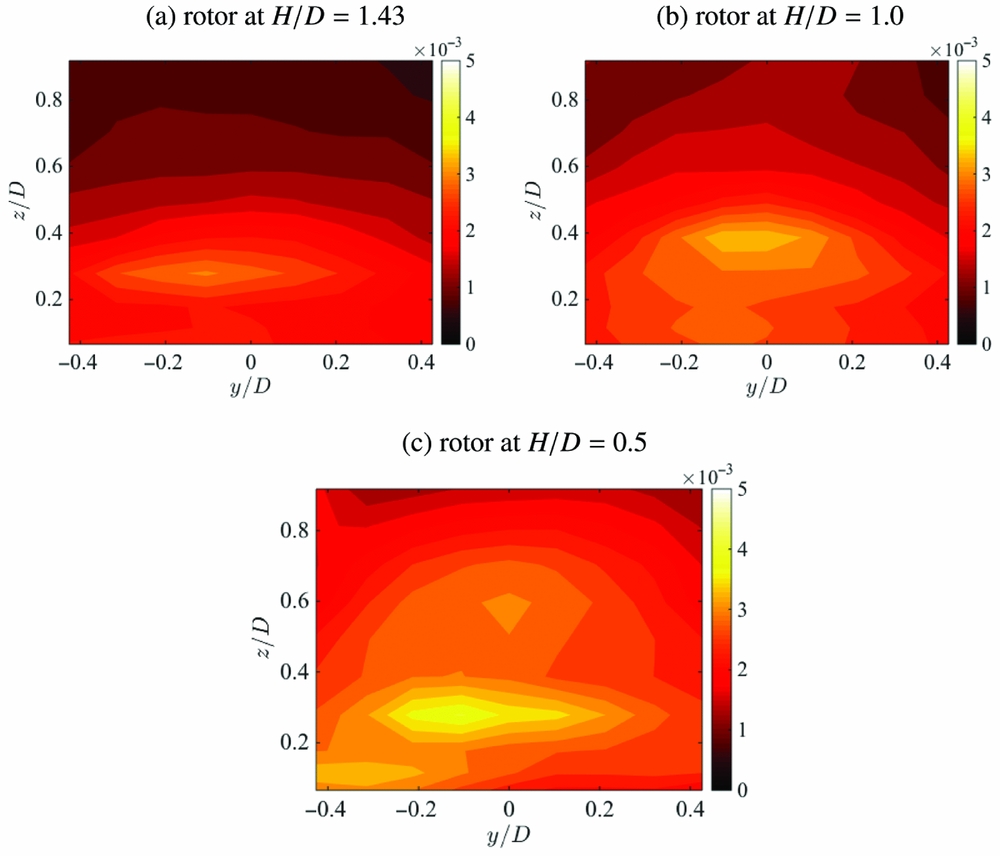
Figure 18. Contour plots of the RMS pressure variation on the obstacle front face with rotor spacing at X/D = 0.75 and rotor at (a) H/D = 1.43, (b) H/D = 1.0, (c) H/D = 0.5.
The unsteady nature of the surface pressure leads to the question of the spectral content of the pressure signals. It is well known that vortex interactions with walls can induce separation(Reference Doligalski, Smith and Walker17), so the rotor wake interaction with the obstacle surfaces is expected to show significant non-linearity. More recent high resolution measurements of rotor wakes in ground effect (for example(Reference Milluzzo and Leishman18)) show a much more complicated vortex wake structure beneath a rotor than previously known. The rotor wake itself is not simply a set of inter-twined helical vortices, it is a complex, evolving flow field containing a range of spatial scales (for example Ramasamyetal(Reference Ramasamy, Johnson and Leishman19) observed Taylor-Görtler vortices in a rotor wake), and ground effect is known to modify the wake development in advance of the vortex/ground interaction itself. The vortices are still relatively young when they interact with the obstacle surfaces, but flow visualisation presented in this paper shows significant turbulent diffusion has occurred by the time the vortices reach the obstacle upper surface. Therefore, while the dominant driving frequency is the blade passing frequency (in this case, two-per-revolution), other spectral components ought to be present. The case with the rotor at height 1.43D with obstacle spacing X/D = 0 (Fig. 17, frame (b)) is chosen as there is significant overlap between the rotor disc and upper surface and a wide distribution of high RMS pressure. Pressure spectra for three surface tapping locations along the centre-line of the top surface at x/D = 0.38, 0.70 and 0.92 are shown in Fig. 19. The flow visualisation image at rotor height H/D = 1.93 shown in Fig. 8 is appropriate for the pressure data case shown; after impacting on the upper surface of the obstacle, the flow visualisation shows the vortex wake passing over the upper surface away from the rotor axis (see Fig. 8). Figure 19 frame (a) showing the spectral analysis at x/D = 0.38 shows two peaks, one at the blade passing frequency (non-dimensional frequency 2), and a smaller peak at 2.3 × the rotational speed. Note, there are two very weak peaks at 3.6 and 3.7 × the rotational frequency. This frame is early on in the surface/wake interaction. Frame (b) is later and further outboard at x/D = 0.7, and many more spectral peaks are observed. Firstly, there are the same sets of frequencies as with frame (a), but the higher frequency peaks are now much stronger; but a peak at 4 × the rotational frequency is observed, and lower frequency peaks at 1.3 and 1.7 × the rotational frequency are seen also. Note that the RMS pressure plotted in Fig. 17 shows higher signal RMS at x/D = 0.7 compared to x/D = 0.3 for this rotor spacing. Finally, the most outboard location at x/D = 0.92 shows only weak peaks at 2, 3.6 and 3.7 × the rotational frequency. The pressure scanning modules were on the end of long tubes, but the attenuation and phase shift effect would be the same for each tapping location. Figure 20 shows selected spectra with the obstacle spacing X/D = 0.25 for the same rotor height, but with pressure tappings at x/D = 0.17, 0.38 and 0.7, and the reader should refer to Fig. 17 again for the RMS pressure at this rotor spacing. Again, the vortex track is outboard away from the rotor axis, and the spectra show remarkably similar development to those for the X/D = 0 obstacle spacing in the previous figure. Frames (a) and (b) of Fig. 19 and frames (b) and (c) of Fig. 20 are in fact the same two respective tapping locations, and note that frame (b) of each figure are at almost the same distance from the rotor axis, and the RMS levels are both very high. The change in spectral content with the wake development over the upper surface reveals a highly non-linear interaction, but note that the wake/upper surface interaction is very different from the interaction with a plane ground, in that the latter extends to infinity also. A vortex stretching effect will be significant in the interaction with the obstacle upper surface as the wake vortices are still relatively young.
Figure 19. Frequency spectra of individual pressure tapping signals along the centre-line of the obstacle top surface for rotor height H/D = 1.43, obstacle spacing X/D = 0. Frequency has been scaled with the rotor rotational frequency; amplitude has been scaled with  $\frac{1}{2} \rho V_T^2$.
Figure 20. Frequency spectra of individual pressure tapping signals along the centre-line of the obstacle top surface for rotor height H/D = 1.43; obstacle spacing X/D = 0.25. Frequency has been scaled with the rotor rotational frequency; amplitude has been scaled with  $\frac{1}{2} \rho V_T^2$.
5.0 CONCLUSIONS
An investigation of rotor wake interactions with an obstacle has been performed using flow visualisation and surface pressure measurement. The phenomena are driven by the convecting rotor wake vortices, their deflection due to the ground and obstacle surfaces, and the development of a large-scale recirculation of the rotor wake. PIV and flow visualisation show that when the rotor is above the obstacle, the upper surface deflects the wake outward in a similar manner to ground effect over a plane surface, but that when the wake passes over the obstacle edge it regains some downward momentum, and a weak flow is induced up the side face of the obstacle. When the rotor is off to the side of the obstacle but at a relatively small distance away, the presence of the obstacle face prevents the wake from spreading out, and the wake vortices track close to the wall. At greater separation distances the wake can spread out over the ground, and the effect of the obstacle is to then generate an interaction between the rotor and obstacle to form a large-scale recirculation with high upward velocity close to the wall. Smoke flow visualisation shows strong distortion of vortex filaments during the vortex-obstacle interaction. High resolution pressure measurements show that wake interaction with the obstacle upper surface is particularly strong, and pressures at the obstacle edges are especially high when the wake impinges directly onto the edges. Obstacle top and side surface forces are dependent upon the rotor height and obstacle-to-rotor spacing, and the forces diminish to zero at large rotor/obstacle spacing. The top surface experiences a significant downward force when there is large overlap with the rotor disc. The force on the obstacle front face is lower in magnitude, and the pressure loading is most intense at the upper edge and the ground/obstacle edge. The nature of the pressure loading due to the wake on the upper and front faces is unsteady, with greatest levels of fluctuating pressure occurring on the upper surface when there is partial overlap of the rotor disc with the obstacle upper surface. Spectral analysis of individual pressure signals close to the rotor axis shows a dominant frequency equal to the blade passing frequency, but there is a richer spectral content further outboard leading to the disappearance of the blade passing frequency and the appearance of much higher frequency components.
ACKNOWLEDGEMENTS
The work forms part of the GARTEUR AG22 project “Forces on obstacles in a rotor wake”. Pressure measurement and flow visualisation instrumentation used for this project was provided by the National Wind Tunnel Facility funded by EPSRC, grant number EP/L024888/1.


