NOMENCLATURE
- AIP
-
Aeronautical Information Publication
- APRT
-
Number Of Airports In Airspace
- ATC
-
Air Traffic Control
- ATM
-
Air Traffic Management
- ATS
-
Air Traffic Services
- ENPO
-
Number of Entry Points to the Airspace
- ICAO
-
International Civil Aviation Organization
- LTBA
-
ICAO code for Ataturk Airport
- LTBU
-
ICAO code for Corlu Airport
- LTFJ
-
ICAO code for Sabiha Gokcen Airport
- NFIX
-
Number of Fixes in the Airspace
- NM
-
Nautical Mile
- NFLG
-
Number of Flight Operations
- NPWB
-
Probability of Wide-Body Aircraft
- RNAV
-
Area Navigation
- SID
-
Standard Instrument Departure
- SIMMOD
-
The Airport and Airspace Simulation Model
- STAR
-
Standard Arrival Route
- TMA
-
Terminal Airspace
1.0 INTRODUCTION
Air Traffic Management (ATM) research focuses on achieving a safer, more effective and economical air traffic system. Numerous studies in various fields of aviation have been conducted to achieve these precepts. Aircraft designers focus on the development of safer, faster and more efficient aircraft while social scientists focus on human factors to provide a safer and error-free working environment for pilots and air traffic controllers. Similarly, airspace designers work on ways to enhance airspace capacity and to develop a more flexible airspace for safer and expedited traffic flow. All of this research and development can merge into a multi-disciplinary approach. This study aims to provide an alternative multi-disciplinary approach combining simulation and statistical analysis techniques for the evaluation and resolution of air traffic management problems.
A typical aircraft trajectory between two airports consists of three main phases during the flight Fig. 1. The first phase includes takeoff, landing and ground movements at the airports. The second phase is the initial climb phase after takeoff or descent movements before landing, which takes place in the Terminal Airspace (TMAs). TMAs are control areas normally established at the confluence of ATS routes in the vicinity of one or more major aerodromes(1). The third phase is en-route, in which cruise flight takes place along designated air routes. TMAs are the conjunction of airports and air routes, and consequently have a significant impact on the throughput of airports and en-route airspace. Therefore, the reorganization of TMAs is crucial to accommodate the increasing number of flights(Reference Wei and Chaowei2). Terminal airspaces are more complicated than en-route airspaces and airports due to their complex and flexible route network and reduced separation minima. Unlike en-route airspaces in which routes intersect at specific points, terminal airspaces contain many converging routes towards a few common points around airports, such as final approach fixes for landing(Reference Janic and Tosic3). In addition to their complicated route network, flight operations are relatively complex in TMAs. As aircraft commence their flight in a TMA, they are required to adjust their airspeed, altitude and heading continuously in order to perform their descent for approach and landing, their initial and en-route climb for departure, or their turning manoeuvres for holding in the air. All these complications impose constraints on the capacities of TMAs. This study focuses on the analysis of delays in TMAs in order to identify the impact of these constraints quantitatively.

Figure 1. Aircraft trajectory between two airports.
Numerous factors can affect the capacity of an airport or airspace sector temporarily or permanently. These factors are quantitatively well defined for airside and landside components of airports(Reference Horonjeff and McKelvey4). Different approaches are available to define the factors affecting airspace capacities. In the Airport Capacity Enhancement Report from Eurocontrol( Reference Kelton and Law 6 ), the primary factors determining the capacities of airports and TMAs are listed as airfield configuration, airspace design, ATC operational rules, ATC facilities, aircraft, pilot and controller performance, traffic mix (aircraft types), traffic distribution (arrival and departure flows), predominant weather conditions and environmental constraints(5).
The capacity can be expressed as a mathematical function of all these factors; therefore, any change in one of the factors can affect the capacity (Fig. 2). Some of these factors may depend on the structure of the airspace whereas some depend on the hourly or daily traffic demand of the airspace. Rather than estimating the effects of these factors on capacity individually, this study primarily aims to provide a mathematical model to express their combined effect on capacity in terms of airspace delay using linear regression techniques. Therefore, airspace delays can be described parametrically as a multivariate linear function of the selected set of factors. There has been no similar approach attempting to formulate the effect of multiple factors on airspace capacity mathematically in the previous studies. Such a parametric model can provide an insight to the experts during the design and policy-making steps of airspace organisation and air traffic flow management processes.

Figure 2. Relationship between capacity and dement.
In this study, SIMMOD was used as a fast-time simulation tool for building the simulation model of the chosen terminal airspace. SIMMOD is a modelling tool that is frequently used for both airspace and airport capacity modelling. Creating a fast-time simulation model was important for calculating delay data in this study. The model was used to gain some understanding of how the corresponding system behaves. In the simulation, software was used to evaluate a model numerically and data were gathered in order to estimate the desired true characteristics of the model. Fast-time simulation, a commonly used technique in ATM, deals with the modelling of a dynamic system using state variables representing instantaneous change at separate points in time. These points are the ones at which an event occurs, where an event is defined as an instantaneous occurrence that may change the state of the system(Reference Kelton and Law6).
Majumdar and Ochieng(Reference Majumdar and Ochieng7) focused on the effects of controller workload on capacities using a time-series analysis based on the data obtained from fast-time simulations. Rydin(Reference Rydin8) described the factors limiting TMAs capacity as weather conditions, runway configurations of airports in TMAs, airspace complexity and environmental impacts in his study conducted for Stockholm TMA.
The Wei and Chaowei study(Reference Wei and Chaowei2) is an example of research that analyses TMA airspace capacity and delays of SID and STARs. The Kleinman, Hill and Ilanda study(Reference Kleinman, Hill and Ilenda9) is another study using SIMMOD for delay analysis and optimization. In another study(Reference Gao, Xu, Diao and Ding10), delay and cost analysis in a multi-airport system was analysed by using SIMMOD.
Fast-time simulation studies in current literature have focused on the estimation and enhancement of the current capacity of TMAs for different operational scenarios rather than identifying the factors affecting the capacity quantitatively. Furthermore, the factors considered in these studies were merely based on observations or past experience and no methodic approach was used to determine their impact. This study proposes a methodical framework based on simulations and statistical techniques to find the primary causes of delays in TMAs. This framework can help airspace designers consider airspace delay factors while creating or enhancing a TMA's structure.
When an airspace structure is studied, the first step should be to identify airspace conditions and delay reasons. Therefore, our first step was to design a fast-time simulation model of a sample airspace for collecting delay data. After building up the airspace model using SIMMOD, simulation experiments were run on various traffic scenarios. Next, correlation analysis was provided and linear regression models were employed to model delay. It was found that the delay was explained by the number of airports, the number of entry points and the probability of wide-body aircraft.
The rest of this paper is organized as follows. Section 2 provides the modelled air space structure SIMMOD Model and experiment. Section 3 provides statistical analyses and regression procedure. Finally, the last section summarizes the conclusions of the study.
2.0 MODEL DESCRIPTION
2.1 SIMMOD model description
ATM systems include very complicated service networks with globally scaled interactions. Rapid growth in air transportation and developments in technology require a major paradigm shift and structural changes in the system. In order to develop, evaluate, test and validate new ATM concepts and paradigms, researchers need computer-aided tools and models including various metrics regarding safety, capacity and efficiency(Reference Odoni, Bowman, Delahaye, Deyst, Feron, Hansman, Khan, Kuchar, Pujet and Simpson11).
Simulation is a set of methods and techniques using physical or mathematical models to analyse the behaviour of the complex real-world systems dynamically(Reference Kelton and Law6). Two different types of simulation methods have been employed in ATM research: real-time and fast-time simulations. Real-time simulations typically include humans in the simulation cycle and usually consist of the physical representation of the environment to be simulated, such as radar or aerodrome control units as well as computer software and equipment for image generation. Fast-time simulations, on the other hand, include stand-alone computer software that helps users track air traffic flow at specific points and to determine the behaviour of the system. Fast-time simulations utilize three primary methods: Monte Carlo, continuous-time and discrete-event simulations. Discrete-event simulation is the most commonly employed fast-time simulation technique in ATM research because it allows for more efficient, traceable and reliable analysis for the study of deterministic and stochastic dynamic problems. SIMMOD, TAAM and RAMS are among the most common discrete-event simulation software applications for modelling and simulation of air traffic flows in airspace and airports(Reference Odoni, Bowman, Delahaye, Deyst, Feron, Hansman, Khan, Kuchar, Pujet and Simpson11–13).
In this study, SIMMOD was used to construct the simulation model of the selected airspace. SIMMOD is a discrete-event simulation tool developed by ATAC in the US for airport and airspace modelling(14).
In the simulation model, airspace and aircraft parameters are defined as user-specified inputs. Airspace parameters include geographical coordinates and the geometric properties of routes, route intersections, airports and airport elements such as runways and taxiways. Airspace elements such as routes and route intersections are described in terms of air links and air nodes, whereas airport elements such as runways and taxiways are described in terms of ground nodes. Aircraft parameters consist of the airborne and ground performance data of aircraft such as airspeeds, take-off and landing roll distributions, and separation minima. These data can be modified or new data can be added to the model as necessary.
Model outputs include flight times and delays at a specific point or in the entire model. In the SIMMOD model, all aircraft fly through waypoints (air nodes) along their pre-defined routes in their flight plan. Their estimated time of arrival (ETA) to each waypoint depends on the distance of the route leg (air link) and the airspeed of the aircraft. The queue discipline at waypoints is based on a first-in, first-out principle. If two or more aircraft arrive at the same waypoint around similar ETAs, the first arriving aircraft flies through the waypoint without any delay. Trailing aircraft, on the other hand, experience a certain amount of airborne delay in order to maintain the specified minimum separation distance (i.e., 5 NM) behind the leading aircraft. The airborne delay depends on the separation minima, ETAs and airspeeds of the aircraft. It can be achieved using speed reduction and/or vectoring techniques. The amount of speed reduction and vectoring delay are user-defined parameters and depend on aircraft performance and ATC procedures adapted for the specific airspace. ETAs of the delayed aircraft change depending on the required airborne delay at each waypoint. The total airborne delay of an aircraft is equal to the some of airborne delays received at each waypoint along its flight route. If an aircraft ensures safe separation with other aircraft along its route, it will experience no airborne delay. Therefore, as the number of aircraft increases within the same airspace, airborne delays will increase due to the increased possibility of airborne conflicts.
The analysis of airborne delays within the given airspace can be performed using output files provided by SIMMOD reporter. The reporter also delivers the hourly distributions of the number of flights served for the entire simulation time. The total amount of aircraft served within the specified periods of time are defined as the airspace throughput.
2.2 Airspace model
Istanbul Yesilkoy TMA was chosen for model analysis because of its high traffic density in Turkish airspace. In order to investigate delays and capacity at TMA entry points, the en-route airspace above Yesilkoy TMA (Fig. 3) was included in the model(Reference Aybek and Cavcar15). The three major airports, Ataturk (LTBA), Sabiha Gokcen (LTFJ) and Corlu (LTBU), were also modelled as links for all arriving aircraft sequences within the TMA.

Figure 3. Plan view of Yesilkoy TMA.
Radar control service is provided in the Yesilkoy TMA. RNAV STARs are available for LTBA and LTFJ while conventional STAR is used for LTBU. LTBA, the busiest airport in Turkey, has three runways (35L-17R, 35R-17L and 05–23). LTFJ and LTBU have one runway each Fig. 4.

Figure 4. SIMMOD model view.
2.3 Assumptions and limitations
In order to analyse airspace capacity and delays within the TMA, the following assumptions were made for the model:
-
1. The analysis is limited to arrival traffic flows to the airports within the TMA.
-
2. Arrival traffic use runway 05 at LTBA and LTBU, and runway 06 at LTFJ.
-
3. Separation minima are selected as 10 NM within the en-route airspace and 3 NM within the TMA respectively according to ICAO standards(1) and Turkish AIP(16).
-
4. All arriving aircraft may enter the TMA from any entrance points of en-route airspace and leave it at the final approach point located 4 NM from the threshold of each runway.
2.4 Experiment design
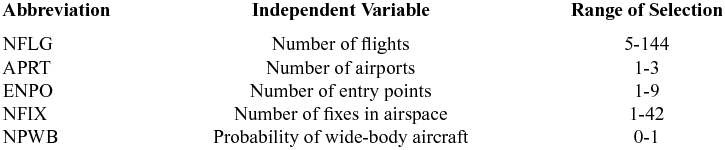
In order to analyse the effects of multiple factors on airspace capacity, thirty simulation experiments were run for different airspace and air traffic parameters in the SIMMOD model. The results of these simulation experiments were used to construct a multi-variable linear regression model in order to describe the conditions that increase or decrease airborne delays within the selected TMA. While the total airborne delay occurring in the TMA is chosen as the only dependent variable in the regression model, the number of airports (APRT), number of entry points (ENPO), number of flights (NFLG), number of the fixes (NFIX) and the probability of wide-body aircraft in the traffic flow (NPWB) are selected as independent variables (Table 1). All these variables have integer values except NPWB which is described in terms of real numbers between 0 and 1.
Table 1 Abbreviations of variables

The number of airports (APRT) in the TMA ranges from 1 to 3 during the simulations, and each one represents the major airports serving commercial flights such that Istanbul Ataturk Airport, Sabiha Gokcen Airport and Corlu Airport. APRT was selected as an independent variable in order to evaluate the net effect of two distinct impacts of multiple airports on the total delay. First, multiple airports may allow for a more even distribution of traffic flow among them; therefore, they can reduce the total airborne delays as a result of reduced probability of conflicts along routes and at route intersections in the TMA for a specified period of time. Second, they can increase the complexity of route networks, which may increase the probability of conflicts and therefore the total airborne delays.
The number of entry points (ENPO) in the TMA varies from 1 to 9 in simulation experiments. The addition of alternative entry points can allow for a more homogenous distribution of traffic loads at each entry point and along the route network. Therefore, ENPO is included in the model as an independent variable to assess how much it decreases the total airborne delay.
The number of fixes in the airspace (NFIX) represents the number of route intersections between the entry points and airports within the TMA. Any increase in the intersection points raises the complexity of the route network and probability of conflicts that can result in an increase in the total delay. The value of NFIX ranges from 1 to 42 in the simulations.
The number of flight operations (NFLG) characterizes the actual traffic demand for the specified period of time in the TMA. The growth in the demand will lead to an increase in the total delay if it exceeds the capacity of the airspace as shown in Fig. 2. The value of NFLG is 5–144 per hour for the simulations.
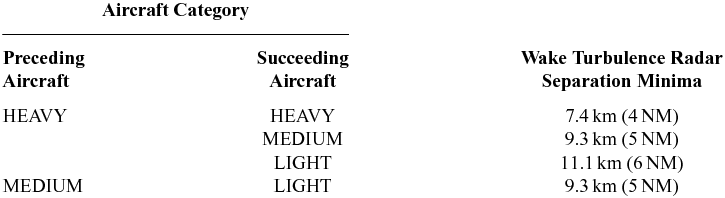
The probability of wide-body aircraft (NPWB) denotes the ratio of heavy category aircraft within the entire population of aircraft entering in the TMA. Heavy-category aircraft require higher wake turbulence separation minima than medium- and light-category aircraft (Table 2); therefore, any increase in their probability has an adverse impact on airborne delays. All these variables have integer values except NPWB, which is described in terms of real numbers between 0 and 1.
Table 2 Wake turbulence category(1)

ICAO classifies all aircraft heavier than 136,000 kg as heavy-category aircraft. Similarly, all aircraft weighing 7,000–136,000 kg are classified as medium category, and all aircraft weighing under 7,000 kg are included in the light category(1). During the final approach of aircraft under radar control, the minimum safe separation distance between two aircraft are listed in Table 1 according to the weight turbulence categories.
The correlations between total flight delay and these independent variables were analysed using a linear regression model. All independent variables were selected randomly for each experiment such that APRT, ENPO, NFIX and NFLG were set between the specified ranges in Table 1.
2.5 Simulation results
The results of the simulation experiment are summarized in Table 3. For example, in the 10th experiment, 15 aircraft with a 20% wide-body share entered the TMA from three different entry points, travelled along 12 fixes and landed at a single airport. The total delay experienced by these flights measured 31 minutes within the TMA. Among 30 experiments, the maximum delay was obtained in the seventh experiment at 1,138 minutes for 144 aircraft. In the 23rd experiment, however, the total delay became zero because no delay-imposing conditions (i.e., conflicts) occurred during the simulation for the given set of parameters. These results indicate the stochastic and dynamic behaviour of simulations. The total delays obtained in 16th and 25th experiments are different (362 and 142 minutes, respectively) for the same number of flights (72). According to these results, flight demand is not the only factor affecting the total delay, but other independent variables have a significant combined impact. Therefore, these results show the importance of the proposed model for evaluating the individual and cumulative effects of these variables on the total airborne delay.
Table 3 Simulation experiment results

3.0 STATISTICAL ANALYSIS
Descriptive statistics indicate that the delay has a leptokurtic normal probability distribution skewed to the right with a mean of 270.9 minutes and a standard deviation of 299.8 minutes (Table 4).
Table 4 Descriptive statistics for the delay data

In order to predict delay parameters and determine the correlation between independent variables, a linear regression analysis was applied to the data. The regression analysis showed that the delay can be described in terms of the selected independent variables. The correlation matrix of independent variables is presented in Table 5. The matrix indicates a strong correlation between the number of entry points (ENPO) and the number of fixes (NFIX). There is also a correlation between ENPO and the number of flights (NFLG).
Table 5 Correlation matrix

**Correlation is significant at the 0.01 level (two-tailed).
*Correlation is significant at the 0.05 level (two-tailed).
Although no correlations were observed between the number of airports (APRT) and other independent variables, the dependent variable and APRT are strongly correlated. Similar to APRT, the probability of wide-body aircraft (NPWB) has no correlation with other independent variables.
Four linear regression models were analysed that were constructed using different variations of independent variables. Table 6 presents R2, F and p-values and the coefficients of these models. All F values are significant and p values are smaller than 0.05; therefore, the models have a significant predictive capability for delay. R2 value of the first model, including all five independent variables and a constant term, is equal to 0.760. Although the second model includes the same independent variables, its R2 value increases to 0.870 due to the exclusion of the constant term. In order to identify the impacts of the three moderately correlated independent variables APRT, ENPO and NPWB on delay, two additional models with and without a constant term were built. The independent variables NFIX and NFLG were not included in these models due to their strong correlation with ENPO and the dependent variable delay, respectively.
Table 6 Regression model table

The first two models indicate that any increase in the number of airports and entry points leads to a decrease in the total delay within the TMA. Therefore, the inclusion of more airports and entry points results in a more even distribution of air traffic density in the TMA. On the other hand, the total delay increases as the number of fixes increases in the TMA because the route network becomes more complicated with the increasing number of intersections. The models also confirm an expected result regarding the number of aircraft entering to the TMA: the delays increase with the increasing number of flights. The increased probability of wide-body aircraft within the traffic also increases the delay because wide-body aircraft requires higher separation minima.
 $$\begin{eqnarray}
Y &=& - 64,174\textit{APRT} - 40,965\textit{ENPO} + 2,361\textit{NFIX} + 8,345\textit{NFLG}\nonumber\\
&& + 113,854\textit{NPWB}
\end{eqnarray}$$
$$\begin{eqnarray}
Y &=& - 64,174\textit{APRT} - 40,965\textit{ENPO} + 2,361\textit{NFIX} + 8,345\textit{NFLG}\nonumber\\
&& + 113,854\textit{NPWB}
\end{eqnarray}$$
In the third model, R2 reduces to 0.486 because of the exclusion of NFIX and NFLG. The exclusion of the constant increased this value to 0.658 in the fourth model. According to these models, the increased number of airports decreases the delay, whereas an increased number of entry points and probability of wide-body aircraft increase the delay.
 $$\begin{equation}
Y = - 104,545\textit{APRT} + 71,372\textit{ENPO} + 212,887\textit{NPW}{B^2}
\end{equation}$$
$$\begin{equation}
Y = - 104,545\textit{APRT} + 71,372\textit{ENPO} + 212,887\textit{NPW}{B^2}
\end{equation}$$
Models with and without constant terms show that the effect of ENPO depends on the inner route network and the flight demand in the TMA (Table 6). When the number of flights and fixes are assumed to be constant, increasing the number of entry points has no positive impact on the total delay. The impact of ENPO on the total delay is sensitive to the flight demand, so for that reason, they should be analysed together. However, although increasing ENPO in accordance with increasing demand can reduce the traffic load and therefore the airborne flights occurring at these points, it may not mitigate the delays occurring at route intersections within the TMA. On the hand, each model clearly shows that increasing the number of airports has a positive impact by reducing the total delay, as it provides for a more even distribution of traffic load (or along the routes and intersections within the TMA).
4.0 CONCLUSION
This study indicates the correlations between the number of entry points and the total delay in a TMA. According to the results obtained from simulations, delays in Yesilkoy TMA depend on the number of aircraft, airports, entry points and the percentage of wide-body aircraft share. Although increasing the number of airports within the TMA results in a reduction in delays, it requires very high initial investments and long-term planning. Adjusting the number of TMA entry points and wide-body aircraft share are operationally achievable options to control the total delay in terms of costs and implementation time. The proposed approach based on linear regression models can provide a helpful tool for airspace designers to analyse potential capacity and delays within TMAs and to find the optimal ratio between entry points and airports in order to minimize the delays for different levels of traffic demand and aircraft mix.
The results of the experiment have shown that aside from flight demands, other factors also have an effect on the delays in airspace. Identifying and expressing these reasons mathematically redounds original value to the study. In this study, the mathematical correlation among the factors that affect the capacity of airspace is identified by creating a regression correlation through an unprecedented perspective within the related literature of air traffic management and simulation studies. This mathematical correlation will become a tool to provide data that will form the basis for airspace designers and that will be able to detect any delay in any condition. If this study is repeated for different airspaces, it will be possible to have a more stable model that is formed via identifying the common points, and this is advised for the future study.
ACKNOWLEDGEMENTS
This study was supported by Anadolu University Scientific Research Projects Commission under grant no:1203F052.