


1.0 INTRODUCTION
Crashworthiness design, verification and certification of transport category aircraft are significantly important for civil aviation safety, and the survivability of passengers and crews can be further enhanced by improving the crashworthiness design of aircraft structures, such as aircraft fuselage structures, cabin internal layouts and facilities(Reference Damodar and Marshall1–Reference Zou, Mou and Feng3). In recent years, composite materials have been used more and more in aircraft structures and gradually applied to the main load-bearing structures. The crashworthiness design and verification of composite aircraft structures mainly rely on the engineering experiences for a long period of time. But the behaviour of composite materials under crash conditions poses particular challenges for engineering analysis. Because it requires modelling beyond the elastic region and into failure initiation and propagation(Reference Feraboli, Wade, Deleo, Rassaian, Higgins and Byar4).
The commercial finite element software codes are developed because of these disadvantages for engineering experiments, such as long design cycles, high costs, poor repeatability, etc. These commercial mainstream codes, such as LS-DYNA, ABAQUS, MSC.Dytran and PAM-CRASH, are available to use for crash simulations of composite aircraft structures(Reference Damodar and Marshall5–Reference Wiggenraad, Michielsen, Santoro, Lepage, Kindervater and Beltran8), and offer built-in material models for composite structures, and each material model utilises different modelling strategy, which includes failure criterion, degradation scheme, material properties, and usually a set of model-specific input parameters that are typically needed for the computation, but do not have an immediate physical meaning(Reference Feraboli, Wade, Deleo, Rassaian, Higgins and Byar4). So, the combination methods of extensive simulations and little experiments, and the establishment and development of simulation analysis method on crashworthiness of composite structures have become important research works.
The crashworthiness studies of composite aircraft structures had been conducted earlier by the United States NASA (National Aeronautics and Space Administration) Langley Research Center. In the late 1990s, many full-scale crash tests of composite aircrafts, such as Beech Starship, CirrusSR-20 and Lancair etc, had been conducted, and the test results showed that these composite aircrafts had perfect crashworthiness capabilities(Reference Terry9,Reference Terry, Hooper and Nicholson10) , and then the in-depth researches were conducted for composite aircraft structures. FAA (Federal Aviation Administration) also conducted many full-scale drop tests and crashworthiness researches of composite aircraft structures involving fibre reinforced materials and issued Advisory Circular AC 20–107B “composite aircraft structure” on September 8, 2009, to provide the airworthiness certification guidance information and acceptable compliance means. The Special Condition 25-362-SC had been issued for the crashworthiness of B787 on September 26, 2007, and B787 must meet the following four crashworthiness criteria for a range of aircraft vertical descent velocities up to 30 ft/sec, such as retention of items of mass, maintenance of acceptable acceleration and loads experienced by the occupants, maintenance of a survivable volume, and maintenance of occupant emergency egress paths.
The European Union had also conducted many crashworthiness research projects, such as the project “CRASHWORTHINESS” and “CRASURV” (The Design for Crash Survivability). The ONERA-Lille and AIRBUS France had redesigned the A320 fuselage frames, and the energy-absorbing sinewave beams were located in the under-floor part of fuselage section. The Netherlands NLR (National Aerospace Laboratory) manufactured the composite sinusoidal specimen and conducted the static tests. The German DLR (Deutsches Zentrum für Luft-und Raumfahrt) was responsible for the dynamic crushing tests. The French CEAT (Centre d'Essais Aéronautiques de Toulous) carried out the crashworthiness tests of fuselage section with subfloor composite sinusoidal specimens and eventually put forward a complete set of crashworthy test methods for composite aircraft based on the crashworthiness researches(Reference David, Didier, Michel and Gérard11,Reference Wiggenraad, Santoro, Lepage, Kindervater and Mañez12) . EASA (European Aviation Safety Agency) also issued Acceptable Means of Compliance AMC 20–29 “composite aircraft structure” on July 26, 2010, but the technical content of this AMC was harmonised with FAA Advisory Circular AC 20–107B.
At the same time, the research scholars had done a lot of researches of composite aircraft structures with the combination methods of test and simulation with varying degrees of success, for circular tubes(Reference Huang and Wang13,Reference Mamalis, Manolakos, Ioannidis and Papapostolou14) , square tubes(Reference Palanivelu, Paepegem, Degrieck, Kakogiannis, Ackeren and Hemelrijck15-Reference Xiao, Botkin and Johnson17), C channels(Reference Deleo, Wade, Feraboli and Rassaian18), corrugated composite plates(Reference Feraboli, Wade, Deleo, Rassaian, Higgins and Byar4) and fuselage section(Reference Zou, Mou and Feng3,Reference Feng, Mou, Zou and Ren6,Reference Ilcewicz and Brian19-Reference Mou, Zou, Feng and Xie24) . Carruthers et al suggested that the closed-section tubes had evident effects on the crush performance. In particular, the stacking sequence can significantly affect the crush behaviour because the hoop fibres constrain the axial fibres and prevent them from splaying, thereby suppressing the propagation of the crush front(Reference Carruthers, Kettle and Robinson35). Riccio et al. proposed a user-defined 3D damage model (VUMAT) with solid elements implemented into the finite element code Abaqus/Explicit, and they also supplied a numerical analysis on an omega-stiffened laminate panel under low-velocity impacts(Reference Riccio, Saputo and Sellitto32,Reference Riccio, Saputo, Sellitto, Raimondo and Ricchiuto33) . Pietropaoli and Riccio benefited from an existing procedure based on the combined use of the Virtual Crack Closure Technique and the fail release approach for the analysis of delamination growth phenomena in composite structures(Reference Pietropaoli and Riccio34).
The aerospace community has focused mostly on test specimens that resemble subfloor structures, such as floor beams, stanchions, and stiffeners. The test element geometries are open section, such as semicircular segments(Reference Jeryan40), C-channels(Reference Deleo, Wade, Feraboli and Rassaian18,Reference Nailadi41) , and the DLR omega specimen(Reference Jackson, Dutton, Gunnion and Kelly42). Feraboli et al. conducted the experiments, simulation and optimisation design studies of cargo sub-floor composite C channels based on the “building block” approach of FAA AC 20–107B, the failure process and failure modes of composite C channels can be more accurately simulated by the developed finite element models, the tests and simulation of details, sub-components and components would be further carried out in order to study the crashworthy performance of composite fuselage section in detail(Reference Feraboli25). Corrugated web geometries have a history of being employed as energy absorbers in the subfloors of aircraft to improve crashworthiness in both rotorcraft(Reference Johnson and Kohlgruber36,Reference Mc Carthy and Wiggenraad37) and large commercial transport aircraft(Reference Vicente, Beltrán and Martínez38). Corrugation increases the stability of vertical web, thereby increasing its crippling strength, and enables floor beams to carry higher design loads. The corrugated geometry promotes stable crushing and significant energy absorption during the crash events by reducing the likelihood of macroscopic buckling(Reference Hanagud, Craig, Sriram and Zhou39). Ren et al. conducted numerical investigations to evaluate the influence of stacking sequence, progressive damage model, trigger geometry on energy absorption characteristics of fabric and unidirectional composite sinusoidal plates(Reference Ren, Jiang, Ji, Zhang, Xiang and Yuan44,Reference Jiang, Ren, Gao and Xiang45) . With the increasing use of composite material structures in aircraft fuselage section, there is a need to further conduct the crashworthiness tests and simulation of composite aircraft structures.
This paper aims to build the progress-crushing finite-element model of the composite sinusoidal corrugated and analysis the model with parameters. This paper mainly focuses on the crashworthiness indicator-specific energy absorption. Section 3 mainly details the quasi-static crushing test of the composite sinusoidal corrugated. The single-layer finite element model of composite sinusoidal specimen was developed in HyperMesh, and the correctness of MAT 54 composite material model and finite element model of composite sinusoidal specimens were verified based on the nonlinear finite element code LS-DYNA. In the section 4, finite element model of the composite sinusoidal corrugated is build. The last two sections carry out the parametric analyses. At first, the sensitivity analysis of MAT 54 material model parameters is conducted, and the nonlinear mapping relationships between the Special Energy Absorption and material model parameters are obtained by using the orthogonal design methods. At last, the material parameter selection scheme was optimised based on the constructed corresponding response surfaces.
2.0 CRASHWORTHINESS EVALUATION INDICATORS
For thin-walled energy-absorbing structures, the typical load-displacement curve during the crushing process is shown in Fig. 1. The crashworthiness evaluation indicators are defined to evaluate the crashworthiness of energy-absorbing structures, such as energy absorption (EA), specific energy absorption (SEA), peak crush force (F max), and mean crush force (F mean)(Reference Fauzan, Shahrum, Ahmad and Zulkifli43).
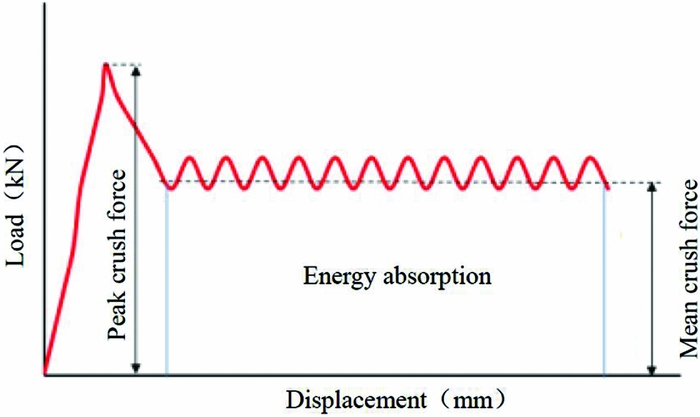
Figure 1. Typical load-displacement curve.
Specific Energy Absorption (SEA): The absorbed energy (EA) per unit mass (m) of crushed structure. The ability of material to dissipate energy can be expressed in terms of SEA, which has units of J/g, and the higher value indicates the greater energy absorption efficiency of a material. The equation for SEA is:
 $$\begin{equation}
{\textit SEA} = \frac{{{E_A}}}{m} = \frac{{\int {Fdl} }}{m} = \frac{{\int {Fdl} }}{{\rho \cdot A \cdot l}},
\end{equation}$$
$$\begin{equation}
{\textit SEA} = \frac{{{E_A}}}{m} = \frac{{\int {Fdl} }}{m} = \frac{{\int {Fdl} }}{{\rho \cdot A \cdot l}},
\end{equation}$$
where F is the crushing force with the function of the displacement l, ρ is the density, and A is the cross-sectional area.
Peak Crushing Force (F max) is the threshold value of structural crushing damage to evaluate the difficulty level of the energy absorption of the structure under forcing, which is the initial peak value of the load-displacement curve.
Mean Crushing Force (F mean) is the average force of the whole crushing process, as given by Equation (2):
 $$\begin{equation}
{F_{{\rm{mean}}}} = \frac{{\int {F{\rm{d}}s} }}{S},
\end{equation}$$
$$\begin{equation}
{F_{{\rm{mean}}}} = \frac{{\int {F{\rm{d}}s} }}{S},
\end{equation}$$
where F is the crushing force, s is the vertical crushing displacement, and S is the total crushing displacement of the whole crushing process.
3.0 QUASI-STATIC CRUSHING TEST
The detailed dimensions of composite sinusoidal specimen are shown in Fig. 2(a), the length of composite sinusoidal specimen is 76.2 mm, the width is 50.80 mm, and the thickness is 2 mm. The isometric view of composite sinusoidal specimen is shown in Fig. 2(b).

Figure 2. Composite sinusoidal specimen geometries and dimensions (all dimensions in mm).
The preparation and tests of composite coupons and composite sinusoidal specimens were conducted in AVIC Beijing Institute of Aeronautical Materials at Beijing, China. The composite sinusoidal specimens are manufactured by press-molding through the steel matching tool, shown in Fig. 3(a). The material system is T700/3234, it is a unidirectional tape 12k tow, and a 270 ℉ (132 °C) cure resin designated for autoclave or oven-only cure. The preparation of composite corrugated plate has experienced the process of paving, curing and mold releasing. The composite sinusoidal specimen is shown in Fig. 3(b). In order to initiate the steady crushing progress, the 45-degree chamfer sided weakness is set up at the top of composite sinusoidal specimen. The composite sinusoidal specimen consists of 16 layers of unidirectional laminates with orientations (0°/90°)4s, and each layer thickness is 0.125 mm.

Figure 3. Steel tool and composite sinusoidal specimen.
The uniform crushing rate is 2.5 mm/min, and the typical morphology of composite sinusoidal specimen after crush testing is shown in Fig. 4(a). The interlaminar cracks formed and grew at the interface of adjacent layers, and the intralaminar cracks form and grow within individual layers. We can see the intralaminar cracks, 0° layers and 90° layers, the lamina bundles exhibit significant bending deformation, but do not fracture. The failure mode of composite sinusoidal specimen is lamina bending failure mode, and the lamina bending failure mode is characterised by very long interlaminar cracks, intralaminar cracks, and lamina bundles, as shown in Fig. 4(b) and Fig. 4(c)(Reference Farley and Jones26).

Figure 4. Crushing characteristics of lamina bending crushing mode of composite sinusoidal specimen.
The synchronous data acquisition system of Instron electronic universal testing machine records the crushing load and displacement data during the crushing process. The quasi-static crushing load-displacement curve is shown in Fig. 5. The OA stage is an approximately linear variation before collapse, and the load is increased to the initial peak crush force (Point A). The collapse then occurs at the top of specimen, and results in a reduction of crushing load (AB stage). The progressive crushing process occurs and the crushing load remained at a relatively stable level (BC stage). The total energy absorption is represented by the area below the curve OABC. The calculating SEA value is 72.47 J/g for the composite sinusoidal specimen based on the Equation (1)(Reference Mou, Zou, Feng and Xie24).

Figure 5. Quasi-static crushing load-displacement curve.
4.0 FINITE ELEMENT MODEL AND MATERIAL MODEL
4.1 Finite element model
As shown in Fig. 6, the LS-DYNA model includes the composite sinusoidal specimen, the trigger row, and the rigid ground. The shell element is commonly used in crashworthiness simulation of aircraft fuselage section, and the fully integrated shell element (formulation 16) is adopted for the finite element model of composite sinusoidal specimen, because it can calculate internal energy absorption accurately, simulate bucking accurately, and calculate very fast(Reference Feraboli, Wade, Deleo, Rassaian, Higgins and Byar4,Reference Mou, Zou, Feng and Xie24,27) . Based on the mesh sensitivity analysis of shell elements, the finite element model of composite sinusoidal specimen is modelled with a total of 840 shell elements of 2.54 mm × 2.54 mm(Reference Bonnie and Paolo46), having constant thickness of 2 mm. The 45-degree chamfer is modelled as a single row of reduced-thickness 0.25-mm elements at the crush front of the specimen.

Figure 6. Finite element model of composite sinusoidal specimen and trigger row.
The card * PART_COMPOSITE is used to define the 16 layers of composite sinusoidal specimen, and the finite element model is adopted the material model of MAT 54_Enhanced_Composite_Damage, which used the Chang-Chang failure criterion in the LS-DYNA theoretical manual(27,Reference Han, Taheri, Pegg and Lu28) . The material stress-strain curves in the elastic region follows the linear elastic theory. The composite materials can successfully be modelled by MAT54 which has been approved based on the single-element simulations(Reference Bonnie, Paolo, Morgan and Mostafa29). The material card of MAT 54 contains input parameters for both material physical properties of T700/3234 (Table 1) and other code-specific parameters (Table 2)(Reference Feraboli, Wade, Deleo, Rassaian, Higgins and Byar4,27) . The material model of MAT 20_Rigid is selected for rigid ground, and the input parameters of material card of MAT 20 are shown in Table 3(Reference Mou, Zou, Feng and Xie24,27) .
Table 1 Material properties of T700/3234

Table 2 Strain-limits and failure parameters of MAT 54

Table 3 Material parameters of rigid ground

4.2. Boundary conditions and contact definitions
For the finite element model of composite sinusoidal specimen, a fixed boundary condition was assigned to the bottom nodes along the flat end of all finite element models, and the top nodes were completely free. All degrees of freedom of the rigid wall are constrained except plane normal, so that it can only move along the height of the corrugated plate. In order to reduce the computation time, speed scaling is carried out in this example, the constant pressure velocity of the rigid wall is applied to 3800mm/s, and the total displacement is about 40 mm. Because the strain rate effect is not considered in the material-model parameter setting, and the speed scaling has little effect on the simulation results after several tests, the setting of the loading speed is reasonable(Reference Mou, Zou, Feng and Xie24).
The contact definition between the rigid ground and the composite sinusoidal specimen is necessary for the two parts to properly interact, and the Rigid_Nodes_to_Rigid_Body Contact algorithm is just selected, the static friction factor and dynamic friction factor are 0.3, respectively. For the contact algorithm. This is accomplished by allowing the nodes of the composite sinusoidal specimen to penetrate into the platen by a specified distance. As the nodes penetrate, they are resisted by the forces calculated based on a user-specified load-penetration curve. In this contact definition, the initial load-penetration curve defines the reaction normal force, such a –load-penetration curve is necessary in the contact definition when using the MAT 54 material model. Varying the –load-penetration curve has an important effect on the stability of the model, yet there is no way of knowing a priori of deterring experimentally the correct shape. The initial load-penetration curve was estimated from the compressive failure load and cross-sectional area of the element. It was subsequently fine-tuned to ensure that at least two rows of elements penetrated the platen prior to any element deletion(Reference Deepak30,Reference Bonnie and Paolo46) . Figure 7 shows the selected load-penetration curve.
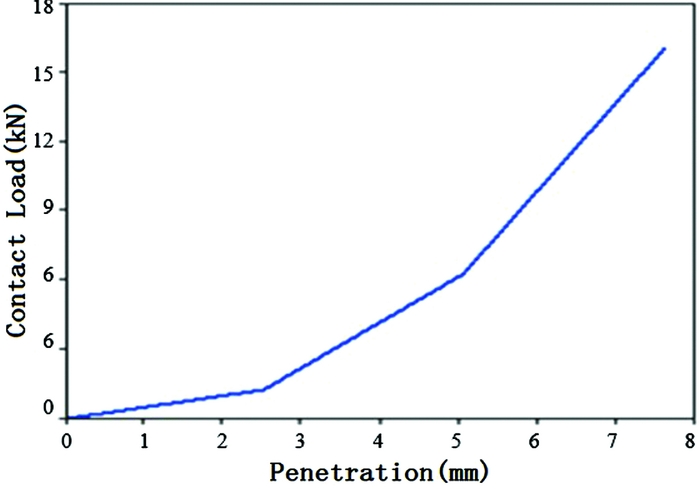
Figure 7. –Load-penetration displacement curves used in contact definition.
5.0 FINITE ELEMENT MODEL SIMULATION
The simulation failure modes of composite sinusoidal specimen, as shown in Fig. 8, reveal that failure advances in an even and stable mode, through elements deletion at the crush front. When the first ply in an element fails, the elements remain in the straight position and do not exhibit a different morphology. Once all plies fail, the elements are immediately deleted. Once an element is deleted, the entire row of elements is also deleted. Therefore, the crush progresses with a progressive deletion of the crush front row of elements are achieved without any other graphic indication.

Figure 8. Time progression of the baseline simulation showing stable element row deletion.
The simulation load-displacement curves are shown in Fig. 9 in its raw and filtered state. The raw curve is characterised by an alternating series of sharp peaks and valleys, giving it a saw tooth appearance. A low-pass digital filter was used to filter numeric results. When the simulation curve is filtered by SAE 600 Hz, the mean crush force remains unchanged, but the peaks and valleys are smoothed. The curve oscillates about the mean crush force without large variations in local peak values, indicating that the simulation is stable. While the simulation curve is filtered by SAE 300 Hz, the mean crush force also remains unchanged, but there are no peaks and valleys. All of the simulation curves are filtered by SAE 600 Hz(Reference Xiao16,Reference Xiao, Botkin and Johnson17,Reference Johnson and David31) .
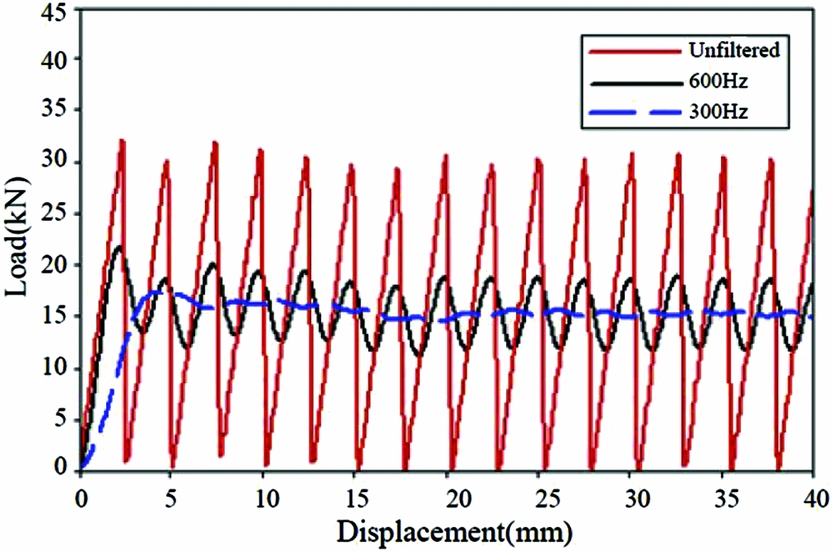
Figure 9. Load-displacement curve under different SAE filter frequency.
The filtered simulation load-displacement curve is compared with the experimental curve in Fig. 10. The simulation captures the key characteristics of experimental curve: peak crush force, mean crush force, and SEA value. The simulated mean crush force F mean value is 17.15 kN, compared to the experimental 18.11 kN, the difference is –5.3%; The simulated SEA value is 69.98 J/g, compared to the experimental 72.47 J/g, the difference is –3.44% which is within a little and acceptable range. The material model MAT 54 of composite sinusoidal specimen can captures all the experimental significant features, and the simulation SEA value is highly agreed with the experimental value, which can validate the correctness of finite element model, so the material model MAT 54 can also be used to successfully simulate the behaviour of composite sinusoidal specimens undergoing axial crushing.
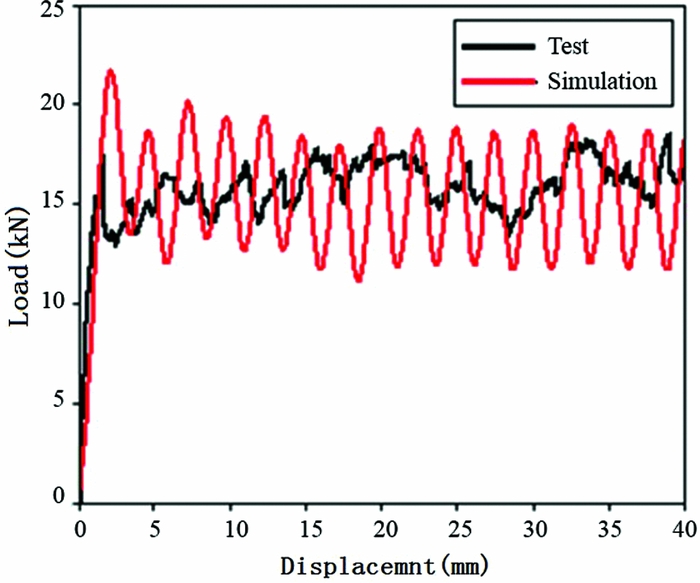
Figure 10. Experimental and model baseline load-displacement curves.
6.0 SENSITIVITY ANALYSIS OF MATERIAL MODEL PARAMETERS
An effective model needs to be sufficiently robust to tolerate small variations in material property input data of MAT 54 material model, to accommodate small errors in measured strength and stiffness. Yet, some non-physical model calculation parameters set of MAT 54 material model will have a greater impact on the results(Reference Feraboli, Wade, Deleo, Rassaian, Higgins and Byar4,Reference Deepak30) . However, LS-DYNA User's Manual is not described in detail for influence mechanism of parameters on simulation results during progressively crushing failure(27). The sensitivity of the model to variations in MAT 54 material model parameters, i.e. XC, DFAILC, SOFT, should be discussed. The control variable method was used to study the effects of XC, DFAILC, and SOFT parameters on the simulation results based on the above verified finite element model of composite sinusoidal specimens.
The XC is the material properties, and can be measured by the material performance test, but there is a large dispersion for the test XC results. The sensitivity analysis of this parameter has become very important for the simulation results. The load-displacement curves with different XC values were show in Fig. 11, the varying XC has a great effect on the resulting load-displacement curve. Small decreases in XC values (500 MPa, 700 MPa) significantly lower the mean crush force, while small increments of XC value (1250 MPa) significantly raise the mean crush force, at least until a stability threshold is reached and the model becomes unstable, with the irregular element elimination of failure mode. This is true within an envelope of stable values, beyond which the model became unstable.
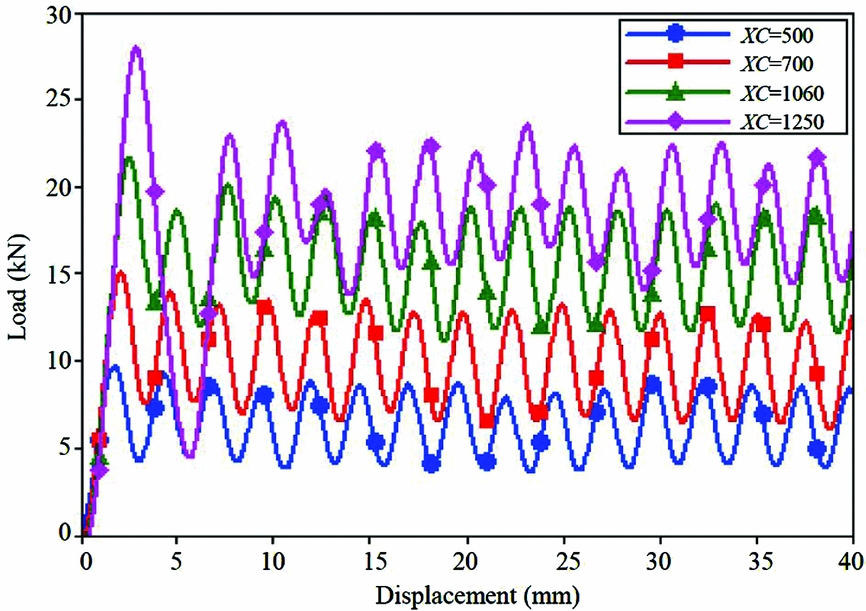
Figure 11. Simulation load-displacement curves with different XC values.
The simulation load-displacement curve under different DFAILC values were shown in Fig. 12, the changing of DFAILC can change the average crushing load. Reducing DFAILC (making it more negative) increases the mean crush force, while increasing DFAILC (making it less negative) decreases the average load value. Based on these results, the compressive strain-to-failure in the fibre direction, DFAILC, has a more profound effect on the results of the simulation, and it is a primary failure mode for the given specimen geometry-material combination, and therefore a critical parameter for achieving successful simulation results.

Figure 12. Simulation load-displacement curves with different DFAILC values.
The SOFT is a non-physical parameter, which is different from the material performance parameter and cannot be measured experimentally or by theoretical calculation. It can be used to reduce the strength of the front of a row of crushing element in order to avoid the global buckling failure. The sensitivity of the model to variations in the SOFT parameter is investigated within the admissible range (0, 1), as shown in Fig. 13. It is capable of dictating whether the simulation is stable or unstable, and increasing the SOFT value has the effect of increasing the mean crush force and SEA of the simulation. Increasing the SOFT value has the effect of increasing the mean crush force and SEA of the simulation. Lowering the SOFT parameter has the effect of lowering the mean crush force and SEA value of the simulation. Determining the correct value of the SOFT parameter is a challenging task, but it can be found by trial and error until the load-displacement curve of the simulation matches the experimental result. Unless the right SOFT value is found and utilised, it is impossible to obtain a successful simulation.

Figure 13. Simulation load displacement curves with different SOFT values.
7.0 ORTHOGONAL EXPERIMENTS OPTIMISATION ANALYSIS
Based on the above analysis, there are three parameters i.e., XC, DFAILC, SOFT, which have significant effects on energy-absorbing results of composite sinusoidal specimens, and presents a certain regularity. In order to study the influence of the three parameters on simulation results in depth and decrease the number of trials and errors, the response surface method (RSM) was adopted to construct the mapping relationships among the SEA, XC, DFAILC and SOFT and the simulation results were closed to the experimental values through the quadratic polynomial fitting and objective optimisation.
The ‘Trial-Assessment-Correction’ method is used to determine an approximate interval value of three parameters i.e., the design scope of variables, under the condition of simulation model stability calculation:
 $$\begin{equation*}
\begin{array}{@{}*{1}{l}@{}} {1000{\rm{MPa}} \le XC \le 1100{\rm{MPa}}}\\ {0.65 \le SOFT \le 0.75\quad \quad \quad \quad \quad \quad \quad \quad {\rm{The}}\;{\rm{optimal}}\;{\rm{object}}:SEA \to 72.47}\\ { - 0.0150 \le DFAILC \le - 0.0300} \end{array}
\end{equation*}$$
$$\begin{equation*}
\begin{array}{@{}*{1}{l}@{}} {1000{\rm{MPa}} \le XC \le 1100{\rm{MPa}}}\\ {0.65 \le SOFT \le 0.75\quad \quad \quad \quad \quad \quad \quad \quad {\rm{The}}\;{\rm{optimal}}\;{\rm{object}}:SEA \to 72.47}\\ { - 0.0150 \le DFAILC \le - 0.0300} \end{array}
\end{equation*}$$
The orthogonal test is designed based on the numbers of design variables and the design scopes, and the 15 sets of calculation are carried out in the whole orthogonal experiment, which set up 3 centre repeat points. Through the simulation calculations of composite sinusoidal specimens under quasi-static crushing, the corresponding SEA value and the relative difference compared with the test result are shown in Table 4.
Table 4 The orthogonal simulation table of composite sinusoidal specimens

Based on the orthogonal simulation results, the nonlinear mapping relationships between the SEA and XC, SOFT and DFAILC parameters are obtained by using the least square method. The quadratic response surface function is obtained by setting XC for X1, SOFT for X2, and DFAILC for X3:
 $$\begin{equation*}
\begin{array}{@{}l@{}} SEA = - 263.35125 + 0.13713{X_1} + 386.275{X_2} - 2869{X_3} - 0.09{X_1}{X_2} - 1.00667 {X_1}{X_3}\\ - 1353.33333{X_2}{X_3} - 9.0 \times {10^{ - 6}}{X_1}^2 - 147{X_2}^2 - 77333.33333{X_3}^2 \end{array}
\end{equation*}$$
$$\begin{equation*}
\begin{array}{@{}l@{}} SEA = - 263.35125 + 0.13713{X_1} + 386.275{X_2} - 2869{X_3} - 0.09{X_1}{X_2} - 1.00667 {X_1}{X_3}\\ - 1353.33333{X_2}{X_3} - 9.0 \times {10^{ - 6}}{X_1}^2 - 147{X_2}^2 - 77333.33333{X_3}^2 \end{array}
\end{equation*}$$
The fitting coefficients of the quadratic model are shown in Table 5, and the response surfaces among the SEA, XC, SOFT and DFAILC, are constructed, as shown in Fig. 14. The coefficient of variance analysis R 2 is 0.9995, but the adjusted coefficient of variance analysis R 2adj is 0.9986, which shows that the goodness of fit is higher. The residual of the fitting is 0.6665.
Table 5 Fitting coefficient of quadratic model

According to the optimisation objectives, the setting of parameters is optimised based on the response surface data. Considering that XC is a material performance parameter, and XC = 1060 MPa is used as the final optimisation results. The final optimisation results and the simulation results based on the optimal design variables are presented in Table 6. The calculated SEA value is 72.4699 J/g based on the response surface model, which is very close to the experimental SEA value of 72.47 J/g, and compared to the simulated SEA value 73.6418 J/g, the difference is only 1.62%, which indicates the accuracy of the parameters optimisation based on the response surface model, and also shows that it is feasibility to help to select the simulation parameters by using the response surface method.
Table 6 Comparison of parameters optimisation design and simulation


Figure 14. Quadratic response surfaces of SEA and different material model parameters (XC, SOFT, DFAILC)
8.0 CONCLUSION
Based on the failure mode and test results of composite sinusoidal specimens under quasi-static crushing, the finite element model of composite sinusoidal specimen is developed, which can accurately simulate the load-displacement curve and the SEA value, but the finite element model cannot provide insight into the failure morphology.
The paper aims to build the progress-crushing finite element model of the composite sinusoidal corrugated and carry out the parametric analysis. A numerical simulation has been performed by using the finite element model code LS-DYNA. Through a sensitivity study of different parameters of MAT 54 material model, it is shown that XC and DFAILC are the primary material parameters leading to element failure and deletion. SOFT is the single most influential parameter, and can be calibrated by trial-and-error to achieve the success of the simulation. The nonlinear mapping relationships between the SEA and parameters (XC, DFAILC, SOFT) was obtained based on the orthogonal design and response surface method. The results showed that the response surface model has a higher the goodness of fit, and the optimisation method can effectively assist the finite element modelling, and greatly the numbers of trial and error.
UNCITED REFERENCES:
ACKNOWLEDGEMENTS
The authors acknowledge the supports from Science and Technology Item from Civil Aviation Administration of China (MHRD20140207), Fundamental Research Funds for the Central Universities (3122016C011, 2017QD10S), and Fund of Tianjin Key Laboratory of Civil Aircraft Airworthiness and Maintenance in Civil Aviation University of China.


