NOTATION
- ABSU
Autopilot system of TU-154M
- ATM QAR
flight parameter data quick access recorder of ATM company
- CC
Commander in Chief
- CVR
Cockpit Voice Recorder
- FMS
Flight Management System
- FO
First Officer (co-pilot)
- ICAO
International Civil Aviation Organization
- ISA
International Standard Atmosphere
- MSL
Mean Sea Level
- NDB
Non-directional Beacon
- TAWS
Terrain Awareness Warning System
- p
pressure in hectoPascals (hPa) or millimetres Hg (mmHg) (1 hPa = 100 Pa = 3/4 mmHg)
- T
temperature in Kelvin degrees
- v
speed in meters per second (ms−1) or knots (kts) (1 kts = 1 nm/h = 1,852 km/h = 0.514(4) ms−1)
- h
altitude above mean sea level (1 foot = 0.3048 m)
1.0 BACKGROUND INFORMATION
One may get the impression that the amount of navigation-control systems of contemporary aircraft has reached a rational limit, and simply starts to exceed it, cf. e.g. Ref. (10). Hence, efforts should be undertaken to curb their numbers by optimizing the functionality of the systems which have already entered into pilotage practice. One of the systems which must now be installed in passenger aircraft is the Terrain Awareness Warning System, cf. Ref. (11). The present work analyses how the data registered by TAWS systems could be used as auxiliary/validation information for data registered by other aircraft systems, such as operational or catastrophic recorders in the event of a serious air accident when there is a need to examine its causes and reconstruct the series of events.
The case study uses the data from the TAWS system of Universal Avionics Company that originated from the catastrophic flight of the TU-154M aircraft travelling from Warsaw airport (WAW), Poland to Smolensk North airfield (XUBS), Russian Federation, on 10 April 2010. During the last minute of flight, five TAWS alerts (TAWS No 34–38) and one Flight Management System (FMS) warning (FMS Stop) were registered, this last one notifying of an undergoing FMS system power-down and memory dump. The flight ended in the total destruction of the TU-154M aircraft and the death of all people on board near Smolensk North airfield.
In the case of this particular flight, it was not possible to recover flight parameter data from the catastrophic recorders that would have been of sufficient quality to be submitted for analysis. One service recorder (K3-63) of the TU-154M No101 aircraft was not found at all at the wreckage site while recordings of the catastrophic recorder (MŁP-14-5) appeared to be useless for analysis because of many errors.
The regular data regarding technical flight parameters, which were in time and amenable to analysis, were recovered from the digital memory of the quick access recorder (QAR) of the Polish Company ATM. They were registered digitally every 0.5 s (some of them 0.125 s). It was possible to recover continuous, synchronised, analog sound recordings of Cockpit Voice Recorder (CVR) including the last minute of the flight. The audio data of the CVR recorder turned out to be in reasonably good technical condition and it was possible to submit it for analysis, which was done after converting the analog sound signal into digital form, cf. also Ref. (4). The data that were recorded in the logs of TAWS38 and FMS Stop alerts are the only available data on the flight parameters, after the last credible data were recorded at about 6:40:59.5 UTC time on the ATM QAR recorder, cf. Refs (4) and (5).
Section 2 describes the procedure and examines the consistency of aircraft's height of flight data from Baro and Radio altimeters on the basis of entries registered in the logs of TAWS system alerts and FMS warning. The consistency of data regarding the geographical locations of the aircraft are also examined and compared with the corresponding data regarding the ground speed of the aircraft.
Section 3 presents the results of an integrated analysis of the data from the ATM QAR service recorder supplemented with the data from the TAWS/FMS logs and those from the cockpit voice recorder CVR. This was followed by the reconstruction of the vertical and horizontal trajectory of the TU-154M aircraft during the last minute of flight within an estimated accuracy of several meters. Mutual correlations between several key events of this phase of the flight were identified and indicated.
Finally, several propositions are formulated for potential changes/enhancements to the TAWS system. Their implementation could enhance the functionality of this system, ranging from generating warning messages to enabling effective examination of post-accident situations. Several conclusions are formulated concerning the catastrophic flight of TU-154M on 10 April 2010.
The work is supplemented with an Appendix, offering derived mathematically precise corrective formulas for Q code readings of Baro-altitudes based on the underlying physical laws. They allow for determining the most precise flight altitude values when local atmospheric pressure and temperature conditions of the airport are taken into account.
2.0 DATA FROM TAWS SYSTEM ALERT LOGS USEFUL IN EXAMINING THE AIRCRAFT'S COURSE OF FLIGHT
The basic function of the TAWS system is collecting and processing data on flight parameters of an aircraft in order to generate alerts to prevent catastrophic air accidents. A succinct but at the same time very illustrative elucidation of TAWS system operation, its underlying principles and capabilities is provided by Tooley and Wyatt in Ref. (Reference Tooley and Wyatt12, chapter 17). An interesting possibility is to use the data collected and recorded via TAWS warning alerts to examine the course and causes of an air accident, should one occur despite the warnings. Such a possibility is shown in the example of analysed data from the TAWS/FMS alerts logs from the TU-154M aircraft, which crashed in Smolensk, Russian Federation, on 10 April 2010. A lot of information was recorded in the alert logs regarding the various flight parameters of the aircraft's main subsystems and the operation of its accessories, in particular about time, geographical location, flight altitude and aircraft speed. These data, when skillfully used, can be useful for a purpose other than generating of alerts, namely to establish what happened and determine the course of events during the catastrophic flight of the TU-154M aircraft. They offer reliable information independently of the other aircraft recorders, which can serve the dual purpose of reconstructing/verifying the aircraft's vertical and horizontal flight trajectory, and of determining which subsystems and devices worked properly and which ones failed, and when they did. The data from TAWS/FMS systems deliver information about the flight which is irregular in time and because of that it cannot serve as a basis for flight trajectory reconstruction; it can however be used as an auxiliary and/or validation tool. The remaining part of the work offers a consolidated analysis of the data, registered by ATM QAR, CVR recorders and those from the TAWS 34–38 and FMS Stop alerts, in order to examine the course of events and to reconstruct the vertical and horizontal trajectory of the TU-154M aircraft during the last minute of the flight on 10 April 2010.
2.1 Selected data from records of alert logs No 34–38 of the TAWS system and FMS stop alert
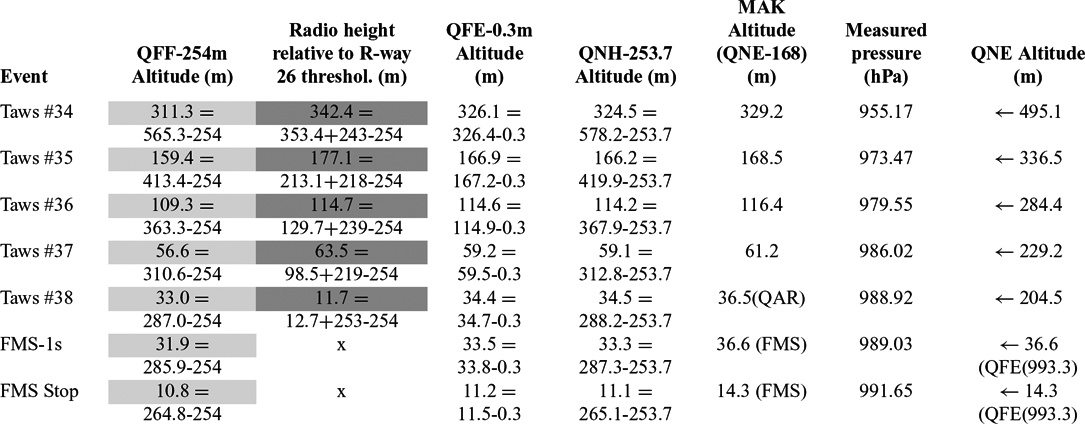
All discussed numerical data concerning TAWS alerts No 34–38 and warning “FMS Stop” originate from Sections 4.9.4 and 4.9.5, of Annex 4 to KBWLLP Report, cf. Ref. (5). Figure 1 presents excerpts from original logs of warning alerts TAWS No 38 and FMS Stop, showing values of flight parameters recorded at their occurrence.
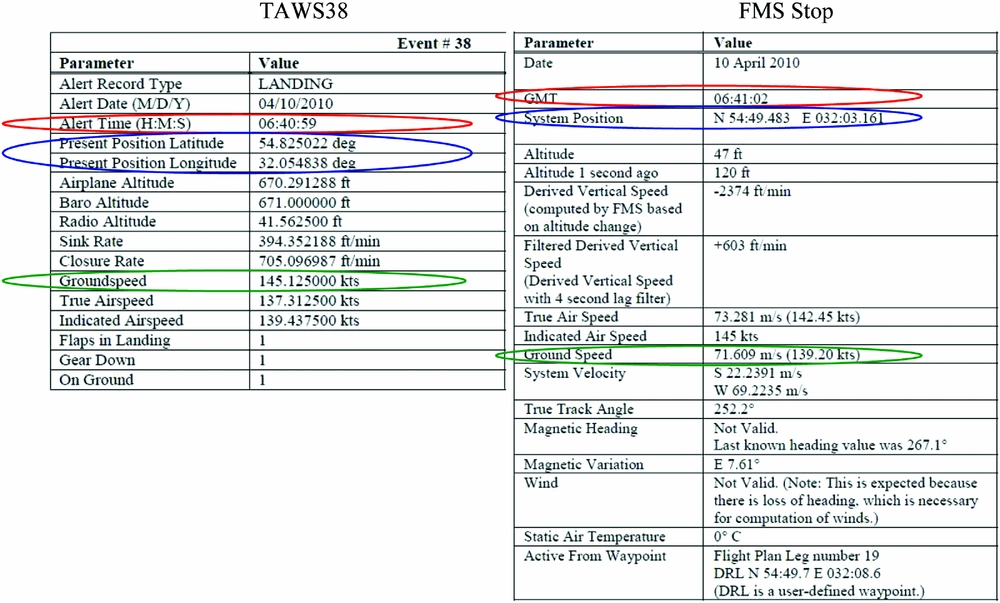
Figure 1. Excerpts from the original records of decoded data from logs of TAWS38 alert and FMS warning, cf. Ref. (5), showing among other facts the time at which the warning took place, the geographical location of the aircraft, its barometric and radio height, the aircraft's ground speed and its ascent/descent speed.
In Table 1, data from logs of TAWS No 34–38 and FMS Stop warnings are collected together and set in the chronological order to deliver information on the possible course of the vertical and horizontal trajectory of the aircraft during the last minute before its destruction. The data on the flight parameters registered in TAWS logs originated from WBE-SWS system of the aircraft cf. e.g. Section 7.4 in Annex 4 of the KBWLLP report(5). System WBE-SWS enables not only the measurement of Baro -altitude but also to determine other important flight parameters: for example, air speed and ground speed, and vertical speed. It can deliver information useful for the crew in a convenient graphical form and generates auxiliary pieces of information such as: altitude data visualisation in meters or feet, issues warning signals upon crossing preset flight altitude, allows manual presetting of barometric reference pressure and visualisation of the preset value and also indicates that ISA reference pressure of 1013.25 (hPa) has been preset. Baro-altitude information can be provided in different Q codes – QNE, QNH, QFE, cf. Appendix.
Table 1 Data from the TAWS/FMS logs recorded during the last minute of the flight of the TU-154M aircraft on 10 April 2010 together with some auxiliary information from ATM QAR service recorder and cockpit voice recorder (CVR)
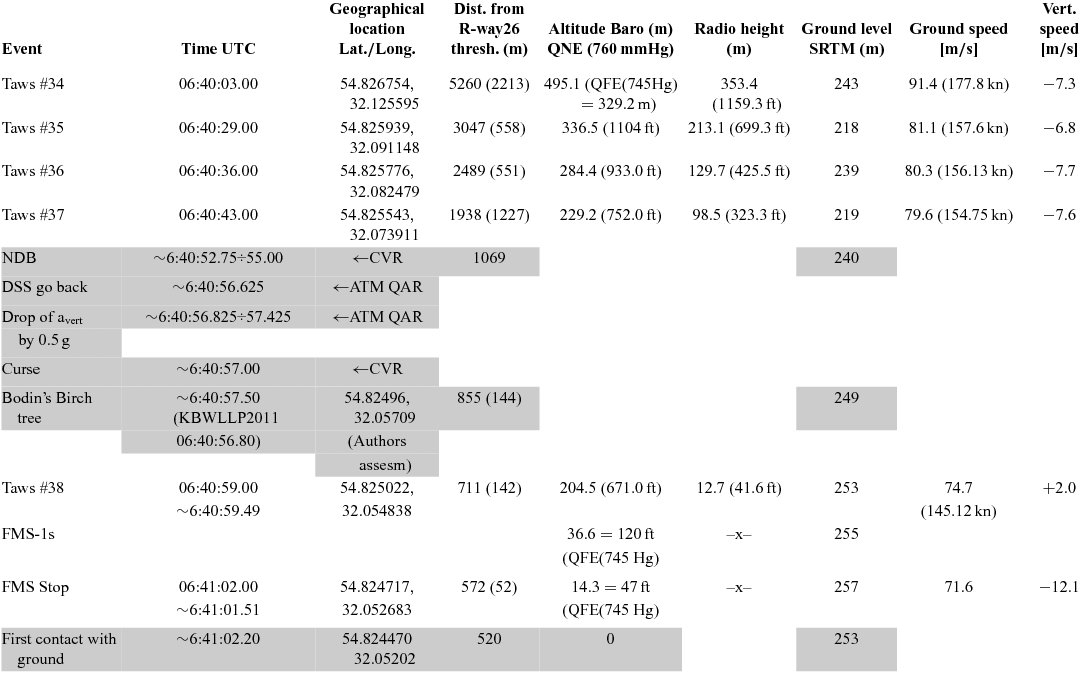
Supplementary information on data contained in Table 1.
i) Barometric altitudes recorded in TAWS logs originated from altimeter of the Commander-in-Chief. According to the data from ATM QAR service recorder, at about 6:28:41 UTC, the reference pressure on Commander-in-Chief altimeter was changed from 1013.25 to 993.33 hPa (760 to 745 mmHg), when the aircraft was at an altitude of 2,176 m – about 700 m above transition altitude for XUBS. The reference pressure on the commander altimeter was changed back to standard pressure 760 mmHg at 6:40:08.5 UTC when the aircraft was about 300 m above and 4,770 m short of Runway 26 threshold (on 365 m Radio height), i.e. between alerts TAWS34 and TAWS35. Thus, during TAWS34 alert reference pressure was 745 mmHg and 760 mmHg during TAWS 35–38 alerts. Baro altitude QNE for TAWS34 event (5th column) was recalculated, from the value of QFE (p ref = 745 mmHg) = 329.2 m using formulas (A8) in Appendix, cf. also p. 212 and p. 214 in KBWLLP report(4). Baro-altitude registered in FMS (FMS-1 s) alert originates from altimeter of co-pilot, where it was preset at reference pressure of QFE (p ref = 745 mmHg).
ii) Distances from Runway 26 threshold (column 3) were determined with the aid of Google Earth software, as vertical projection on the extension of the central axis of Runway 26; estimated accuracy is about ±1 m. The numbers in brackets denote distance between physical locations of two neighbouring events, e.g. 2213 m = 5260 m-3047 m.
iii) Ground elevations reported here were determined on the basis of Shuttle Radar Topography Model SRTM, cf.(8). Profiles of elevations along specific routes consistent with SRTM model were determined with the aid of Geocenter profiler software(Reference Pietruszka9). Estimated accuracy is about ±1 m.
iv) Label “NDB” denotes passing by a place located 1069 m short of Runway 26 threshold (on extension of the central axis of Runway 26 at a distance of 1069 m from its threshold non-directional radio beacon was located). The time period given in the second column is the time during which sound signals were registered in CVR informing pilots about passing near radio beacon (NDB).
v) Label “DSS move back” denotes the moment, when throttle levers of all three engines were starting to move back from the outermost position -“take off power” regime.
vi) Label “Drop avert” denotes the occurrence of sudden drop (jump) of vertical acceleration of the aircraft from the value of 1.38 g to the value of 0.88 g (by ~0.5 g) starting at the time 6:40:56.825, and lasting for a period of 0.6 s. After that the value of vertical acceleration again abruptly increased to the value of 1.28 g. Information on this event comes from ATM QAR service recorder.
vii) Label “K. mać” denotes a curse registered by CVR recorder. When it is considered together with the DSS retreat and drop of vertical acceleration slightly preceding it, the events suggest the occurrence of a serious emergency situation on the aircraft.
viii) Label “Birch” denotes a tree located at about 855 m short of Runway 26 and about 74 m to the left of the extension of the central axis of Runway 26. The geographical location of the “Birch” was assessed by the present authors to be (Lat. 54.82496, Long. 32.05709), cf. Table 1. According to the KBWLLP report, cf. p. 216(4), and MAK report(6) a collision with this tree – so called “Bodin's birch ” was found to be the primary technical cause of the TU-154M aircraft's destruction near Smolensk North airfield. According to the KBWLLP report the collision with the Bodin's birch took place at 6:40:56.8 UTC. The analysis performed in the present work indicates that the TU-154M aircraft was most probably at a distance of 855 m from Runway 26 (in the vicinity of Bodin's birch location) at 6:40:57.50. The subject matter justification for the above opinion is given in Section 3.
ix) The times of occurring TAWS38 and FMS Stop alerts given in the second column were estimated, as the most probable actual times of these alerts, on the basis of the analysis performed in the present work. The detailed justifications of these estimates are given in Section 2.1.2, cf. also Fig. 2.
x) Geographical coordinates of the place of the first contact of the aircraft with the ground is given after KBWLLP report, cf. p. 58 in Ref. (4).
xi) The Runway 26 threshold geographical coordinates are (54.825184, 32.043791, 254m) (Latitude, Longitude, Height above MSL).
Spatio-temporal pieces of information originating from other sources than TAWS/FMS recordings, e.g. the service recorder ATM QAR, or the cockpit voice recorder from the pilots cabin CVR featured in Table 1 are marked with dimmed background of the relevant cells. The times coordination of logs of different recording devices used in the present paper is as follows: ATM QAR time = UTC time + 2 h:2.5 s, CVR time = UTC time + 2 h:6 s. Events are given in chronological order on a common-time axis. Careful analysis of synthetic data collected in Table 1 is delivered in Section 3.
Formulation, elaboration and settlement of hypotheses concerning the course and causes of the catastrophe of the TU-154M aircraft require very precise spatio-temporal analyses of the occurring events. The required accuracy of determination of their taking place is of the order of single meters and fractions of a second. Due to that, an effort is undertaken here for particularly cautious data analysis registered in the TAWS warning alerts, which deliver point-wise in time but very important information on the horizontal and vertical trajectory of the aircraft flight.
2.1.1 Analysis of consistency of baro-altitudes and radio heights recorded in TAWS alert logs
As a rule, barometric altitudes are determined based solely on the measurement of actual pressure value outside the aircraft and possibly take into account pressure corrections ensuing from the value of local pressure on the airfield – these are e.g. QNE, QNH, QFE altitudes, cf. Fig. A2. This leads to errors resulting from not taking into account the difference between the value of local temperature and the temperature predicted by standard atmosphere model. Such practices are justified as the error connected with not taking into account local temperature correction decreases with the diminishing altitude of the aircraft with respect to the runway level. However, the analysis of the Smolensk catastrophe requires especially careful analysis in view of the required precision for aircraft barometric altitude determination imposed among others by the fact that just before the TAWS38 alert both radio altimeters of the aircraft failed. Due to that the estimates of the aircraft altitude above runway level, during and after the TAWS38 alert, have to necessarily be made on the basis of barometric measurements of altitudes. It should be pointed out that the methodologically correct comparison of Baro altitude and Radio height can be made only for Baro-altitude corrected by both local pressure and local temperature weather conditions. Knowledge of local meteorological conditions in the neighbourhood of Smolensk North airfield at the time of the catastrophe is necessary in order to be able to do that. These conditions were given in the note of meteorological service of Smolensk North airfield, cf. also pp. 191–192 in the KBWLLP report(4), and p. 48 in MAK report(6), as follows: at 10.00 o'clock Moscow time (MSK) QFE reference pressure – local pressure on the elevation of threshold of runway 26 was 744.6 mmHg, QNH reference pressure was 767.4 mmHg, air temperature +2°C, and at 11.00 o'clock MSK QFE reference pressure was 744.8 mmHg, QNH reference pressure was 767.6 mmHg, and air temperature was +1.8°C.
These data enable determination of the value of the elevation above mean sea level (MSL) of the runway 26 threshold – the one adopted by meteorological services of Smolensk North airfield to be factually correct. The value of this height specified in various documents concerning the accident in Smolensk differs by several meters (254-260 m). Given QFE(H bRny26) = 744.8 i QNH(H bRny26) = 767.6 mmHg and the reported temperature, it is easy to compute using formulas (A8), cf. Appendix that the elevation of runway 26 threshold adopted by meteorological services was H bRny26 = 253.7 m above MSL. This value is consistent with the value given by SRTM model equal to 254 m MSL. For the purposes of the present work, the elevation of runway 26 threshold of H Rny26 = 254 m MSL was adopted. The following constant in time, local meteorological conditions at Smolensk North airfield at the time of the catastrophe, is adopted for computation of the corrected values of the aircraft Baro-altitudes: p loc = 744.75 mmHg (993 hPa), T loc = 275°K (1.85°C), H bRny26 = 253.7 m; 10.45 MSK (6:45 UTC). The QNE altitudes of the aircraft – cf. column 5 in Table 1, were recalculated, taking into account various corrections using formulas specified in the Appendix. The overall listing of Q-code altitude values, taking into account various corrections, are presented together for easy comparison in Table 2.
Table 2 The comparison of flight altitudes of the TU-154M aircraft was determined on the basis of different physical grounds (Baro, Radio), taking into account different definitions and corrections based on local atmospheric conditions at the Smolensk North airfield at the time of the TU-154M accident (p loc = 744.75Hg, T loc = 1.85C, H bRny26 = 253.7 m MSL, 10.45 Moscow time = 6.45 UTC time)

Supplementary information on the data contained in Table 2.
i) Local meteorological conditions adopted for pressure corrections (QFE, QNH readings) and pressure-temperature corrections (QFF readings), cf. also Fig. A2, are the conditions, which were at the runway 26 threshold of Smolensk North airfield at 10.45 o'clock Moscow time – MSK (6:45 UTC), equal to: T = 275°K (1.85°C), p a = 744.75 mmHg (993 hPa) H bRny26 = 253.7 m. The elevation of runway 26 threshold (H bRny26) used by meteorological services of the Smolensk North airfield was here determined from the values QFE = 744.8 and QNH = 777.6 mmHg (11.00 o'clock MSK) delivered by these services. The Baro-altitude QNE (744.75 mmHg) = 169.94 m.
ii) The Baro-altitudes were reduced to the H bRny26 = 253.7 m MSL. In order to make the meaningful comparison of Baro and Radio height readings, the QFF altitudes given in Table 2 were reduced to the elevation of runway 26 threshold level adopted on the height of H Rny26 = 254 m MSL.
iii) Baro-altitudes of FMS and FMS-1 events alerts were successfully recovered from the memory of the FMS system of the co-pilot only, who had the reference pressure on his barometric altimeter preset at 745 mmHg.
The first column of Table 2 specifies the best estimates of the actual altitude of the aircraft flight determined on the basis of the measurement of static atmospheric pressure outside the aircraft fuselage (pT-corrected Baro altitude). The pT-corrected Baro-altitudes were related to the elevation of the runway 26 threshold, i.e. the elevation H Rny26 = 254 m MSL. When computing the values of pT-corrected Baro-altitudes, both local meteorological pressure and temperature conditions were taken into account by following the procedure described in the text accompanying formulas (A14), (A15) in the Appendix.
The second column of Table 2 specifies the Radio heights determined by measuring the time of flight of radio wave travel on the route aircraft→ground surface→aircraft. The Radio heights were related to the elevation of the runway 26 threshold. The pT-corrected Baro-altitudes and Radio heights related to the elevation of runway 26 methodologically should have the same values to an accuracy of their generic errors. Inspection of the corresponding values in the first and the second column in Table 2 shows divergence of several meters up to about 100 m above the ground and growing with height. This is consistent with the characteristics of Baro- and Radio-altimeters resulting from physical principles of their operation. It is justified to accept that pT-corrected Baro-altitudes correctly represent the actual situation, as atmospheric conditions at the Smolensk North airfield during the time of catastrophe were stable (only miniscule changes of local pressure and temperature took place), and in such situation the model of standard atmosphere performs very well. Obtaining the most precise possible assessment of barometric altitude is crucial in the present case because after the TAWS 38 alert, no correct measurements of Radio heights were recorded and the Baro altitudes are the only source of information on the height of flight of the aircraft.
General conclusions that can be drawn from the analysis of flight height registered in logs of the TAWS/FMS alerts are as follows:
- readings of Baro- and Radio-altimeters are mutually consistent, and divergences in height readings result from the natural accuracy of these devices originating from the physical principles of their operation. Measurement error of Baro-altitudes corrected with respect to local weather conditions can be estimated to amount to several meters in the range of heights up to several hundred meters (error mainly resulting from other temperature-height profile than assumed in the standard atmosphere model, and/or e.g. local wind corridors). The RW-5MD1 radio altimeters used in TU-154M aircraft allowed height measurement (above terrain level) in the range of 0-750 m. Nominal accuracy of measurement in the range of 0-10 m is ±0.6 m, and in the range of 10-750 m is 6% of the measured height value.
- it is justified to accept that Baro and Radio height readings registered in the TAWS alerts logs, except probably for the Radio-height reading of TAWS38, deliver reliable data for reconstruction/validation of the vertical trajectory of the TU-154M during the last minute of its catastrophic flight.
- it is justified to use post-accident analyses of pT-corrected Baro altitudes (QFF) for estimates of the flight height at the time later than TAWS 38 alert and trust that actual flight height did not diverge from these values by more than several meters.
- unfortunately, the error in assessment of the actual height of flight from TAWS baro altitude data even after pressure-temperature correction, i.e. with the aid of pT-corrected Baro-altitudes for heights remaining within the range of up to about 50 m above the ground can be estimated to still amount to several meters. This error strongly depends, among others, on the accuracy of the pressure sensor used in altimeter, for which the standard requirement is that the error of pressure measurement does not exceed 0.5 hPa – which taking into account that barometric degree amounts here 8.1 m/hPa, gives approximation error resulting only from accuracy of pressure sensor on the order of 4 m, cf. formula (A3) in the Appendix. Thus, it can be reasonably accepted that error for pT-corrected Baro-altitude in the range mentioned above with very high probability does not exceed 10 m.
2.1.2 Spatio-temporal consistency analysis of data on location of the TAWS alerts
Marking geographical coordinates of five TAWS (No. 34–38) alerts on a map shows that they all lie on one line. This indicates that the aircraft's flight path at a distance between these alerts was rectilinear, nearly parallel to the extension line of the central axis of runway 26. Only after TAWS38 did the TU-154M aircraft's flight path smoothly bends reaching the location of FMS Stop alert, which the aircraft reached in about 2 s. after TAWS38 alert, with the direction deviation from the direction of runway 26 of about 20°, cf. Fig. 2. The event of the FMS system power-down (FMS Stop alert) took place 572 m short of the runway 26 threshold, considering the extension of its central axis, and 85 m perpendicular to it on its left, looking from the direction of the approaching aircraft. The aircraft at the FMS Stop alert location was at the height of about 11 m above runway 26 threshold according to the value of pT-corrected Baro altitude. In FMS Stop alert log there is information that one second before the FMS Stop alert (FMS-1s event) the aircraft was on the pT-corrected Baro altitude of 31.9 meters above runway 26 threshold. This means that somewhere between TAWS 38 alert (H = 33 m, climb 2 m/s) and FMS-1 s instant (H = 31.9 m, descent) the aircraft reached its last apogee of flight height, after which it was only falling to the ground, FMS Stop (H = 10.8 m, descent 12.1 m/s), cf. Tables 1 and 2.
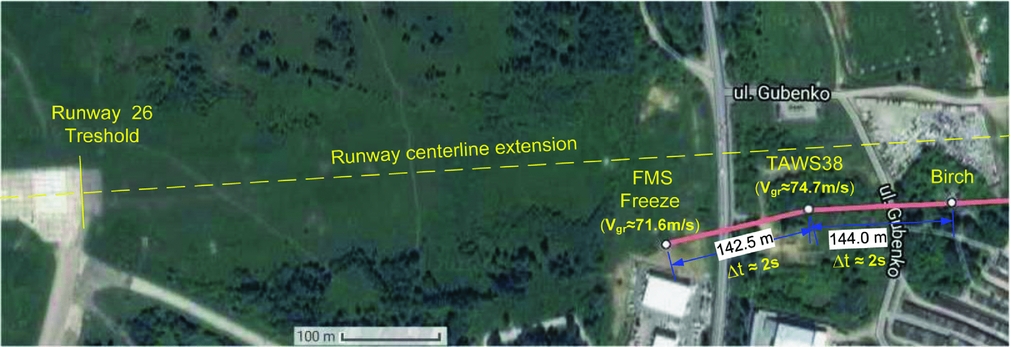
Figure 2. The site plan of the area near Smolensk North runway 26 threshold shows the marked horizontal path of the TU-154M during its lasts seconds of flight and locations of “Bodin's Birch”, TAWS 38 and “FMS Stop” alerts.
The log of TAWS 38 alert registered among others: the time of this alert, the geographical coordinates of where it occurred, the ground speed of the aircraft (6:40:59, 54.825022, 32.05483889, 74.7 m/s). Analogical data were registered in the FMS Stop alert log (6:41:02, 54.82472, 32.05268, 71.6 m/s), cf. Table 1. These data served for drawing an outline of the TU-154M aircraft's horizontal flight path during the last seconds of the flight in Fig. 2, where locations of “Bodin's Birch” event (54.82496, 32.05709) – the author's assessment, TAWS 38 and FMS Stop alerts are also labelled. The TAWS38 and FMS Stop alerts are separated by a distance of about 142 m according to their geographical coordinates. The average aircraft speed at this distance according to the data from TAWS records amounted to 73.15 ms−1. Hence, these 142 meters must have been covered by the aircraft during the time slightly less than 2 seconds (Δt = 142/73.15 ≃ 2 s). This assessment leads to physical contradiction with time values of TAWS38 (6:40:59) and FMS Stop (6:41:02) alerts registered in TAWS 38 and FMS alerts logs. The difference amounts to 3 seconds.
The logical explanation for this contradiction lies in accepting that the TAWS 38 alert actually occurred later than it was registered in the TAWS 38 alert log (6:40:59 UTC), at the same time FMS Stop warning must have occurred earlier than it was registered in the FMS Stop warning log (6:41:02 UTC). The indicated spatio-temporal contradiction can be explained as follows: the times of TAWS/FMS events were registered in respective logs in full seconds, hence actual times of these events must have been rounded off to full seconds in accordance with commonly accepted mathematical principles in that respect. Accepting the above as certainty makes it easy to notice that the TAWS38 alert occurred about half a second later than it is specified in TAWS 38 alert log, i.e. at the time ~6:40:59.49, and the FMS Stop warning occurred about half a second earlier than specified in the FMS Stop warning alert, i.e. at the time ~6:41:01.51. The difference between these times amounts to about 2 seconds. Thus, we achieve full logical and physical consistency of spatio-temporal data. One of the authors (AZ) addressed the Universal Avionics (UA) Company, the manufacturer of TAWS system installed on board TU-154M No 101 aircraft, with a request to answer the following question: Are the times of alerts registered in the records of the TAWS/FMS logs “cut off”, or “rounded off” to full seconds, i.e. giving the information concerning general rule, which is used in the company systems when generating times entries in TAWS/FMS systems logs. The legal representative of the UA Company agreed to answer this very general engineering question subject to the consent given by NTSB (National Transportation Safety Board) officer, who supervised the procedure of TAWS/FMS data recovery on TU-154M aircraft flight to Smolensk. Unfortunately the author has not obtained any explanatory information concerning this issue.
3.0 RECONSTRUCTION OF VERTICAL FLIGHT TRAJECTORY OF THE TU-154M AIRCRAFT AND ANALYSIS OF ACCOMPANYING EVENTS DURING THE LAST MINUTE OF THE FLIGHT
3.1 Reconstruction of vertical flight trajectory during the last 60 seconds of the flight
Data registered in the ATM QAR, CVR recorders and the TAWS/FMS systems make it possible to undertake an attempt to reconstruct the most probable vertical trajectory of the TU-154M aircraft during the last minute before its total destruction near Smolensk North airfield. For that purpose, the elevation profile of the ground surface was first elaborated along the horizontal trajectory of the aircraft along which it approached the Smolensk North airfield, i.e. on the path outlined by TAWS alerts 34–38 and the FMS Stop warning. The path on the route of TAWS 34–38 was rectilinear, while it makes a gentle arch on the TAWS38-FMS Stop segment. For the sake of simplicity, the elevation profile was determined as if the flight trajectory was also a straight line on this last segment. This approximation was adopted because, in the authors’ opinion, it has negligible influence on the analysis of the course of events. The ground elevation profile elaborated here relies on the data of earth surface height model SRTM, cf. for example(8). The elevation profile along path T34-T38-FMS, consistent with SRTM model, was determined with the aid of Geocenter profiler software, cf.(Reference Pietruszka9). More careful analysis has shown that the SRTM model, due to spatial resolution of its data, “flattens” (smoothes) the ground profile in those places where rather sharp changes of the elevation are present. This feature created some analytical difficulties only in the case of the ground plunge (valley), whose lowest place is about 1800 m short of runway 26. The bottom of this depression is on the elevation of about 202 m according to SRTM model. However, data in the MAK report show that the bottom of this valley is at the elevation of about 199 m, cf. Fig. 46 p. 157 in Ref. (6). The sudden peak of about 3 m visible in the aircraft vertical trajectory at ~6:40:45.5 shown in Fig. 4, suggests that elevation of the valley bottom given in MAK report is closer to reality. The elevation profile of ground surface along the TU-154M flight path is shown in a graphical form in Fig. 3 labelled “ground level”. No technical flight parameter data in sufficiently good shape to be amenable to analysis could be recovered from any catastrophic recorder of the TU-154M No 101 aircraft. The only regular data containing information on flight parameters and its technical devices and accessories suitable for analysis were acquired from the QAR ATM service recorder, cf. Refs (4) and (5). The data registered in this recorder constituted in many cases doubling of recordings made in catastrophic black boxes and originated from the same measuring devices. In the ATM QAR service recorder, Radio altimeter heights of the aircraft were registered among others. Radio altimeter measures height with respect to local ground surface. Figure 3 shows the graph of Radio heights registered by ATM QAR recorder compensated for the difference between elevation of the ground surface over mean sea level (MSL) and the elevation of runway 26 threshold (254 m MSL). The elevation of runway 26 threshold is marked in Fig. 3 with a thickened line and labeled with zero value. The Baro altitudes corrected for local atmospheric conditions at times of TAWS/FMS alerts are marked in this figure with rhombs (Baro altitude QFF), cf. second column in Table 2. The very good agreement between the values of Radio height (ATM QAR recordings) and Baro height (TAWS/FMS systems recordings), with differences reaching several meters, proves the correct operation of both types of altimeters, their correct calibration, but also mutual consistency of the data registered by different flight parameters recorders. After the TAWS 38 alert, the only sources of information on the TU-154M height of flight are recordings of Baro-altitude originating from the TAWS/FMS alerts logs. The recordings of the ATM QAR recorder show that, during the TAWS38 alert and at a later time, the radio altimeter of the Commander-in-Chief from which the TAWS system obtained information was out of order. In order to facilitate the reader's general spatio-temporal orientation in the course of events during the catastrophe the chart in Fig. 3 is labelled with times of occurrence of TAWS/FMS alerts together with the distance of their location from the runway 26 threshold, cf. also Fig. 2. The distances of the specified locations were determined with the aid of Google Earth software. The spatio-temporal coordination of the TAWS events was obtained upon reconstruction of the relation of ground speed of the aircraft in dependence on time. This was done upon acceptance of the following assumptions: a) average velocity on the ith path segment between two neighbouring TAWS locations is equal to: Vavi = Δsi/Δti, b) the velocity changes linearly on any path segment, i.e. it changes in accordance with the formula V(t) = Vpi + [(Vki − Vpi)/Δti] · (t − ti), c) difference (Vki – Vpi) between “end velocity” and “start velocity” on the ith path segment is equal to the difference resulting from values of ground velocities registered in respective TAWS alerts logs. The Δsi denotes physical distance between ith segment “start TAWS” location and “end TAWS” location (as per TAWS logs data), Δti denotes time period during which aircraft covered a distance of ith segment of path, as per TAWS logs data corrected in view of the results of spatio-temporal inspection, i.e. TAWS38 time was taken to be 6:40:59.49 (not 6:40:59.00) and FMS Stop time was taken to be 6:41:01.51 (not 6:41:02.00). For example, in the case of TAWS34 -TAWS35 segment: Δsi= 2213 m, Δti=26s, Vavi = Δsi/Δti = 85.1, Vki – Vpi = 91.4 – 81.1 = 10.3, cf. data in Table 1. In the procedure of reconstruction of the ground velocity profile of the TU-154M aircraft's translatory motion of the following start and end values of velocity were obtained on respective segments between TAWS alerts: T34-T35 <90.25-79.95; vav = 85.1 m/s>, T35-T36 (80.1-79.3; vav = 79.7 m/s>, T36-T37 (79.05-78.35; vav = 78.7 m/s>, T37-T38 (76.8-71.9; vav = 74.35 m/s>, T38-FMS Stop (72.55-69.45; vav = 71.00 m/s>. The average velocities of the TU-154M motion computed from TAWS logs recordings of ground speed are as follows: T34-T35 (vav = 86.25), T35-T36 (vav = 80.7), T36-T37 (vav = 79.95), T37-T38 (vav = 77.15), T38-FMS Stop (vav = 73.15 m/s), cf. Table 1. The comparison of respective speed averages indicates that all the average ground velocities calculated on the basis of TAWS logs recordings are higher than the average values resulting from spatio-temporal coordination of the events, and the biggest difference out of all segments amounting to 2.8 m/s appeared for the segment T37-T38. Reconstruction of the aircraft's ground velocity profile during its last minute of flight took into account the conclusions formulated in Section 2.1.2, i.e. it was accepted that the TAWS 38 alert occurred at 6:40:59.49 UTC, and the FMS Stop warning occurred at 6:41:01.51 UTC.
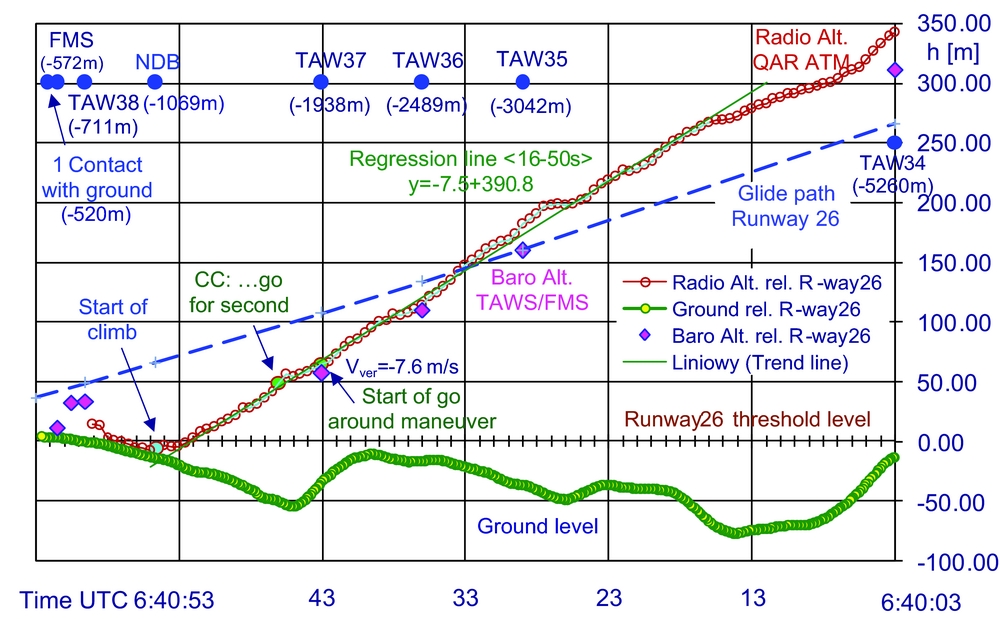
Figure 3. Vertical trajectory of the TU-154M aircraft during the last minute of flight on 10 April 2010 reconstructed on the basis of the data from ATM QAR, and CVR records and TAWS/FMS logs.
Analysing the chart of radio height, it is easy to notice that in the time range from about 6:40:16 till about 6:40:52.50, i.e. during over 35 seconds of the last minute of the flight, the aircraft descended practically with a constant rate. The regression line prepared for this range of time shows that the descent rate, practically constant, amounted during this time period to 7.5 m/s. The appropriate angle of approach path specified on landing card of Smolensk North airfield amounts to 2.67° (descent rate about 3.50 m/s) – cf. MAK report p. 51 tan–1(500/(10410 + 300)) = 2.67°, while practically constant in the time range 6:40:16-6:40:52.50 actual angle of the approach path of the aircraft amounted to 5.13° (descent rate of about 7.5 m/s). During this time the aircraft descended from an altitude of about 270 m above the runway 26 threshold, which it had when it was about 4200 m away from it to the zero height above the runway 26 (h = 0) when it was about 1200 m short of the runway 26 threshold. More detailed analysis of the vertical trajectory of the flight path and the events and circumstances surrounding it is given in the next section.
3.2 Early stage of the course of accident
Figure 4 shows the last 20 seconds of vertical trajectory of the TU-154M aircraft, together with much supplementary information, in order to facilitate the discussion of the course of events and work out an opinion on how and why it happened that the aircraft found itself at the elevation of the runway 26 (h = 0) already 1200 meters before its threshold. The examination of the change of values of control parameters and the corresponding actuation elements of the aircraft is useful in this analysis. For illustration purposes, Fig. 5 shows graphically the positions of throttle levers of engines power (DSS) and rotations of turbines of all three engines of the aircraft, as they change in time during the last 25 seconds of flight. The inspection of the variation in time of a number of technical parameters of the flight recovered from the ATM QAR recorder allows one to notice that the main control elements of the aircraft such as, e.g. wheel control position, or throttle levers of engines power and main actuation elements of the aircraft e.g. position of elevator, or rotation speed of the engine's turbines practically did not change starting with TAWS34 alert (6:40:03) until the TAWS37 alert (6:40:43), i.e. during the period of 40 seconds. Only at the time 6:40:43, i.e. the instant practically simultaneous with theTAWS37 alert, do the main elements of the aircraft flight control: position of wheel column, position of throttle levers of engines power and the corresponding actuation elements, i.e. elevator and engines rotation (power) begin to significantly change. The initiation of observable changes in flight parameters took place was about 1940 m short of runway 26 threshold and at the height of about 65 meters above it (100 m above ground surface). These observations indicate, on the one hand, the lack of pilots’ intervention in the aircraft controlling elements in the indicated 40 seconds period of time, and on the other, they allow drawing a conclusion that the aircraft flight during this period of time proceeded in the manner the pilots wished. Taking into account the circumstances indicated above one can accept that at 6:40:43 the TU-154M commander initiated the go-around manoeuver, and the realisation of this specific manoeuver is found reflected in the significant changes in flight parameters pointed out above. In Figs 4 and 5, the instant of initiation of the go-around manoeuver is marked with graphical elements and it is labelled “Start of go-around”.
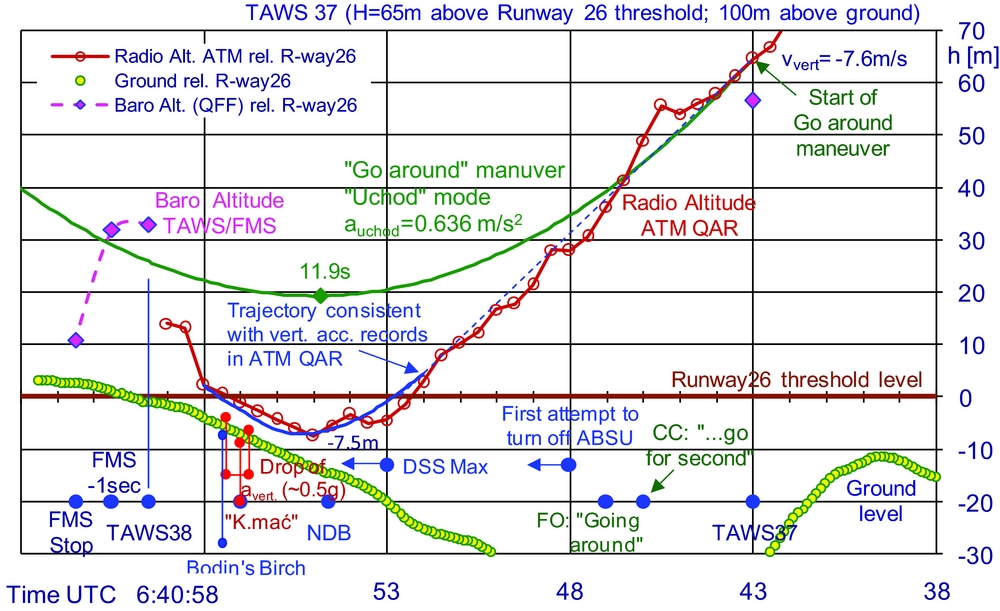
Figure 4. The vertical trajectory of TU-154M aircraft during the last 20 seconds of the flight is shown with indication of some circumstances and accompanying events.
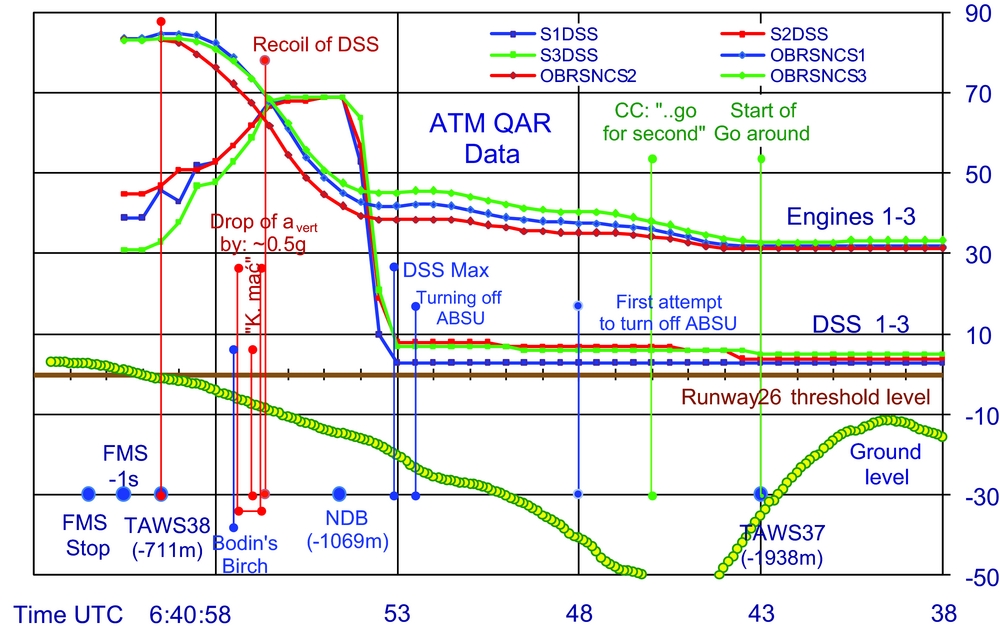
Figure 5. Change in time of control elements settings and response of corresponding actuation elements of the TU-154M aircraft drive units during the last 25 seconds of the flight with the indication of some accompanying events and circumstances. Charts of three engines throttle levers location (DSS) – control elements, and rotation of all three engines of the airraft – actuation elements. Data from ATM QAR service recorder.
The data recovered from the ATM QAR recorder concerning the module of automatic control of the aircraft (ABSU) show that the Commander-in-Chief decided to execute the go-around manoeuver in the automatic control mode including: transverse stabilisation -roll, longitudinal stabilisation -pitch, and automatic control of engines power. The TU-154M aircraft enables executing a go around manoeuver in a dozen or so ways, with various degrees of using automatic control of the aircraft (with or without transversal stabilisation of the aircraft, with automatic or manual control of engines power, etc.). To the authors' best knowledge, the Commander-in-Chief probably decided to use the so called “Uchod” mode for the go-around manoeuver in the case discussed here. In accordance with the information given in the manual “Practical Aerodynamics of TU-154M Plane”, cf. p. 126 in Ref. (Reference Biechtir, Rżewskij and Cipienko1), the “Uchod” procedure settings of flight parameters cause such control of the aircraft that its go-around manoeuver trajectory makes a parabola shown in Fig. 4 and labeled “Go around -mode Uchod”. Upon realisation of this trajectory the aircraft gently slows down its vertical speed, and before it actually goes off climbing it reaches apogee of descent the depth of which depends on the vertical speed, which the aircraft had at the moment of go-around manoeuver initiation. In the case at hand the vertical speed of the aircraft descent at the moment of the go-around manoeuver initiation is precisely known from the TAWS37 alert log and it was equal to 7.6 ms−1. Such initial value of descent speed results in a 45 m deep apogee of a go-around trajectory in “Uchod” mode. The pilot practically had no possibility to find out whether the go-around manoeuver was correctly realised for at least 3 seconds from the maneuver initiation. This is because the aircraft speed vectors that are in a “go around” trajectory in this range of time are practically parallel to the aircraft speed vector at the go-around manoeuver initiation.
The scenario of events described above finds confirmation in the records of the CVR recorder. After 3 seconds from actual initiation of the go-around manoeuver, at 6.40.46, the Commander informed the crew about this action by saying “. . .go for second” (sentence of the Commander-in-Chief overlaps with the statement of the other person). One second later, the First Officer acknowledges this message by saying the phrase “Going around”. At just about the same moment, the Commander-in-Chief realised that the aircraft is still flying with the vertical speed practically unchanged instead of slowing down its vertical speed. Due to that, he undertook an attempt to switch off automatic control of the aircraft (ABSU) and to take over control of the flight through overpowering autopilot longitudinal channel (at 6:40:48), cf. Fig. 49 in MAK report(6). This action is marked graphically in Figs 4 and 5 and labelled “First attempt to turn off ABSU”. Yet, the Commander managed to take over the flight control only 4.5 s later at 6:40:52.5 UTC, when he finally overpowered longitudinal channel of autopilot (wheel column). However, during all the time from starting the go-around manoeuver at 6:40:43 (TAWS37) until 6:40:52.50 that is for over 9 s, when the Commander-in-Chief took over manual control of the aircraft, the aircraft descended with practically constant vertical speed of about 7.5 m/s. This resulted in the TU-154M finding itself at the height of the runway 26 threshold (254 m MSL) when it was about 1200 m short of this threshold. This means that had the level of ground surface been at the height of the runway 26 threshold level, then at about 6.40.52.5 UTC the aircraft would have struck the ground. It was a lucky coincidence that at precisely this location there was a local depression of the ground of about a dozen or so meters, which together with the skilful actions of the Commander-in-Chief enabled to avoid the collision of the aircraft with the ground surface. Among others, at about 6:40:53, the Commander started moving the throttle levers of all three engines (DSS) into their maximum position, which operation lasted for about 1 s. Shifting the throttle levers of the engines into “starting power” position caused practically immediate entering of the engines into high rotations (high power), which resulted in quick slowing down of the aircraft descent. At about 6:40:55 the aircraft reached an apogee of descent when it was several dozen meters after NDB and 6 m above ground (−7.5 m below runway 26 threshold level), following which it started to gain altitude. The aircraft climbed actively with a vertical acceleration of 3.7 m/s2 for about a second until 6:40:56.75, flying practically at constant height during this time due to the also rising slope of the ground surface in this area, cf. Figs 4 and 5. The Commander's avoiding the collision of the aircraft with the ground, and bringing it to the phase of climbing actually meant coming out from the dangerous situation and created very good chances for successful completing of the go-around manoeuver leaving the aircraft structure and people on board unscathed.
The sequence of events described above deserves to be distinguished as the early stage of the accident, which will allow for the formulation of some observations, hypotheses and conclusions concerning this phase of the accident. In particular an assessment should be made: in the first place, how and why the TU-154M aircraft found itself on the level of runway 26 about 1200 m short of its threshold and what circumstances and actions enabled the crew to get the aircraft out of this dangerous situation without its striking the ground. Most probably, the following circumstances had an impact on the course of events:
a) Bad weather conditions, thick fog and lack of required visibility prevailed at Smolensk North airfield. The weather conditions did not fulfill the requirements for landing the TU-154M aircraft at this airfield. The Russian as well as the Polish services responsible for meteorological safety of the flight knew about worsening and bad weather conditions – preventing eye contact with the ground – at least 20 minutes before the TU-154M aircraft approached the direct vicinity of the Smolensk North airfield area. The services were represented among others by: the air operations controller of Smolensk North airfield, the controller of the Military Airport Warszawa-Okęcie, and also the duty officer of Air Operations Center – who monitored the TU-154M aircraft flight from Poland. These services should have immediately given orders to the TU-154M crew to fly to the auxiliary airfield, which they did not do.
b) For over 30 s before starting the go-around maneuver, the TU-154M aircraft descended with practically constant vertical speed of 7.5 m/s. Good practices in that respect recommend the vertical speed of about 3.5 m/s. The operation manual of TU-154M aircraft admits even 8 m/s as the initial vertical speed of a go-around manoeuver in “Uchod” mode, cf. p. 126 in Ref. (Reference Biechtir, Rżewskij and Cipienko1), but the vertical descent speed of 7.5 m/s in the conditions of poor visibility should be acknowledged as a circumstance likely to increase the risk of an accident.
c) When starting the go-around manoeuver the aircraft was at the height of 65 m above runway 26 threshold. The landing card of Smolensk North airfield, as well as good practices in that respect consider 100 m above the runway threshold level to be the correct minimum descent altitude (MDA) for deciding to execute a go-around manoeuver. It should be acknowledged that starting a go-around manoeuver at the height of 65 m above the runway threshold level was a circumstance entailing the risk of accident occurrence. It is so because the mushing depth in “Uchod” mode of a go-around manoeuver at the initial vertical speed of 7.6 m/s is 45 m, and it was leaving very narrow margin of safety amounting to only 20 m of height, protecting the aircraft against the crash with earth.
d) As it was described above and illustrated graphically in Figs 4 and 5, ATM QAR flight parameters recordings give grounds for an assessment that the go-around manoeuver of the TU-154M aircraft was initiated and next executed, most probably in “Uchod” mode practically at the moment of TAWS37 alert. Unfortunately, instead of flying away, following the correct programme for “Uchod” procedure trajectory, cf. the curve marked with the label “Go-around Uchod” in Fig. 4, for the next about 9 s, the TU-154M continued its flight down with a practically constant speed of descent. It is reasonable to conclude that probably the automatic go-around procedure and/or autopilot control system (ABSU) worked in a faulty manner. Finding out the actual cause of faulty execution of go-around procedure requires a separate careful investigation, which goes beyond the scope of the present work.
e) Both the main control elements (e.g. column wheel, throttle levers -DSS), and the corresponding main actuating elements (elevator, engines) of the aircraft were working perfectly during this phase of the flight. This can be inferred from the actuating elements correctly following the settings of the control elements. For example, in reaction to the changing position of the wheel column and throttle levers there took place proportional to its settings deflection of the elevator and increase of the engines rotation. It is reasonable to infer that during this phase of the flight, defined here as the preliminary stage of the accident, the aircraft was controllable and allowed the pilots to continue along the flight path they required.
The engine's lack of power in the early stage of the go-around manoeuver was not because the engines were out of order but most probably because their power was defectively controlled by automatic control algorithm.
f) As it was already mentioned, had there not been a local depression 1250 - 850 m short of the runway threshold below runway 26 between 10 and 20 m deep, then the aircraft would have struck the ground at 6:40:52.5 UTC time. It is worth estimating what one could expect and what would have been the probable consequences, had the aircraft actually hit the ground at the time. Such risk analysis is very important in order to be able to correctly estimate absolute consequences of the decisions and actions, which occurred during this particular phase of the flight. The results of hypothetical collision of the TU-154M aircraft with the ground in the specified above circumstances would have primarily involved material damages – in the form of failures and destructions of the aircraft structure, whereas measured in terms of the number of fatalities they would have been very limited – probably the prevailing majority of the passengers and crew would have survived this event.
The above assessment is substantiated by the following reasoning. Assuming that the aircraft would have continued its descent rectilinearly with the vertical rate 7.5 m/s, until it had crashed with the earth, then the impact would have occurred at about 6:40:54.75 UTC. The surface of the ground at the impact place would have been sloped at an angle about 2.3° towards the horizontal level, while taking into account the 5.7° angle of descent of the aircraft this gives 8° effective angle of impact, and the aircraft perpendicular to the ground velocity equal to 10.5 m/s (parallel velocity 74.6 m/s), cf. also Fig. 4. The fuselage of the aircraft would have been pitched nearly parallel to the surface of the ground; with bow up at the angle of about 4° = 6.5° − 2.3° (the pitch angle would have been 6.5° at the predicted impact according to ATM QAR data). It is worthwhile to recall here that typical vertical speed of a parachuter at touching the ground is 5 m/s. Parachuters execute thousands of jumps on their own legs without damage to their health or their lives. The passenger aircraft impacting the earth with its nearly entire bottom surface area at the speed of 10.5 m/s most probably would have largely resulted in crushing the luggage space against the passenger's compartment space. This would have slowed down vertical momentum, after which the aircraft would have simply skidded on the ground – perhaps with the airframe broken perpendicularly to its longitudinal axis – until its horizontal speed hit 0. As the statistics of the aircraft accidents show the survival rate in accidents with similar conditions is high, cf. Bible(Reference Bible2). Sometimes, all the people on board would survive as was the case of the DC9 aircraft accident near Gotrorra in 1991, cf. Ref. (Reference Forssberg, Sigfridsson, Benker, Elinder, Lundin and Mansfeld3).
3.3 First stage of the aircraft's destruction
Earlier examination works allow distinguishing certain stages of destruction of the TU-154M aircraft structure. In paper(Reference Ziółkowski13), the author divided the processes, which finally led to the total destruction of the aircraft in three main phases, cf. Fig. 3 and accompanying text in Ref. (Reference Ziółkowski13). The data registered in the TU-154M recorders, i.e. the ATM QAR, CVR and TAWS/FMS deliver information in principle concerning only the first phase of the aircraft's destruction, which is described below.
When the aircraft was in the climbing phase of the go-around manoeuver, about one second after passing the minimum of descent, the TU-154M recorders registered a number of signals indicating the occurrence of a serious emergency situation. The earliest among them is a sudden moving back -recoiling of throttle levers (DSS) of all three engines from their maximum “take off power” position, which was initiated at 6:40:56.635 UTC, cf. Fig. 5. Had this action been executed intentionally, it would have led to a quick reduction of the engines’ power. This would be completely irrational in a situation where the aircraft is right above the ground, in the final stage of executing the go-around manoeuver. At 6:40:56.875, the vertical acceleration of the aircraft suddenly dropped from 1.38 g to 0.88 g (Δavert = 0.5 g = 4.9 m/s2). This last value of vertical acceleration held on for about 0.6 s – till 6.40.57.375, and again the vertical acceleration jumped to the value of 1.28 g -which actually meant returning of the aircraft to active climbing with acceleration of about 3 m/s2. The next alarming signal originated from the CVR recorder where, at 6:40:57, a curse was recorded “F..k it” (“K. mać” in the Polish language), cf. Figs 4 and 5. Each of the above-mentioned events, when examined separately, could indicate the occurrence of a relatively minor malfunction or problem, but when examined together, they provide premises for the conclusion that some kind of serious emergency situation occurred on the aircraft.
The spatio-temporal coordination of alerts registered in the TAWS/FMS systems resulted in the finding that the TAWS38 alert must have occurred at ~6:40:59.5, while the FMS Stop alert at ~6:41:01.5. This circumstance played the key role in the present reconstruction of the aircraft's ground speed profile. The reconstructed ground speed profile shows that the aircraft most probably found itself at a distance of 855 m from the runway 26 threshold, i.e. in direct vicinity of “Bodin's birch” at the time ~6:40:57.50, and not during the time period <6:40:56.500-6:40.56.875>, i.e. when a set of signals was registered most probably linked with the TU-154M left wing tip damage process, cf. Fig. 5. This indicates that the detachment of the left wing-tip did not result from the aircraft colliding with “Bodin's birch”. The data from the recorders do not allow for formulating a reliable hypothesis concerning a possible type of interaction between the TU-154M aircraft and “Bodin's birch”. In Fig. 4 besides the vertical trajectory drawn on the basis of radio heights, one can also see a fragment of the aircraft trajectory resulting from the values of vertical acceleration recorded in ATM QAR in the time period <6:40:52–6:40:58> in accordance with the formula  $h = {h_0} + ({v_0} + {a_{QAR}}(t) \cdot t) \cdot t + {\textstyle{1 \over 2}}{a_{QAR}}(t) \cdot {t^2}$. where h 0 = 5.2 m, v0 = –6 m/s and a QAR(t) denotes the values of vertical acceleration registered every 1/8 s by ATM AQR recorder. The values of two free parameters h 0 and v0 were selected in such a manner that the curve h(t) conforms as best as possible to the trajectory elaborated on the basis of radio heights recordings. It should be remembered that the radio heights flight path shown in Fig. 4 directly depends on the adopted values of elevations of the ground surface above sea level (MSL), whose error can easily reach two meters. According to the flight path elaborated on the basis of vertical acceleration at 6:40:57.5 – cf. “Bodin's birch” entry in Table 1, the TU-154 aircraft was about 5 m above ground level and had the vertical speed of climbing +4.3 m/s. Then according to radio height data from ATM QAR the aircraft was at 6 m above the ground with a pitch of 15.6° and roll −3.8°. The data analysed here do not allow for formulating a reliable opinion on whether there was a direct physical contact between the integrated aircraft and Bodin's birch tree. A reliable assessment of what happened and what caused damage to a considerable part of the left wing of TU-154M aircraft requires further research and goes beyond the scope of the present paper.
3.4 Subsequent stages of the aircraft's destruction
The data of the ATM QAR recorder suitable for analysis ends at about 6:40:59.5 UTC. There are in fact later recordings of the data but their reliability is questionable at present. The only trustworthy and reliable sources of information on the later fate of the aircraft consist of data from two logs of the TAWS/FMS systems, i.e. the TAWS38 and the FMS Stop alerts. From these logs, it is known that at 6:40:59.5 the aircraft was at barometric height of 33 m, and at 6:41:00.5 it was at the barometric height of 31.9 m. From this, it can be concluded that within this second the aircraft reached its last apogee of height. At 6.41.01.5 the aircraft was at a barometric height of 10.8 m and was descending with the down vertical speed of 12.1 m/s. Even a rough analysis shows that the aircraft at that time was simply falling to the ground, and not flying anymore. The occurrence of the TAWS38 alert and picture of the aircraft's remains at the wreckage site deliver premises to formulate an opinion that right before the TAWS38 alert began a second phase of the aircraft's destruction, consisting in the disintegration of the aircraft airframe, cf. label 2 in Fig. 3 in Ref. (Reference Ziółkowski13). The examination of this phase of the catastrophe, and the subsequent ones, requires a separate work and cannot be based on the recordings from the aircraft flight parameters recorders due to the lack of such data. It will have to be based on the analysis of other types of evidence, among others the analysis of deformation patterns and the scattering of the aircraft residues found on the wreckage site.
4.0 SUMMARY AND CONCLUDING REMARKS
The integrated analysis of the flight parameter data, registered on 10 April 2010 in the TU-154M aircraft, recovered from different types of recorders (ATM QAR, CVR, and TAWS/FMS) showed that these data are mutually physically consistent. The data enabled reconstruction of the most probable horizontal and vertical trajectory of the aircraft flight during nearly the whole last minute before its total destruction, i.e. except for 2–3 s from the FMS Stop until complete halt of the aircraft fragments. The reconstructed vertical and horizontal trajectories, in all probability, do not diverge from the actual ones by more than a few meters. The data made available by the recorders enabled the authors to gain information and formulate of a number of observations concerning the events surrounding the preliminary stage of the catastrophe, and the first phase of the aircraft's destruction. This information is not sufficient to execute an analysis of the subsequent phases of aircraft damage till its total destruction and/or formulating comprehensive assessments regarding the course and causes of the TU-154M aircraft accident.
In the preliminary stage of the catastrophe the aircraft descended to the runway level 1200 m short of the runway threshold. Fortunately, the crew managed to avoid a collision of the aircraft with the ground surface and got the aircraft to regain altitude. This last fact created good chances for the aircraft and the people on board to escape from the dangerous situation unscathed, and the go-around manoeuver would have thus ended up successfully. Unfortunately, the first phase of the TU-154M aircraft destruction occurred, during which the aircraft's left wing was seriously damaged, first due to the detachment of its about 5-m-long end-tip. The causes of the wing damage are difficult to identify using only the data from recorders. The official MAK and KBWLLP reports attribute the primary technical cause of the left-wing damage to a collision with a tree (so called “Bodin's birch”) located at a distance of 855 m short of the runway 26 threshold. The conclusion of the present work based on spatio-temporal coordination of data from the TAWS/FMS alerts indicates that this is highly improbable.
The analysis executed on flight parameter data showed that the TAWS system can be an excellent source of data not only for generating alerts directed at aircraft crew but also for the information useful when examining aviation accidents. It is recommended to bring down the accuracy of time entry recordings of alerts in TAWS logs to within 0.1 seconds to further increase the system usefulness when examining air accidents. The other TAWS system functionality helpful in air accidents examination would be the registration in TAWS logs of not only barometric altitudes but also raw values of atmospheric pressure and temperature outside the aircraft. It seems appropriate and desirable to undertake development works on TAWS system specifically focused on enabling its effective use in examining dangerous and post-accident situations. One of the problems within this line of research would be to determine the best way to combine functions fulfilled by the TAWS system and catastrophic recorders of the aircraft.
The TAWS system developments for the purposes of accident analysis do not necessarily have to involve very expensive or sophisticated measures. A very practical solution might be the implementation of simple bio-inspired technique used commonly by wild animals. When a wild animal catches/detects signs of danger, it goes into a state of increased vigilance and remains in such a state of alert until it deems it safe to revert back to its usual way of being. The implementation of a TAWS increased vigilance safety procedure could operate as follows: when the TAWS alert is generated it is then transferred/directed not only to pilots but also triggers an increase in the frequency of registration of all or some flight parameters for a time period of let us say 50 s. If during these 50 s no aircraft crash or new TAWS alert occurs, then the registration frequency is returned back to its standard rate. This simple solution would require rather marginal costs for its practical implementation.
APPENDIX: AIRCRAFT FLIGHT ALTITUDE DETERMINATION WITH CONSIDERATION OF AN AIRPORT LOCAL PRESSURE AND TEMPERATURE
Useful physical data:
In subject matter literature subscript “0” often denotes reference conditions of standard atmosphere, here for that purpose subscript “isa” is used.
A1 BAROMETRIC ALTITUDE MEASUREMENTS – BAROMETRIC HEIGHT
Operation of the barometric altimeter is based on taking advantage of two physical laws: ideal gas equation of state, static equilibrium law and model of standard atmosphere.
A1.1 Equation of state of ideal gas
The ideal gas equation of state, also known as the Clapeyron equation, can be expressed as follows:
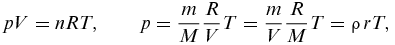 $$\begin{equation}
pV = nRT,\quad \quad p = \frac{m}{M}\frac{R}{V}T = \frac{m}{V}\frac{R}{M}T = \rho \,rT,
\end{equation}$$
$$\begin{equation}
pV = nRT,\quad \quad p = \frac{m}{M}\frac{R}{V}T = \frac{m}{V}\frac{R}{M}T = \rho \,rT,
\end{equation}$$
where p denotes gas pressure, n number of moles, V volume of n moles of gas, T absolute temperature, i.e. expressed in Kelvin degrees, m mass of gas (kg), M mole mass of gas (kg/mol), ρ gas density, r ≡ R/M = const specific gas constant of particular gas. When the values of pressure and temperature are known, then the value of density can be determined from the formula (A1), as the quantity dependent on pressure and temperature ρ(p, T).
A1.2 Static equilibrium equation of atmospheric air
The static equilibrium equation of atmospheric air can be expressed in the incremental form as follows:
 $$\begin{equation}
dF = dQ;\quad dF = - A \cdot dp,\quad dQ = A \cdot (\rho g) \cdot dh,
\end{equation}$$
$$\begin{equation}
dF = dQ;\quad dF = - A \cdot dp,\quad dQ = A \cdot (\rho g) \cdot dh,
\end{equation}$$
where dF denotes the force originating from the atmospheric pressure increment dp between heights h and h + dh, operating on the surface area A, and with dQ the weight of the air occupying the volume of a column with the base area A and height dh. The symbol ρ denotes air density at the height h, g is the earth gravitational acceleration, while ρg denotes the specific weight of atmospheric air. Equation (A2) must be satisfied for all heights h. The static equilibrium of atmospheric air expresses the requirement that the weight of the air column finding itself above some height level must be balanced by supporting its force exerted by atmospheric pressure.
The static equilibrium equation combined with the equation of state of atmospheric air leads to the following relations:
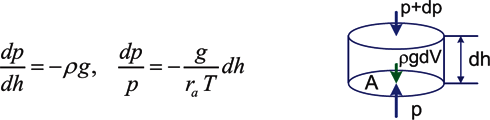
where ra denotes universal gas constant of standard atmospheric air. Reciprocal relation to (A3)1 defines the so-called barometric degree ( ${\deg _{{\rm{baro}}}} \equiv dh/dp = - 1/(\rho g)$). This barometric degree determines how much the height must change for the atmospheric pressure to change by 1 hPa. The minus sign indicates that the pressure decreases when the height increases.
Integration of relation (A3)2 upon conjecture that the value of the temperature is constant with the height leads to the classical barometric formula:
 $$\begin{equation}
(h - {h_0}) = - ({r_a}T/g) \cdot \ln (p/{p_0}),\quad T(h) = {\rm{const}}.
\end{equation}$$
$$\begin{equation}
(h - {h_0}) = - ({r_a}T/g) \cdot \ln (p/{p_0}),\quad T(h) = {\rm{const}}.
\end{equation}$$
A1.3 Standard atmosphere model (ISA, ICAO) – a concept of conventional altitude above mean sea level (MSL)
The International Civil Aviation Organization, ICAO, introduced the world standard of so-called International Standard Atmosphere (ISA). It is also equivalently called the ICAO atmosphere.
The model of standard atmosphere defines how the values of pressure, temperature, and density of atmospheric air change with height, from adopted conventionally mean sea level (MSL) h = 0 up to the height of h = 90, 000 m, cf. for example(7) and/or(10). In the present work, interest is focused in the range of heights from 0 to 11,000 m (MSL), i.e. the range of altitudes of air passenger transportation, cf. Fig. A1. This range of height is also called the troposphere. The standard model of air in the troposphere adopts the following conjectures:
a) On the mean sea level (MSL), the standard pressure and the standard temperature have the following values:
(A5) $$\begin{eqnarray}
{p_{isa}} &=& 1013.25{\rm{ [}}hPa]\;\;(760{\rm{ [}}mmHg]),\quad {T_{isa}} = 288.15{\rm{ [K]}},\;\;(15{\rm{ [C]}}), \nonumber\\
{h_0} &=& 0\;[m]\;MSL.
\end{eqnarray}$$
$$\begin{eqnarray}
{p_{isa}} &=& 1013.25{\rm{ [}}hPa]\;\;(760{\rm{ [}}mmHg]),\quad {T_{isa}} = 288.15{\rm{ [K]}},\;\;(15{\rm{ [C]}}), \nonumber\\
{h_0} &=& 0\;[m]\;MSL.
\end{eqnarray}$$
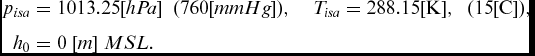
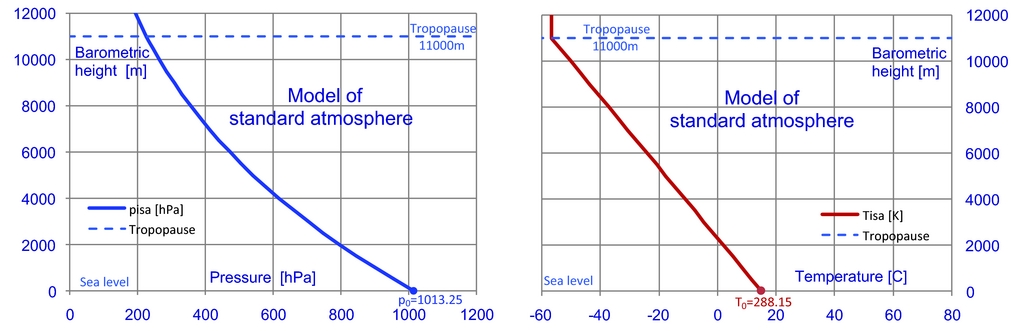
Figure A1. Pressure and temperature variation with change of altitude in accordance with ISA (ICAO) atmosphere model.
The reference state (pisa, Tisa) specified above defines the standard conventional height of the mean sea level. Existence of such a standard sea level, common for all passenger aircraft, is necessary to make it possible to create procedures for their safe traffic.
b) Air temperature in the standard atmosphere model, by definition, decreases linearly with height at a gradient of 6.5°C per 1000 m,
(A6)$$\begin{equation}{T_{isa}}(h) = 288.15 - {a_1}h,\quad {a_1} = 0.0065\;[K/m],\quad h \in < 0,11000 > \;[m]\end{equation}$$
c) Air in a standard atmosphere obeys the equation of state of ideal gas (A1),
d) Air in a standard atmosphere satisfies the equation of static equilibrium (A2).

The conjectures specified above, adopted in the model of standard atmosphere, find their justification in experimental research results of actual earth atmosphere.
The relation between the value of pressure in the standard atmosphere in dependence on the height over mean sea level can be determined by integrating relation (A3)2 within the limits < h 0, h >. Using (A6) and executing simple transformations, one obtains:
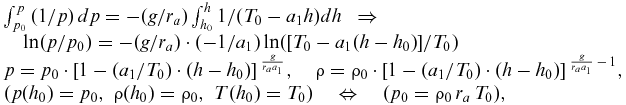 $$\begin{equation}
\begin{array}{@{}l@{}} \int_{{{p_0}}}^{p}{{(1/p)}}\,dp = - (g/{r_a})\int_{{{h_0}}}^{h}{{1/({T_0} - {a_1}h)dh}}\;\; \Rightarrow \quad \\
\quad \ln (p/{p_0}) = - (g/{r_a}) \cdot ( - 1/{a_1})\ln ([{T_0} - {a_1}(h - {h_0})]/{T_0})\\
p = {p_0} \cdot {[1 - ({a_1}/{T_0}) \cdot (h - {h_0})]^{\;\frac{g}{{{r_a}{a_1}}}}},\quad \rho = {\rho _0} \cdot {[1 - ({a_1}/{T_0}) \cdot (h - {h_0})]^{\;\frac{g}{{{r_a}{a_1}}}\, - \,1}},\\
(p({h_0}) = {p_0},\;\rho ({h_0}) = {\rho _0},\;T({h_0}) = {T_0})\quad \Leftrightarrow \quad ({p_0} = {\rho _0}\,{r_a}\,{T_0}), \end{array}
\end{equation}$$
$$\begin{equation}
\begin{array}{@{}l@{}} \int_{{{p_0}}}^{p}{{(1/p)}}\,dp = - (g/{r_a})\int_{{{h_0}}}^{h}{{1/({T_0} - {a_1}h)dh}}\;\; \Rightarrow \quad \\
\quad \ln (p/{p_0}) = - (g/{r_a}) \cdot ( - 1/{a_1})\ln ([{T_0} - {a_1}(h - {h_0})]/{T_0})\\
p = {p_0} \cdot {[1 - ({a_1}/{T_0}) \cdot (h - {h_0})]^{\;\frac{g}{{{r_a}{a_1}}}}},\quad \rho = {\rho _0} \cdot {[1 - ({a_1}/{T_0}) \cdot (h - {h_0})]^{\;\frac{g}{{{r_a}{a_1}}}\, - \,1}},\\
(p({h_0}) = {p_0},\;\rho ({h_0}) = {\rho _0},\;T({h_0}) = {T_0})\quad \Leftrightarrow \quad ({p_0} = {\rho _0}\,{r_a}\,{T_0}), \end{array}
\end{equation}$$
where p 0, T 0, ρ0 denote the values of pressure, temperature and density of air in some freely chosen initial state. The relation (A7)5 must be satisfied at each time instant for (A7)3 and (A7)4 to be mutually consistent. The relation (A7)4 can be derived upon transformation of relation (A7)3 to the form (p(h)/p 0) = [T(h)/T 0)]g/(raa 1) and using the property (ρ/ρ0) = (p/p 0)/(T/T 0). Relations (A7)3,4 simultaneously obey the ideal gas equation of state – p = ρ raT (p 0 = ρ0 raT 0), cf. (A2)2. Only two of the three initial parameters of state (p 0, T 0, ρ0) can be chosen independently. Usually these are pressure and temperature (p 0, T 0). The possibility of the free choice of the initial parameters (p 0, T 0) – constants of integration, appearing in relation (A7)2, prove convenient when deriving a barometric altimeter formula consistent with the overall model of standard atmosphere and to incorporate actual local meteorological conditions of pressure and temperature at the airfield runway level. Substituting in relations (A7)3,4 the reference conditions (A5) and executing simple transformations, one obtains the classical relations of a standard atmosphere model,
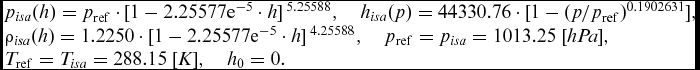 $$\begin{equation}
\begin{array}{@{}l@{}} {p_{isa}}(h) = {p_{{\rm{ref}}}} \cdot {[1 - {\rm{2}}.{\rm{25577}}{{\rm{e}}^{ - 5}} \cdot h]^{\;5.25588}},\quad {h_{isa}}(p) = {\rm{44330}}{\rm{.76}} \cdot {\rm{[}}1 - {(p/{p_{{\rm{ref}}}})^{0.{\rm{19}}0{\rm{2631}}}}],\\ {\rho _{isa}}(h) = {\rm{1}}.{\rm{2250}} \cdot {[1 - {\rm{2}}.{\rm{25577}}{{\rm{e}}^{ - 5}} \cdot h]^{\;4.25588}},\quad {p_{{\rm{ref}}}} = {p_{isa}} = 1013.25\;[hPa],\\
{T_{{\rm{ref}}}} = {T_{isa}} = 288.15\;[K],\quad {h_0} = 0. \end{array}
\end{equation}$$
$$\begin{equation}
\begin{array}{@{}l@{}} {p_{isa}}(h) = {p_{{\rm{ref}}}} \cdot {[1 - {\rm{2}}.{\rm{25577}}{{\rm{e}}^{ - 5}} \cdot h]^{\;5.25588}},\quad {h_{isa}}(p) = {\rm{44330}}{\rm{.76}} \cdot {\rm{[}}1 - {(p/{p_{{\rm{ref}}}})^{0.{\rm{19}}0{\rm{2631}}}}],\\ {\rho _{isa}}(h) = {\rm{1}}.{\rm{2250}} \cdot {[1 - {\rm{2}}.{\rm{25577}}{{\rm{e}}^{ - 5}} \cdot h]^{\;4.25588}},\quad {p_{{\rm{ref}}}} = {p_{isa}} = 1013.25\;[hPa],\\
{T_{{\rm{ref}}}} = {T_{isa}} = 288.15\;[K],\quad {h_0} = 0. \end{array}
\end{equation}$$
The ISA reference density at MSL ρisa(h = 0) = 1.2250 [kg/m3] can be determined using (A1)2. In the above formula, pressure is expressed in hectopascals and height in meters.
A2 BAROMETRIC ALTIMETER AND ITS SETTINGS
A2.1 Calibration of barometric altimeter of an aircraft
The barometric altimeter of an aircraft from a technical point of view is a pressure gauge. The air pressure is the only physical quantity measured by this technical device. The results are scaled to give an altitude above sea level in accordance with the model of standard atmosphere (ISA). Barometric altimeter readings can be scaled and displayed in several ways. Mode of display is changed by presetting the value of reference pressure pref present in formula (A8)2. For example, the QNE reading of altitude is displayed when the reference pressure is preset to the ISA standard reference pressure pref = pisa = 1013.25 hPa (760 mmHg). The QFE altitude reading is displayed when the reference pressure is preset to the value corresponding to the local pressure at the airfield's runway level, cf. Fig. A2. The altitude can be displayed in feet or meters. The possibility of introducing a reference pressure pref is the only control element over the barometric altimeters on the aircraft. The barometric altimeters do not allow for a change of the reference temperature (T ref), T 0 in formula (A7)3.
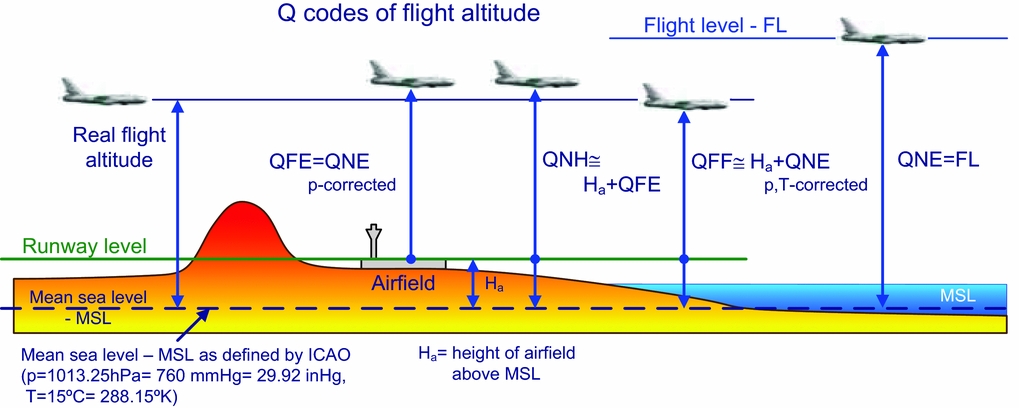
Figure A2. Schematic illustration of Q codes of flight altitudes. During the prevailing amount of time, QFF gives the best estimate of the aircraft flight altitude near the airport.
The introduction of the concept of conventional, modelling mean sea level (MSL), defined with the aid of standard atmosphere model, close to the actual, physical sea level at several characteristic locations on earth, enabled the introduction of the concept of flight level (FL). The flight level denotes an aircraft flying on some altitude above conventional MSL, expressed in feet. It is expressed with an abbreviated representation with the final two zeros truncated. For example FL330 means flight altitude of 33,000 ft (10 058.4 m). The flight levels are separated by a distance of 1,000 feet (304.8 m).
Each barometric altimeter of every aircraft is calibrated in an identical manner, in accordance with the model of standard atmosphere, cf. (A8)2, and must be preset (by legal obligation) for QNE reading above the country/location dependent transition altitude (6,000 ft (1,830 m) -FL60 in Poland, 1,500 m (~5,000 ft) – FL50 in Smoleńsk). The control of passenger air traffic involves assigning aircrafts specific flight levels (FL). Hence, globally all commercial aircrafts above transition level use a common reference level for determining their height of flight, by which passenger safety can be assured.
Barometric measurement of the flight altitude does not allow a direct determination of the flight height above ground surface/runway level of the airport. This is achievable from barometric altitude only when the local elevation profile of the earth surface is known. The elevation data of specific locations on earth can be obtained from numerical model of earth surface SRTM(8).
A2.2 Corrections of the readings of barometric altitude indications taking into account local meteorological conditions of pressure and temperature (p loc, T loc)
Take-off and landing manoeuvers require determination of the actual, physical flight height with high precision with respect to the relevant runway level to avoid collision with the ground. Conjecture on the static equilibrium of the atmospheric air is valid during prevailing time periods and in prevailing locations on earth except during extreme weather events or air turbulence. However, continuously varying in time local atmospheric conditions (p loc, T loc) at which the static equilibrium of atmospheric air is forming at various locations on earth usually differ considerably from those in the standard atmosphere model (pisa, Tisa), cf. (A5). The pressure and/or temperature may differ by as much as several dozen hectopascals, and several dozen degrees Celsius. This can significantly influence flight height assessment by measurement of atmospheric air pressure. Correct determination of flight height using barometric altimeter in the neighbourhood of a specific airport necessitates incorporating local weather conditions.
A2.2.1 Change of reference pressure p 0 → p 01; (T 0 = T 01)
All aircraft altimeters have the ability to preset reference pressure p 0 → p 01. The influence of the reference pressure on the readings of the altimeter can be evaluated using formulae, cf. (A7)3:
 $$\begin{equation}
p/{p_0} = {[1 - ({a_1}/{T_0}) \cdot ({h_{{p_0}}} - {h_0})]^{\,g/{r_a}\,{a_1}}},\quad p/{p_{01}} = {[1 - ({a_1}/{T_0}) \cdot ({h_{{p_{01}}}} - {h_0})]^{\,g/{r_a}\,{a_1}}},
\end{equation}$$
$$\begin{equation}
p/{p_0} = {[1 - ({a_1}/{T_0}) \cdot ({h_{{p_0}}} - {h_0})]^{\,g/{r_a}\,{a_1}}},\quad p/{p_{01}} = {[1 - ({a_1}/{T_0}) \cdot ({h_{{p_{01}}}} - {h_0})]^{\,g/{r_a}\,{a_1}}},
\end{equation}$$
p 01 denotes the new reference pressure setting and h 01p the changed reading of the barometric altimeter. Simple but laborious transformations give the following formula:
 $$\begin{equation}
{h_{{p_{01}}}} = {h_{{p_0}}} + \underbrace {({T_0}/{a_1}) \cdot [1 - {{({p_0}/{p_{01}})}^{{r_a}\,{a_{\,1}}/g}}]}_{{A_p} = {\rm{const}}} - {A_{ph}} \cdot {h_{{p_0}}};\quad {A_{ph}} \equiv 1 - {({p_0}/{p_{01}})^{{r_a}\,{a_{\,1}}/g}} = {\rm{const}}
\end{equation}$$
$$\begin{equation}
{h_{{p_{01}}}} = {h_{{p_0}}} + \underbrace {({T_0}/{a_1}) \cdot [1 - {{({p_0}/{p_{01}})}^{{r_a}\,{a_{\,1}}/g}}]}_{{A_p} = {\rm{const}}} - {A_{ph}} \cdot {h_{{p_0}}};\quad {A_{ph}} \equiv 1 - {({p_0}/{p_{01}})^{{r_a}\,{a_{\,1}}/g}} = {\rm{const}}
\end{equation}$$
Hence, the change of the reference pressure setting from p 0 → p 01 results in the shifting of the value of altitude by a constant term (Ap) depending on the ratio of the old and new reference pressures and the variable term linearly proportional to the value of the old reading of the altitude h p 0. In the majority of cases of reference pressure corrections, the term Aph · h p 0 can be neglected. For example, change of reference pressure by 20 hPa from ISA reference pressure gives the value of the coefficient  ${A_{ph}} \equiv 1 - {({p_0}/{p_{01}})^{\,{r_a}\,{a_{\,1}}/g}} = 1 - {({\textstyle{{993} \over {1013.25}}})^{{\rm{0}}{\rm{.190263}}}} = {\rm{0}}{\rm{.00383}}$ (~0.4%).
A2.2.2 Change of reference temperature T 0 → T 01; (p 0 = p 01)
The option of presetting reference temperature is not in a standard manner available in aircraft altimeters. In order to evaluate quantitatively the change in altitude readings caused by changing the setting of reference temperature T 0 → T 01, one can use formula (A7)3:
 $$\begin{equation}
p/{p_0} = {[1 - ({a_1}/{T_0}) \cdot ({h_{{T_0}}} - {h_0})]^{\,g/({r_a}\,{a_{\,1}})}},\quad p/{p_0} = {[1 - ({a_1}/{T_{01}}) \cdot ({h_{{T_{01}}}} - {h_0})]^{\,g/({r_a}\,{a_{\,1}})}},
\end{equation}$$
$$\begin{equation}
p/{p_0} = {[1 - ({a_1}/{T_0}) \cdot ({h_{{T_0}}} - {h_0})]^{\,g/({r_a}\,{a_{\,1}})}},\quad p/{p_0} = {[1 - ({a_1}/{T_{01}}) \cdot ({h_{{T_{01}}}} - {h_0})]^{\,g/({r_a}\,{a_{\,1}})}},
\end{equation}$$
T 01 denotes the new setting of reference temperature, and h T 01 changed altitude reading of the barometric altimeter. In the case of standard atmosphere h 0 = 0 simple transformations lead to the following formulae:
 $$\begin{equation}
{h_{\,{T_{01}}}} = {h_{\,{T_0}}} + {A_{\,T}} \cdot {h_{\,{T_0}}},\quad {A_{\,T}} \equiv ({T_{\,01}}/{T_{\,0}} - 1) = {\rm{const}};\quad {h_{\,{T_{01}}}} < {h_{\,{T_0}}}\quad {\rm{when}}\quad {T_{\,01}} < {T_{\,0}}.
\end{equation}$$
$$\begin{equation}
{h_{\,{T_{01}}}} = {h_{\,{T_0}}} + {A_{\,T}} \cdot {h_{\,{T_0}}},\quad {A_{\,T}} \equiv ({T_{\,01}}/{T_{\,0}} - 1) = {\rm{const}};\quad {h_{\,{T_{01}}}} < {h_{\,{T_0}}}\quad {\rm{when}}\quad {T_{\,01}} < {T_{\,0}}.
\end{equation}$$
Change of the reference temperature setting from T 0 → T 01 causes shifting of the value of altitude by a variable term proportional to the ratio of new and old reference temperature settings and linearly proportional to the value of old reading of the altitude h T 0, i.e. reading of the altitude for the old setting of the reference temperature. For example, change of the reference temperature from ISA reference temperature by 15K gives the value of the coefficient  ${A_T} \equiv 1 - ({T_0}/{T_{01}}) = 1 - ({\textstyle{{273.15} \over {288.15}}}) = $ 0.0521 (~5%).
It is worth pointing out that compensation of only reference pressure in the barometric altimeter of aircraft, e.g. readings of QFE, QNH, cf. e.g. Fig. A2, by not taking into account correction connected with the difference between actual local temperature and modelling ISA temperature in general leads to the presence of systematic error in flight altitude assessment, see also Table 2. Such processing is justified to the degree that the error connected with lack of temperature compensation decreases linearly with diminishing height of the aircraft approaching the level of the local runway and on this level it has zero value. Local temperature correction, on principle, cannot be neglected in the examination of the course of air accident. Taking into account temperature correction is necessary among others to be able meaningfully compare the barometric altitude readings with those obtained by other than barometric physical methods, e.g. radio altimeters readings.
A2.2.3 Change of reference pressure and temperature in accordance with local weather conditions
At the vast majority of commercial airports local meteorological conditions are measured by airport meteo services and transmitted to the pilot crews of taking off and landing aircrafts. If the local meteorological conditions of pressure and temperature at the runway level are known, then the following relations must be satisfied:
 $$\begin{equation}
p({h_{\,{\rm{loc}}}}) = {p_{\,{\rm{loc}}}},\quad T({h_{\,{\rm{loc}}}}) = {T_{\,{\rm{loc}}}},
\end{equation}$$
$$\begin{equation}
p({h_{\,{\rm{loc}}}}) = {p_{\,{\rm{loc}}}},\quad T({h_{\,{\rm{loc}}}}) = {T_{\,{\rm{loc}}}},
\end{equation}$$
where h loc denotes the elevation of the runway above MSL. Usually measurement of local values of pressure and temperature are collected at the airport meteo station, and then recalculated to the runway level. The best estimation of the actual aircraft height from the reading of on board barometric altimeter (hwskb), adjusted for local weather conditions, requires return to formula (A7). For the case considered in this subsection only, the change of the initial conditions is required. In place of reference conditions for standard atmosphere (1013.25 hPa, 288.15 K), those of the local pressure and temperature must be substituted p 0 = p loc, T 0 = T loc and h 0 = h loc. Then, simple transformations give:
 $$\begin{equation}
{h_{\,{\rm{cor}}}} = {h_{\,{\rm{loc}}}} + ({T_{\,{\rm{loc}}}}/{a_{\,1}}) \cdot [1 - {({p_{\,{\rm{bar}}}}/{p_{\,{\rm{loc}}}})^{\,{r_a}\,{a_{\,1}}/g}}],\quad T({h_{\,{\rm{cor}}}}) = {T_{\,{\rm{loc}}}} - {a_{\,1}} \cdot ({h_{\,{\rm{cor}}}} - {h_{\,{\rm{loc}}}})
\end{equation}$$
$$\begin{equation}
{h_{\,{\rm{cor}}}} = {h_{\,{\rm{loc}}}} + ({T_{\,{\rm{loc}}}}/{a_{\,1}}) \cdot [1 - {({p_{\,{\rm{bar}}}}/{p_{\,{\rm{loc}}}})^{\,{r_a}\,{a_{\,1}}/g}}],\quad T({h_{\,{\rm{cor}}}}) = {T_{\,{\rm{loc}}}} - {a_{\,1}} \cdot ({h_{\,{\rm{cor}}}} - {h_{\,{\rm{loc}}}})
\end{equation}$$
Local density of air at the runway level can be determined with ρloc = p loc/(raT loc). The symbol h cor denotes a flight altitude determined in consideration of local pressure and temperature values and designated by the code symbol QFF = h cor(p bar; p loc, T loc, h loc = 0), cf. also Fig. A2. The pressure p bar present in formula (A14) is measured continuously by the on board barometric altimeter. The value of this pressure can be recovered from the reading of the barometric altimeter hwskbar using the formulae (A8)1, where in place of the reference pressure p ref there must be substituted the relevant value of reference pressure setting, which was preset in the altimeter during the altitude measurement. For QNE altitude, this should be 1013.25 hPa, for QFE this should be local pressure on the runway level, and in the case of QNH altitude this should be local runway pressure reduced to the mean sea level.
 $$\begin{equation}
\begin{array}{@{}l@{}} {p_{wskb}} = {p_{{\rm{ref}}}} \cdot {[1 - {\rm{2}}.{\rm{25577}}{{\rm{e}}^{ - 5}} \cdot {h_{wskb}}]^{\;5.25588}},\quad \quad QNE \leftrightarrow {p_{{\rm{ref}}}} = 1013.25hPa,\\ QFE \leftrightarrow {p_{{\rm{ref}}}} = {p_{{\rm{loc}}}},\quad QNH \leftrightarrow {p_{{\rm{ref}}}} = {p_{QNH}} = {p_{{\rm{loc}}}}/{[1 - {\rm{2}}.{\rm{25577}}{{\rm{e}}^{ - 5}} \cdot {h_{{\rm{loc}}}}]^{\;5.25588}} \end{array}
\end{equation}$$
$$\begin{equation}
\begin{array}{@{}l@{}} {p_{wskb}} = {p_{{\rm{ref}}}} \cdot {[1 - {\rm{2}}.{\rm{25577}}{{\rm{e}}^{ - 5}} \cdot {h_{wskb}}]^{\;5.25588}},\quad \quad QNE \leftrightarrow {p_{{\rm{ref}}}} = 1013.25hPa,\\ QFE \leftrightarrow {p_{{\rm{ref}}}} = {p_{{\rm{loc}}}},\quad QNH \leftrightarrow {p_{{\rm{ref}}}} = {p_{QNH}} = {p_{{\rm{loc}}}}/{[1 - {\rm{2}}.{\rm{25577}}{{\rm{e}}^{ - 5}} \cdot {h_{{\rm{loc}}}}]^{\;5.25588}} \end{array}
\end{equation}$$
In order to obtain the height of flight of the aircraft above the ground surface from the height h cor cf. (A14), the elevation of ground surface h gr must be deducted expressed in meters over MSL. Only the relative height being the difference between barometric altitude QFF and the elevation of ground surface (h cor − h gr) can be in a methodologically correct manner compared with the difference between the radio altimeter reading and the elevation of the ground surface (h rw − h gr).
When all the theoretical modelling conjectures underlying the barometric and the radio heights measurements are satisfied, the differences (h cor − hgr) and (hrw − hgr) should have the same value. Deviations can appear due to inaccuracies of pressure sensors (barometric measurement) or/and inaccuracies in circuits of the system of run time determination of the radio wave travel (radio measurement), or if assumptions of the standard atmosphere model are not satisfied due to e.g. stormy local weather conditions.
ACKNOWLEDGEMENTS
Opinions and conclusions formulated in the present work are entirely of its authors. They were elaborated in accordance with the best knowledge of the authors and cannot be directly or indirectly attributed to any other person or party. We wish to thank Hanna Zembrzuska for careful English language proofreading and valuable suggestions, which considerably helped in preparing the final version of the manuscript.