NOMENCLATURE
- a max
maximum opening shock (msec−2)
- A
fabric cost coefficient ($m−2)
- AR
aspect ratio
- b cell
cell width
- b Slider
slider span
- B
lines cost coefficient ($m−1)
- c
canopy chord (m)
- C DC
canopy drag coefficient
- C LC
canopy lift coefficient
- CT
total aerodynamic coefficient
- Cmα
pitching moment derivative with respect to angle of attack (rad−1)
- Cm
pitching moment coefficient
- CX
shock factor
- d Lines
lines diameter (m)
- GR
glide ratio
- J
objective function
 $\bar{q}$
dynamic pressure
- R Lines
suspension lines average length (m)
- K
canopy spreading rate
- (t/c)max
thickness ratio
- n Lines
nNumber of lines
- n Cell
cell count
- L Suspension Lines
total length of suspension lines
- Rcell
cell radius
- Scell
cell curvature
- SSlider
slider area
- S Total Area
canopy wetted area (m2)
- SC
canopy projected area (m2)
- VT
total velocity (ms−1)
- VV
landing velocity (ms−1)
- XP
horizontal distance of reference point from confluence point (m)
- ZP
vertical distance of reference point from confluence point (m)
- α
angle of attack
- β
anhedral angle (deg)
- ε
canopy central angle (deg)
- ρ()
density of materials
- σ()
strength of Materials
- μ
rigging angle (deg)
- θ
specific path angle during inflation measured from vertical axis of geographic system
- ψ
constant: 1/5
- ΣSlider
slider drag area

1.0 INTRODUCTION
Recently, the gliding parachutes and especially the parafoil platforms have been used extensively in guided precision aerial delivery systemsFootnote 1. Low-offset and high-operational reliability in payload delivery to a desired impact point, together with large standoff distance make them a desirable platform for this application. The parafoil was patented initially by Domina Jalbert in 1966(Reference Jalbert1). Creating this gliding platform was a motivation for planning several cargo delivery programs. Therefore, numerous experimental and theoretical studies were carried out in conjunction with development of precision aerial delivery systems. To develop precision cargo delivery systems by means of such a platform, several experimental investigations consisting of wind-tunnel and free-flight tests were conducted by the University of Notre Dame(Reference Nathe, Knapp and Hall2-Reference Nicolaides and Greco4), NASA(Reference Speelman5,Reference Burk and Ware6) , and thereafter by the U.S. Air Force(Reference Ware and Hassell7) between 1960s and 1970s. Related studies were continued to 1980s when extended semi-numerical studies about parafoil aerodynamics, performance, and stability were reported by Lingard(Reference Lingard8,Reference Lingard9) and results were summarised in another report in 1995(Reference Lingard10), as a salient reference for gliding parachute design. The investigations on parafoil platforms followed by experimental and theoretical studies, which addressed different fields such as aerodynamics, performance and stability, modelling and simulation and so on to establish design criteria for a gliding parachute platform in each field. In conjunction with the aerodynamics of parafoils as a primary research area, some computational studies were undertaken(Reference Ross11-Reference Fogell and Iannucci15). In order to simulate the parafoil and payload individual and relative response, some models with 6DOF(Reference Slegers, Beyer and Castello16), 7DOF(Reference Gorman and Slegers17), 8DOF(Reference Slegers18) and 9DOF(Reference Gang19) were presented. Theoretical studies were carried out to investigate the performance of gliding parachutes(Reference Goodrick20-Reference Prakash and Ananthkrishnan22). In addition, several studies on the longitudinal and lateral stability characteristics of gliding parachutes performed in which the effects of varying significant design parameters on the static or dynamic stability were investigated(Reference Crimi23-Reference Yang, Song and Chen26).
Nowadays, there are many canopies, basically designed for personnel applications. These platforms can be used based on allowable wing loading and design limits for light-cargo delivery, but the design factor, particularly for an affordable cargo parachute, differs from the others. This is due to different degradation factors, which affect the parachute lifetime. Indeed, an affordable cargo parachute is designed with a design factor near 3, which is lower than manned applications. Therefore, as a baseline platform, a light payload canopy such as personnel canopy should be redesigned for cargo airdrop application. Until the present day, among researches carried out on gliding parachutes, there is not a unified design procedure or an efficient design cycle for the gliding parachute platform design. In other words, the design scope suffered from the lack of a scheduled framework and most of the literatures deal only with disciplinary analysis. Accordingly, a main purpose of this paper is to obtain a framework for optimisation of baseline gliding parachute as a cargo delivery platform, which can save the unit cost of the platform for demanded glide ratio. To do so, motivated by previous work related to the gliding parachute configuration design with a single objective cost minimisation approach(Reference Nosratollahi and Ghapanvary27), a novel algorithm for gliding parachute design cycle is proposed which tries to minimise the drag-to-lift ratio as a measure of merit for gliding capability and the unit cost at the same time. Obviously, the solution of the design problem should be found in a pareto-optimal set which necessitates employing the multi-objective design optimisation approach.
2.0 GLIDING PARACHUTE CONFIGURATION DESCRIPTION
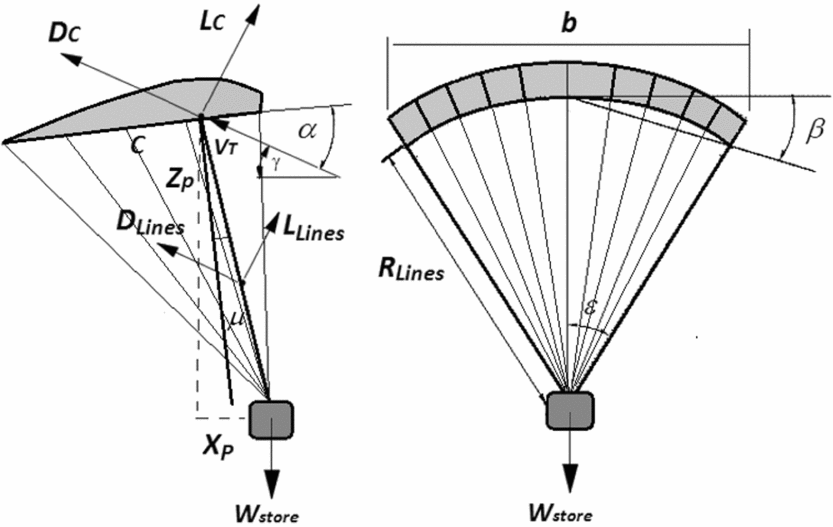
Parafoil (combination of parachute and aerofoil) is a kind of low-aspect-ratio ram-air parachute, which is made entirely from low-porosity nylon. There are several ribs, top skins (extrados) and bottom skins (intrados) which form numerous cells with an aerofoil section. Cells cause to this fabric structure to have a semi-rigid shape. The leading edge is open to permit inflating cells by the ram air and so dynamic pressure is responsible for stiffening this fabric wing. Figure 1 shows a schematic of a gliding parachute platform and significant design parameters. The main component of a gliding parachute is its canopy, which plays the most important role in gliding and recovery operation of the payload to the desired point of impact. Another part of the parafoil is the suspension lines, which attach the canopy to the payload. Hence, the main purpose in the parachute design summarised to optimise its canopy and suspension lines. Herein, the payload specifications are fixed as a design parameter.

Figure 1. Gliding parachute configuration. (Right): Front view; (Left): Side view.
3.0 DESIGN APPROACH AND REQUIREMENTS
Like an aircraft, a concept for a gliding parachute is determined by the requirements for defined functional and performance characteristics, which specifies the system initial configuration. The basic requirements for designing a gliding parachute platform for cargo delivery application may be found as follows(Reference Lingard10,Reference Ewing, Bixby and Knacke28) :
• Maximum operational deployment altitude (about 35000 ft (about 10 km))
• Maximum operational deployment speed (up to 150 KIAS (80 m/sec))
• Payload capacity
• Desirable offset range correspond to demanded glide ratio in absence of wind, namely above 2
• Wind penetration capability
• Soft landing at SL (based on allowable landing shock)
• Allowable shock tolerated by parachute components and the payload (in practice from 5 g to 10 g)
• Stable performance
• Cost (amount of material for fabrication)
The above design requirements can be expressed in terms of performance characteristics such as landing velocity and wind penetration. The offset range defines the operational glide ratio for a target wing loading. In addition, the deployment altitude and velocity together with reefing technique determine the maximum shock that is applied to the sustained payload during inflation. Since, the slider reefing technique is adopted as a common reefing strategy for gliding parachutes, the inflation process and associated loads can be controlled from deployment stage to full extension of the canopy.
Based on different design requirements, multi-objective and multi-disciplinary approaches that consider different aspects in design scope, can be applied. In this respect, when a unique aspect of the gliding parachute, such as the glide ratio or unit cost, is important for the designer, a single objective approach can facilitate the design problem to reach the desired platform. As mentioned at first, this approach was adopted in earlier work(Reference Nosratollahi and Ghapanvary27) in which the unit cost was minimised for a demanded glide ratio and material specification was taken same as the baseline design. In case of a multi-criteria design approach, more than one objective such as glide ratio and cost, are bolded so that a multi-objective optimisation approach can handle the design problem. In this paper, a novel algorithm for the design of the gliding parachute is proposed using following steps:
0- Determine important design requirements
1- Characterise the parachute configuration using an initial guess for set of decision variables
2- Simulate the inflation process to obtain critical loads applied to the parachute components and the payload
3- Select the proper materials for parachute canopy and suspension lines among candidate materials
4- Estimate the mass specifications for overall configuration
5- Approximate the aerodynamic characteristics for 3D wing with arc anhedral and suspension lines
6- Calculate the landing velocity and the relevant stability derivatives
7- Evaluate the objective function(s) and constraint(s) based on design targets
8- Minimise the objective function(s) with respect to decision vector in feasible region
These steps are illustrated in Fig. 2.
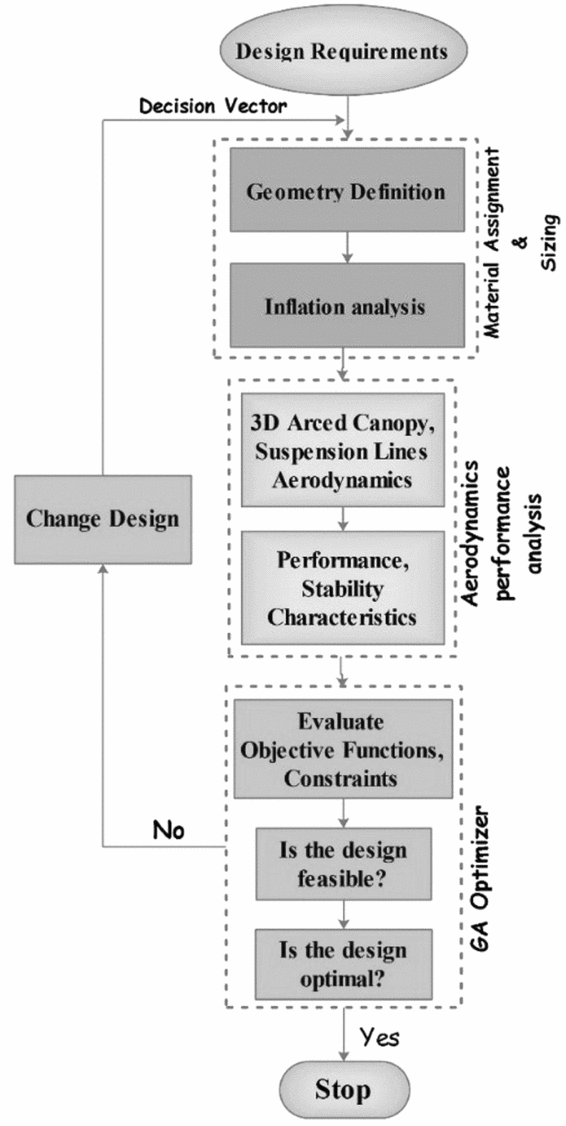
Figure 2. Novel design cycle for gliding parachute configuration design.
The planned design cycle is handled through an optimisation problem using an all-at-onceFootnote 2 approach in which all of the design variables will be determined by GA optimiser. In the following, each block box in the design cycle is described to clarify the design approach.
4.0 MODELLING THE GLIDING PARACHUTE
4.1. Mass and geometric calculations
In order to characterise the gliding parachute configuration, some parameters are adopted to describe its general architecture. Due to the ease of fabrication, like many common gliding parachutes, a rectangular planform for the parachute is assumed(Reference Lingard10). Such a conventional gliding parachute can be characterised by some design parameters such as aspect ratio, surface area, anhedral angle, rigging angle and cell dimensions. For a rectangular planform, the geometric design parameters are surface area and aspect ratio, which are related by:
 $$\begin{equation}
\begin{array}{@{}l@{}} AR = \displaystyle\frac{{{b^2}}}{{{S_C}}} = \frac{b}{c}\\[8pt] {S_C} = AR{c^2} \end{array}
\end{equation}$$
$$\begin{equation}
\begin{array}{@{}l@{}} AR = \displaystyle\frac{{{b^2}}}{{{S_C}}} = \frac{b}{c}\\[8pt] {S_C} = AR{c^2} \end{array}
\end{equation}$$
Also, the position of payload is defined in terms of parachute average line length and rigging angle as:
 $$\begin{equation}
\begin{array}{@{}l@{}} {X_p} = {R_{{\rm{Lines}}}}\;{\rm{sin}}\;\mu \\ {Z_p} = {R_{{\rm{Lines}}}}\;{\rm{cos}}\;\mu \end{array}
\end{equation}$$
$$\begin{equation}
\begin{array}{@{}l@{}} {X_p} = {R_{{\rm{Lines}}}}\;{\rm{sin}}\;\mu \\ {Z_p} = {R_{{\rm{Lines}}}}\;{\rm{cos}}\;\mu \end{array}
\end{equation}$$
The anhedral angle of the canopy, which plays an important role in the lift of the parachute, is defined by:
 $$\begin{equation}
\beta = \frac{b}{{4{R_{{\rm{Line}}}}}}
\end{equation}$$
$$\begin{equation}
\beta = \frac{b}{{4{R_{{\rm{Line}}}}}}
\end{equation}$$
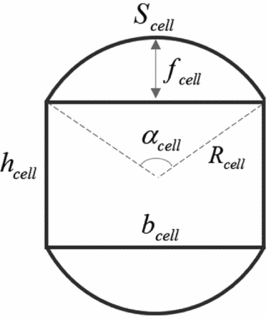
It is noted that decreasing the line length decreases the line drag and increases the anhedral angle and so reduces the lift of the canopy. Also, as the anhedral angle decreases, the canopy planform area decreases as well. Therefore, a compromise should be made between the anhedral angle and the lift of the canopy. In order to produce a smooth canopy with the least amount of reduction in the designed span, it is desired to reduce cell billowing as much as possible. As a conventional technique, the amount of cell bulge can be controlled by increasing the number of full unloaded ribs. The number of cells is determined by the amount of cell bulge so that the large number of cells produce lesser cell bulge. Evidently, the amount of fabrics for cells limits the number of ribs. The geometry of a cell billowing is shown in Fig. 3.

Figure 3. Cell bulge geometry.
As illustrated in Fig. 3, the cell bulge can be calculated using following relationships:
 $$\begin{equation}
\begin{array}{@{}l@{}} \tan \displaystyle\frac{{{\alpha _{{\rm{cell}}}}}}{2} = \displaystyle\frac{{{b_{{\rm{cell}}}}}}{{{h_{{\rm{cell}}}}}},\quad \frac{{{S_{{\rm{cell}}}}}}{{{b_{{\rm{cell}}}}}} = \displaystyle\frac{{{\alpha _{{\rm{cell}}}}}}{{2\;{\rm{sin}}\frac{{{\alpha _{{\rm{cell}}}}}}{2}}}\\[8pt] {f_{{\rm{cell}}}} = {R_{{\rm{cell}}}}\left( {1 - {\rm{cos}}\frac{{{\alpha _{{\rm{cell}}}}}}{2}} \right),\quad {b_{{\rm{cell}}}} = \frac{{2{R_{{\rm{Line}}}}\varepsilon }}{{{n_{{\rm{cell}}}}}} \end{array}
\end{equation}$$
$$\begin{equation}
\begin{array}{@{}l@{}} \tan \displaystyle\frac{{{\alpha _{{\rm{cell}}}}}}{2} = \displaystyle\frac{{{b_{{\rm{cell}}}}}}{{{h_{{\rm{cell}}}}}},\quad \frac{{{S_{{\rm{cell}}}}}}{{{b_{{\rm{cell}}}}}} = \displaystyle\frac{{{\alpha _{{\rm{cell}}}}}}{{2\;{\rm{sin}}\frac{{{\alpha _{{\rm{cell}}}}}}{2}}}\\[8pt] {f_{{\rm{cell}}}} = {R_{{\rm{cell}}}}\left( {1 - {\rm{cos}}\frac{{{\alpha _{{\rm{cell}}}}}}{2}} \right),\quad {b_{{\rm{cell}}}} = \frac{{2{R_{{\rm{Line}}}}\varepsilon }}{{{n_{{\rm{cell}}}}}} \end{array}
\end{equation}$$
The value of cell billowing is used to determine the required span that obtains the designed parachute span. The weight of the parachute can be determined using the required materials and respective densities. Therefore, it can be written as:
 $$\begin{equation}
{m_{{\rm{parachute}}}} \simeq {\rho _{{\rm{fabric}}}}{S_{{\rm{Total}}\;{\rm{Area}}}} + {\rho _{{\rm{Lines}}}}{L_{{\rm{Suspension}}\;{\rm{Lines}}}}
\end{equation}$$
$$\begin{equation}
{m_{{\rm{parachute}}}} \simeq {\rho _{{\rm{fabric}}}}{S_{{\rm{Total}}\;{\rm{Area}}}} + {\rho _{{\rm{Lines}}}}{L_{{\rm{Suspension}}\;{\rm{Lines}}}}
\end{equation}$$
The mass and cost of risers, connectors, deployment bag and auxiliary hardware are neglected. The wetted area of the fabrics and the overall length of the suspension lines are calculated using a rigging planner code implemented in Matlab. The inputs to the code are geometrical specifications of the canopy such as chord, aspect ratio, cell count, rigging angle, anhedral angle and so on. Also, the outputs of the code will be the overall fabric area and suspension lines, overall mass of the platform, the cost of required material and finally a 3D view of the platform. The schematic of the parachute gives a physical insight to the optimised configuration.
4.2. Structural consideration and material selection
The choice of materials for the canopy cloth and suspension lines depends on the required strength, especially to bear the inflation loads. This is because the maximum force acting on canopy occurs during inflation phase, whereas the parachute's surface area becomes the greatest during the slider descent phase(Reference Poynter29). Depending on the slider reefing and inflation sequence, the inflation force and subsequent shock experienced by the payload can be alleviated to some extent. Since the gliding flight begins after the full extension of the canopy, it can be assumed that the canopy was significantly affected by the axial force during inflation. To make a rough estimate of the inflation force, the approach expressed in(Reference Potvin, Brocato and Peek30) is adopted:
 $$\begin{equation}
{F_{{\rm{inflatio}}{{\rm{n}}_{{\rm{max}}}}}} = \bar{q}S{C_D}{C_X},
\end{equation}$$
$$\begin{equation}
{F_{{\rm{inflatio}}{{\rm{n}}_{{\rm{max}}}}}} = \bar{q}S{C_D}{C_X},
\end{equation}$$
in which the parameter CX is the shock factor, which can be estimated using maximum occurring inflation force during inflation(Reference Potvin31). Therefore, the shock factor is:
 $$\begin{equation}
{C_X} = \frac{{2{F_{{\rm{max}}}}}}{{\rho V_{LS}^2{{(S{C_D})}_{SD}}}}
\end{equation}$$
$$\begin{equation}
{C_X} = \frac{{2{F_{{\rm{max}}}}}}{{\rho V_{LS}^2{{(S{C_D})}_{SD}}}}
\end{equation}$$
The drag area of the parachute is time varying which make the estimation of the inflation force difficult. To solve this problem, a semi-numerical approach proposed by Lingard is used, in which a 2D point mass model describes the inflation phase as follows(Reference Lingard10):
 $$\begin{equation}
\begin{array}{@{}l@{}} {{\dot{V}}_T} = g\;{\rm{cos}}\theta - \frac{1}{{2{m_S}}}{\rho _{{\rm{air}}}}V_T^2{C_d}{S_C}(t)\\ \dot{\theta } = - \frac{g}{{{V_T}}}{\rm{sin}}\theta \\ {a_{{\rm{max}}}} = {\rm{max}}(\left| {{{\dot{V}}_T}} \right|) \end{array}
\end{equation}$$
$$\begin{equation}
\begin{array}{@{}l@{}} {{\dot{V}}_T} = g\;{\rm{cos}}\theta - \frac{1}{{2{m_S}}}{\rho _{{\rm{air}}}}V_T^2{C_d}{S_C}(t)\\ \dot{\theta } = - \frac{g}{{{V_T}}}{\rm{sin}}\theta \\ {a_{{\rm{max}}}} = {\rm{max}}(\left| {{{\dot{V}}_T}} \right|) \end{array}
\end{equation}$$
The force coefficient of a parachute may be given as a function of time during inflation, where the inflation time is proposed by:
 $$\begin{equation}
{t_{{\rm{inflation}}}} = \frac{n_{\scriptsize\textrm{fill}}{D_C}}{{{V_{{\rm{Snatch}}\,{\rm{velocity}}}}}}
\end{equation}$$
$$\begin{equation}
{t_{{\rm{inflation}}}} = \frac{n_{\scriptsize\textrm{fill}}{D_C}}{{{V_{{\rm{Snatch}}\,{\rm{velocity}}}}}}
\end{equation}$$
For a slider-reefed parafoil, the value of filling time parameter nfill is proposed to be 14 by Lingard. However, from canopy to canopy, this value varies due to different geometries. Thus, adopting a constant inflation parameter for all ram air parachutes is not reasonable. On the other hand, attributing the ram air parachutes with a constructed span as a circular canopy is not acceptable. Consequently, the drag area increasing model with time is changed as follows:
 $$\begin{equation}
\frac{{{d^2}{S_C}{C_D}_{_C}}}{{d{t^2}}} = KV_T^2,
\end{equation}$$
$$\begin{equation}
\frac{{{d^2}{S_C}{C_D}_{_C}}}{{d{t^2}}} = KV_T^2,
\end{equation}$$
in which K is the canopy-spreading rate constant and can be calculated using this expression(Reference Potvin, Brocato and Peek30):
 $$\begin{equation}
K = \psi \frac{{bc}}{{(\rho {b^3} + {m_c}){R_{{\rm{Line}}}}{b_{{\rm{slider}}}}}}\rho \left( {{\Sigma _{{\rm{slider}}}} + {\Sigma _{{\rm{extra}}}}} \right)\left( {\frac{b}{{{b_{{\rm{slider}}}} + \sqrt {{\Sigma _{{\rm{extra}}}}} }}} \right)\Delta
\end{equation}$$
$$\begin{equation}
K = \psi \frac{{bc}}{{(\rho {b^3} + {m_c}){R_{{\rm{Line}}}}{b_{{\rm{slider}}}}}}\rho \left( {{\Sigma _{{\rm{slider}}}} + {\Sigma _{{\rm{extra}}}}} \right)\left( {\frac{b}{{{b_{{\rm{slider}}}} + \sqrt {{\Sigma _{{\rm{extra}}}}} }}} \right)\Delta
\end{equation}$$
Now, to evaluate the fidelity level of the inflation model, the model is applied to ram air parachute “sabre 150” with a slider area of 0.3 m2 and canopy-spreading rate, K, of 0.02. The comparative results are shown in Fig. 4.
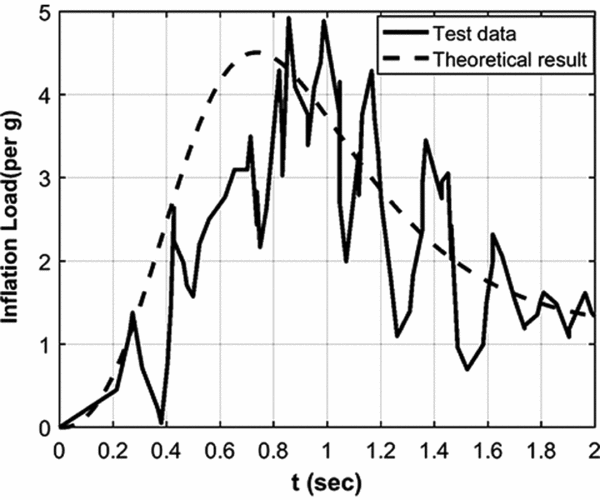
Figure 4. Inflation load estimation per g vs time for Sabre150 with 205 lb (93 kg) of payload, deployment speed 145 ft/s (44 m/s), altitude 4000 ft (1220 m).
Based on the results, there is a small error of 8.5% between the theoretical and experimental data for inflation load and a 12% error in the prediction of filling time. This implies an acceptable estimation for the model. Thus, the required strength of the suspension lines will be:
 $$\begin{equation}
{F_{{\rm{Lines}}}} = D.F\frac{{{F_{{\rm{inflatio}}{{\rm{n}}_{{\rm{max}}}}}}}}{{{n_{{\rm{Lines}}}}}}
\end{equation}$$
$$\begin{equation}
{F_{{\rm{Lines}}}} = D.F\frac{{{F_{{\rm{inflatio}}{{\rm{n}}_{{\rm{max}}}}}}}}{{{n_{{\rm{Lines}}}}}}
\end{equation}$$
Usually, the design factor of 3 is proposed for cargo delivery platforms although for personnel application the design factor is higher than this value(Reference Ewing, Bixby and Knacke28). It can increase even above 10 depending on the margin of safety and the parachute viability during its lifetime. For the cargo delivery applications, the component-critical loads should be determined in order to assign the materials. In the conceptual design phase, the critical load across the canopy fabric can be estimated using a simplified model based on membrane theory. In addition, the hoop tension may be written as(Reference Ewing, Bixby and Knacke28):
 $$\begin{equation}
{{\sigma }_{{\rm Fabric}}} = \frac{{{{F}_{{\rm Fabric}}}}}{{\rm L}} = {{\rm C}_{\rm X}}{(\bar{q}r)_{{\rm max}}}
\end{equation}$$
$$\begin{equation}
{{\sigma }_{{\rm Fabric}}} = \frac{{{{F}_{{\rm Fabric}}}}}{{\rm L}} = {{\rm C}_{\rm X}}{(\bar{q}r)_{{\rm max}}}
\end{equation}$$
The term  ${(\bar{q}r)_{{\rm{max}}}}$ stands for maximum dynamic pressure multiplied by fabric radius of curvature. Therefore, the hoop tension during inflation phase is calculated for the canopy using average length of suspension lines. By the inflation criterion, the design algorithm tries to minimise the inflation force by a suitable reefing schedule. Indeed, the lower inflation force means lower required strength for materials in a cargo delivery operation. This criterion for material selection is validated for three conventional ram-air parachutes as shown in Table 1.
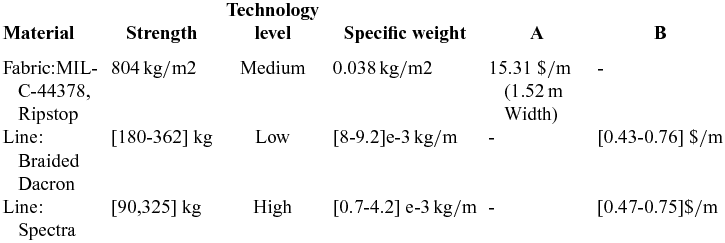
Table 1 Comparison of assigned and estimated material strength of conventional gliding parachutes(32-34)
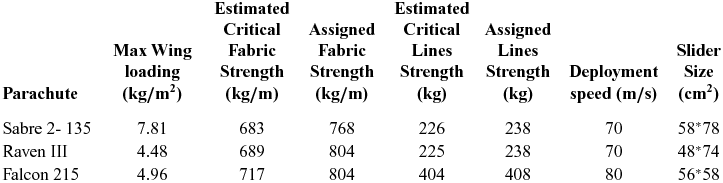
Compared to the operational platforms, the criterion for material selection and related estimated strength for fabric and suspension lines for the ram air parachutes are confirmed with a reasonable accuracy and so this approach is verified. For horizontal airdrops from conventional cargo aircraft such as C-130 and C-17, the releasing speed is about 150 KIAS. Conventional canopies made of low-porosity fabrics like F111, PIA-44378 can be deployed in this speed range with the slider reefing technique. These fabrics have the same strength of 45 lb/in (804 kg/m) and air permeability from 0 to 3 which makes them to be well suited for ram air parachutes application. According to the canopy specifications in Table 1, the available low-porosity fabrics can be used for light cargo delivery in a release speed up to 150 KIAS by reefing the canopy. Albeit, the architectural design and the structural reinforcing of the high-stress concentration regions of can be performed in preliminary design phase under a fluid-structural interaction simulation(Reference Kalro and Tezduyar35,Reference Altmann36) . Based on experience, the designer can assign the available low technology or advance materials to the parachute configuration to minimise the cost or amount of material and satisfy the structural constraints as well. Surely, the overall weight and bulk volume of the parachute should be kept as small as possible by reduction of the amount of materials, which in turn leads to a low-cost parachute platform. However, in the case of traditional low-cost material, the parachute mass may increase due to its lower strength-to-weight ratio. Thus, to prevent the overweighting of the parachute, the canopy mass is limited to less than 4% of the sustained payload mass. The structural consideration discussed herein imports some constraints to the underlying design problem, which is stated in the next chapter in form of a general MDO problem. The number of lines is determined using a criteria proposed in(Reference Peyada, Singhal and Ghosh37). However, this criterion is reformulated for the case of light-payload parachutes with loaded ribs at four chordwise anchor points and unloaded mid-ribs. This formula reflects the fact of increasing the number of suspension lines by increasing the aspect ratio.
 $$\begin{equation}
\begin{array}{@{}l@{}} {n_{{\rm{lines}}}} = 4.\left( {[2 + 4AR] - 1} \right)\\[8pt] {n_{{\rm{cell}}}} = 2.\left[ {\displaystyle\frac{{{n_{{\rm{Lines}}}}}}{4} - 3} \right] \end{array}
\end{equation}$$
$$\begin{equation}
\begin{array}{@{}l@{}} {n_{{\rm{lines}}}} = 4.\left( {[2 + 4AR] - 1} \right)\\[8pt] {n_{{\rm{cell}}}} = 2.\left[ {\displaystyle\frac{{{n_{{\rm{Lines}}}}}}{4} - 3} \right] \end{array}
\end{equation}$$
4.3. Aerodynamics analysis
The most important characteristic of a gliding parachute is its overall glide ratio, which can be fixed by required stand-off distance and wind-penetration capability. Based on computational studies on the 3D configuration of a gliding parachute, it is clear that obtaining the aerodynamic characteristics of the overall parachute configuration under a complicated computational analysis is more time consuming during a configuration design(Reference Ross11-Reference Fogell and Iannucci15). In other words, incorporating a conceptual design loop with a software with computational burden may not be reasonable. This necessitates approximating the parafoil aerodynamics via analytical or semi-numerical approaches in this phase. Based on the simplification in modelling, the degree of fidelity can decrease but this can be compensated by a lower computational cost. Generally, the lift-and-drag coefficients for the overall configuration of a gliding parachute may be written as:
 $$\begin{equation}
\begin{array}{@{}l@{}} {C_D} = {C_{{D_P}}} + \displaystyle\frac{{{S_{{\rm{store}}}}}}{{{S_C}}}{C_{{D_{{\rm{store}}}}}}\\[8pt] {C_L} = {C_{{L_P}}} + \displaystyle\frac{{{S_{{\rm{store}}}}}}{{{S_C}}}{C_{{L_{{\rm{store}}}}}}\\[8pt] L = W\;{\rm{cos}}\;\gamma ,\;D = W\;{\rm{sin}}\;\gamma \Rightarrow {S_C} = \displaystyle\frac{{{W_{{\rm{overall}}}}}}{{\bar{q}{C_T}}},\;{C_T} = {(C_L^2 + C_D^2)^{\frac{1}{2}}} \end{array}
\end{equation}$$
$$\begin{equation}
\begin{array}{@{}l@{}} {C_D} = {C_{{D_P}}} + \displaystyle\frac{{{S_{{\rm{store}}}}}}{{{S_C}}}{C_{{D_{{\rm{store}}}}}}\\[8pt] {C_L} = {C_{{L_P}}} + \displaystyle\frac{{{S_{{\rm{store}}}}}}{{{S_C}}}{C_{{L_{{\rm{store}}}}}}\\[8pt] L = W\;{\rm{cos}}\;\gamma ,\;D = W\;{\rm{sin}}\;\gamma \Rightarrow {S_C} = \displaystyle\frac{{{W_{{\rm{overall}}}}}}{{\bar{q}{C_T}}},\;{C_T} = {(C_L^2 + C_D^2)^{\frac{1}{2}}} \end{array}
\end{equation}$$
The lift-and-drag coefficients for canopy are approximated by following relations(Reference Lingard10):
 $$\begin{equation}
{C_{{D_P}}} = {C_{{D_0}}} + \frac{{{C_{{L_C}}}^2}}{{\pi eAR}}{\left(\alpha \;{\rm{cos}}\left( {\frac{\varepsilon }{2}} \right) - {\alpha _{ZL}}\right)^2} + {K_1}\;{\rm{si}}{{\rm{n}}^3}(\alpha - {\alpha _{ZL}}) + \frac{{{n_{{\rm{Lines}}}}{R_{{\rm{Lines}}}}{d_{{\rm{Lines}}}}\;{\rm{co}}{{\rm{s}}^3}(\alpha )}}{{{S_C}}}
\end{equation}$$
$$\begin{equation}
{C_{{D_P}}} = {C_{{D_0}}} + \frac{{{C_{{L_C}}}^2}}{{\pi eAR}}{\left(\alpha \;{\rm{cos}}\left( {\frac{\varepsilon }{2}} \right) - {\alpha _{ZL}}\right)^2} + {K_1}\;{\rm{si}}{{\rm{n}}^3}(\alpha - {\alpha _{ZL}}) + \frac{{{n_{{\rm{Lines}}}}{R_{{\rm{Lines}}}}{d_{{\rm{Lines}}}}\;{\rm{co}}{{\rm{s}}^3}(\alpha )}}{{{S_C}}}
\end{equation}$$
 $$\begin{equation}
\begin{array}{@{}l@{}} {C_{{L_P}}} = a(\alpha - {\alpha _{ZL}}){\rm{co}}{{\rm{s}}^2}\left( {\displaystyle\frac{\varepsilon }{2}} \right) + {K_1}{\rm{si}}{{\rm{n}}^2}(\alpha - {\alpha _{ZL}}){\rm{cos}}(\alpha - {\alpha _{ZL}})\\[6pt] \qquad\quad+\, \displaystyle\frac{{{n_{{\rm{Lines}}}}{R_{{\rm{Lines}}}}{d_{{\rm{Lines}}}}\;{\rm{co}}{{\rm{s}}^2}(\alpha ){\rm{sin}}(\alpha )}}{{{S_C}}}\\[7pt] {K_1} = \left\{ {\begin{array}{@{}*{2}{c}@{}} {3.33 - 1.33AR}&{1 \le AR \le 2.5}\\[5pt] 0&{AR > 2.5} \end{array}} \right. \end{array}
\end{equation}$$
$$\begin{equation}
\begin{array}{@{}l@{}} {C_{{L_P}}} = a(\alpha - {\alpha _{ZL}}){\rm{co}}{{\rm{s}}^2}\left( {\displaystyle\frac{\varepsilon }{2}} \right) + {K_1}{\rm{si}}{{\rm{n}}^2}(\alpha - {\alpha _{ZL}}){\rm{cos}}(\alpha - {\alpha _{ZL}})\\[6pt] \qquad\quad+\, \displaystyle\frac{{{n_{{\rm{Lines}}}}{R_{{\rm{Lines}}}}{d_{{\rm{Lines}}}}\;{\rm{co}}{{\rm{s}}^2}(\alpha ){\rm{sin}}(\alpha )}}{{{S_C}}}\\[7pt] {K_1} = \left\{ {\begin{array}{@{}*{2}{c}@{}} {3.33 - 1.33AR}&{1 \le AR \le 2.5}\\[5pt] 0&{AR > 2.5} \end{array}} \right. \end{array}
\end{equation}$$
The canopy drag is comprised of zero lift drag, induced drag and drag of suspension lines. The 2D aerodynamic characteristics are emanated from an extended numerical code based on panel method for parachute section. The trim AOA is calculated by equalizing the pitching moment of the parachute about its confluence point to zero and so constrains the design problem as well. Thus, it will be:
 $$\begin{eqnarray}
{C_{{m_{{\rm{Confluence}}}}}} &=& {C_{{m_{c/4}}}} + \frac{{{R_{{\rm{Lines}}}}}}{c}[{C_{{D_C}}}\;{\rm{cos}}(\alpha + \mu ) - {C_{{L_C}}}\;{\rm{sin}}(\alpha + \mu )]\nonumber\\
&& +\, \frac{{{n_{{\rm{Lines}}}}R_{{\rm{Lines}}}^2{d_{{\rm{Lines}}}}}}{{2{S_C}c}}[{\rm{co}}{{\rm{s}}^4}(\alpha + \mu ) - {\rm{si}}{{\rm{n}}^2}(\alpha + \mu ){\rm{co}}{{\rm{s}}^2}(\alpha + \mu )]
\end{eqnarray}$$
$$\begin{eqnarray}
{C_{{m_{{\rm{Confluence}}}}}} &=& {C_{{m_{c/4}}}} + \frac{{{R_{{\rm{Lines}}}}}}{c}[{C_{{D_C}}}\;{\rm{cos}}(\alpha + \mu ) - {C_{{L_C}}}\;{\rm{sin}}(\alpha + \mu )]\nonumber\\
&& +\, \frac{{{n_{{\rm{Lines}}}}R_{{\rm{Lines}}}^2{d_{{\rm{Lines}}}}}}{{2{S_C}c}}[{\rm{co}}{{\rm{s}}^4}(\alpha + \mu ) - {\rm{si}}{{\rm{n}}^2}(\alpha + \mu ){\rm{co}}{{\rm{s}}^2}(\alpha + \mu )]
\end{eqnarray}$$
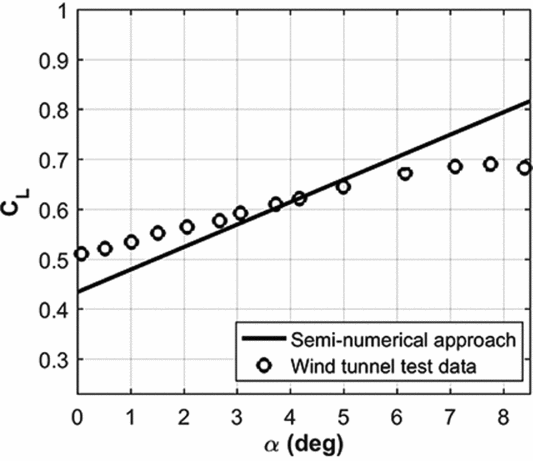
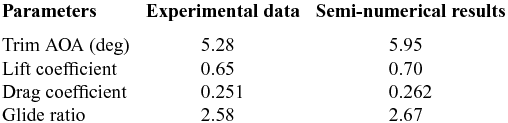
In order to validate the aerodynamic model, a parafoil model tested by NASA is used. The specifications of the model are given in Table 2. The comparison between the semi-numerical and test data are shown in Figs 5 and 6. In addition, the resulting aerodynamic characteristics for the models are given in Table 3. Based on the results, using the trim equation, the model trim AOA equals to 5.9° with an error of 12% with respect to the real trim point. At this trim angle, the error between the lift and the drag coefficients are 8% and 5%, respectively, which leads to an error of 4% for the glide ratios. There is a maximum error of 15% between the semi-numerical and experimental lift and drag coefficients up to stall. This implies a reasonable fidelity aerodynamic model for the positive angles of attack before the stall. Experimental and theoretical aerodynamic characteristics of the parachute model are given in Table 3.
Table 2 Specifications of tested parachutes by NASA(Reference Ware and Hassell7)
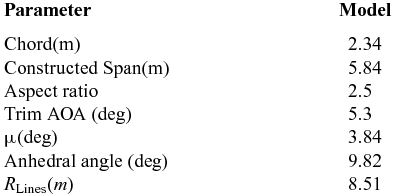

Figure 5. Lift coefficient comparison for wind-tunnel test and present approach.
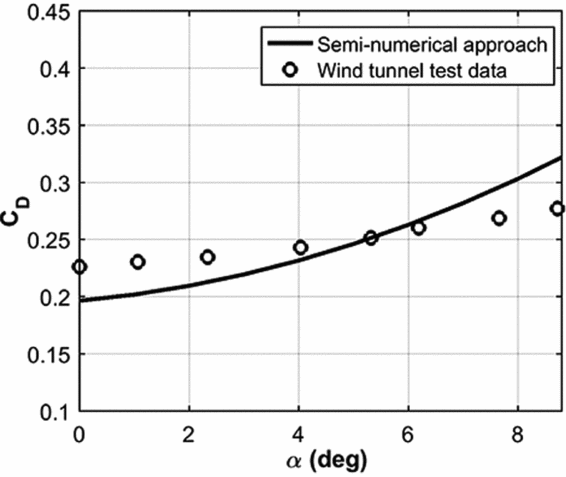
Figure 6. Drag coefficient comparison for wind-tunnel test and present approach.
Table 3 Experimental and theoretical aerodynamics characteristics of the parachute models

4.4. Performance and stability analysis
Along with the gliding and inflation performances, the safe landing velocity is another important requirement for a gliding parachute, which constrained the design problem. Sizing the canopy with the safe landing velocity prevents the design cycle to converge to the platforms with demanded glide ratio but small wing loading. A small wing loading may lead to a high landing velocity that may not be reduced even by the flare manoeuver. The landing velocity is calculated using the equations below:
 $$\begin{equation}
{V_T}& =& {\left( {\frac{{2{W_{{\rm{store}}}}}}{{{\rho _{SL}}{S_C}{C_T}}}} \right)^{\frac{1}{2}}},\\
\end{equation}$$
$$\begin{equation}
{V_T}& =& {\left( {\frac{{2{W_{{\rm{store}}}}}}{{{\rho _{SL}}{S_C}{C_T}}}} \right)^{\frac{1}{2}}},\\
\end{equation}$$
 $$\begin{equation}
{V_V} & =& {V_T}\;{\rm{sin}}\gamma = {\left( {\frac{{2{W_{{\rm{store}}}}}}{{{\rho _{SL}}{S_C}{C_D}}}} \right)^{\frac{1}{2}}}\frac{1}{{{{(1 + G{R^2})}^{\frac{3}{4}}}}}
\end{equation}$$
$$\begin{equation}
{V_V} & =& {V_T}\;{\rm{sin}}\gamma = {\left( {\frac{{2{W_{{\rm{store}}}}}}{{{\rho _{SL}}{S_C}{C_D}}}} \right)^{\frac{1}{2}}}\frac{1}{{{{(1 + G{R^2})}^{\frac{3}{4}}}}}
\end{equation}$$
The performance constraints may be completed by the stability criteria. Generally, a system is statically stable when it is able to produce forces or moments against an instantaneous perturbation in the system states from steady flight. The static and dynamic stability for gliding parachute system should be analysed, but the latter needs a complicated procedure to obtain the relevant dynamic modes and establish a reasonable database for the gliding-parachute flying qualities that is not available yet as a standard. However, this paper captures only longitudinal static stability. Theoretically, the gliding parachute system has longitudinal static stability when the pitching moment coefficient derivative with respect to angle-of-attack is negative. The origin for Cm is the confluence point of the parachute which is the point of attaching the suspension lines to the payload. The rigging angle is measured from the quarter of the chord with positive values, thus the longitudinal static stability is satisfied throughout the current design space. Hence, for such a gliding parachute system, it is concluded that:
 $$\begin{equation}
\frac{{\partial {C_{{m_{{\rm{conflunece}}}}}}}}{{\partial \alpha }} < 0\,
\end{equation}$$
$$\begin{equation}
\frac{{\partial {C_{{m_{{\rm{conflunece}}}}}}}}{{\partial \alpha }} < 0\,
\end{equation}$$
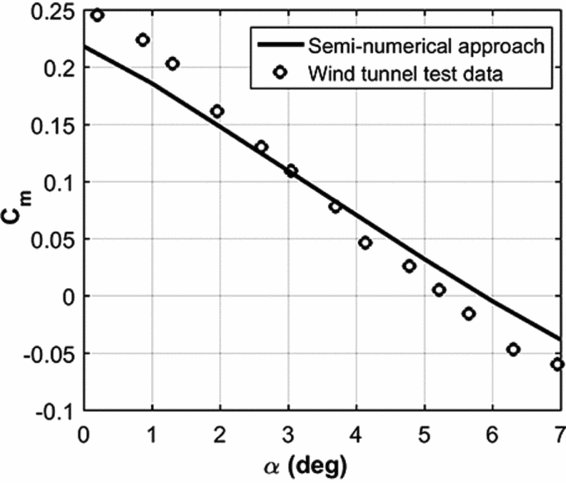
Therefore, to refine the more stable solutions with a desired level of static stability, a modified criterion in terms of demanded stability level (SL) is checked in which an upper bound of 15 percent for the static margin of the gliding parachute with respect to the confluence point is chosen. This is consistent with an average value for stability level of several operational gliding parachutes mentioned in(Reference Yakimenko38). The same criterion for the static stability level was applied to aircraft design optimisation problem(Reference Mieloszyk and Goetzendorf-Grabowsky39) which indicates a fair choice for assigned stability level, in practice. The pitching moment coefficient of the mentioned model is shown in Fig. 7. Based on the results, the experimental data confirm the theoretical results derived in(Reference Lingard10) and thus the static stability of the parachute.

Figure 7. Pitching moment coefficient comparison for wind-tunnel test and present approach.
5.0 MULTI-OBJECTIVE DESIGN APPROACH
Evidently, in the conceptual design phase, a designer should select from feasible design alternatives during a complicated trade-off process to refine variants and choose the best ones. For gliding parachute systems, the most important requirement will be the gliding capability. In this case, different variants that were extracted from the design cycle for a conventional light-cargo gliding parachute are studied. Indeed, the emerged configuration from the pareto-front creates a physical insight to the evolution of configurations and associated cost. Herein, the design is performed for a fixed mass of payload. In this case, the objective is the design of the parafoil configuration, which includes the canopy and suspension lines based on design requirements. The present multi-objective problem is planned to establish a decision-making space in terms of the system gliding capability and the associated unit cost, as well as facilitating the configuration design procedure.
5.1. Design space, objective functions and problem statement
According to the design requirements and gliding parachute configuration (Fig. 1), the parachute configuration can be defined in terms of basic design variables as:
 $$\begin{equation}
{{\bf \bar{X}}} = \left[ {{{\left( {\frac{t}{c}} \right)}_{{\rm{max}}}},c,AR,{n_{{\rm{Lines}}}},{R_{{\rm{Lines}}}},{d_{{\rm{Lines}}}},\mu ,\alpha ,{S_{{\rm{slider}}}}} \right]
\end{equation}$$
$$\begin{equation}
{{\bf \bar{X}}} = \left[ {{{\left( {\frac{t}{c}} \right)}_{{\rm{max}}}},c,AR,{n_{{\rm{Lines}}}},{R_{{\rm{Lines}}}},{d_{{\rm{Lines}}}},\mu ,\alpha ,{S_{{\rm{slider}}}}} \right]
\end{equation}$$
As mentioned earlier, there are two objective functions which may be important for a designer. The glide ratio versus cost provides a design space that facilitates the decision making based on the operational requirements and the relative cost of the systems. So, the problem is stated in the form of a bi-objective design optimisation in which the inverse of glide ratio and unit cost serve as relevant objective functions. As the first objective function, the glide ratio can be calculated as below:
 $$\begin{equation}
{F_1} = {\rm{GR}} = {\rm{atan}}\left( {\frac{{{C_D}}}{{{C_L}}}} \right)
\end{equation}$$
$$\begin{equation}
{F_1} = {\rm{GR}} = {\rm{atan}}\left( {\frac{{{C_D}}}{{{C_L}}}} \right)
\end{equation}$$
The amount of material for parachute fabrication is the total wetted area of the parachute together with the line length. Therefore, the cost of the parachute, as the second objective function, will be:
 $$\begin{equation}
{F_2} = A\frac{{{S_{{\rm{Total}}\;{\rm{Area}}}}}}{{{w_{{\rm{fabric}}}}}} + B{L_{{\rm{Suspension}}\;{\rm{Lines}}}}
\end{equation}$$
$$\begin{equation}
{F_2} = A\frac{{{S_{{\rm{Total}}\;{\rm{Area}}}}}}{{{w_{{\rm{fabric}}}}}} + B{L_{{\rm{Suspension}}\;{\rm{Lines}}}}
\end{equation}$$
The cost coefficients A and B are varied depending on the strength and the technology materials. Based on the material specification and technology, for each kind of material, the coefficients increase by increasing the strength-to-weight ratio, which may lead to increasing cost as well. For instance, the suspension lines diameter increases by increasing the lines strength. Evidently, by using an advance material such as Spectra instead of a low-cost material such as Dacron with a lower level of technology, the diameter can be decreased significantly. If the designer prefers a low-diameter suspension line made of advanced material to reduce the line drag, the cost will be a penalty and the weight may decrease. As mentioned above, there exist several disciplines such as aerodynamics, structure, performance and stability which are to be encountered during the design of the gliding parachute, and hence, the design problem can be stated in form of a multi-objective multi-disciplinary design optimisation problem as follows(Reference Martins and Lambe40):
 $$\begin{equation}
\begin{array}{@{}l@{}} {\rm{Minimise}}:{\rm{ }}F({{\bf \bar{X}}}) = {\rm{ }}[{F_1}\quad {F_2}]\\ {\rm{With}}\;{\rm{respect}}\;{\rm{to}}:{{\bf \bar{X}}} = [{(t/c)_{{\rm{max}}}},c,AR,{n_{{\rm{Lines}}}},{R_{{\rm{Lines}}}},{d_{{\rm{Lines}}}},\mu ,\alpha ,{S_{{\rm{slider}}}}]\\ {\rm{Subject}}\;{\rm{to:}}\\ L = W\;{\rm{cos}}\;\gamma \\ {C_m} = 0\\ SL \le - \% 15\\ {\sigma _{{\rm{fabric}}}} \le {\sigma _{{\rm{allowable}}}}_{_F}\\ {\sigma _{{\rm{Lines}}}} \le {\sigma _{{\rm{allowable}}}}_{_L}\\ {m_{{\rm{parachute}}}} \le \% 4{m_{{\rm{payload}}}}\\ {a_{{\rm{max}}}} \le {a_{{\rm{allowable}}}}\\ {V_V} \le {V_{{\rm{Safe}}\;{\rm{Landing}}}} \end{array}
\end{equation}$$
$$\begin{equation}
\begin{array}{@{}l@{}} {\rm{Minimise}}:{\rm{ }}F({{\bf \bar{X}}}) = {\rm{ }}[{F_1}\quad {F_2}]\\ {\rm{With}}\;{\rm{respect}}\;{\rm{to}}:{{\bf \bar{X}}} = [{(t/c)_{{\rm{max}}}},c,AR,{n_{{\rm{Lines}}}},{R_{{\rm{Lines}}}},{d_{{\rm{Lines}}}},\mu ,\alpha ,{S_{{\rm{slider}}}}]\\ {\rm{Subject}}\;{\rm{to:}}\\ L = W\;{\rm{cos}}\;\gamma \\ {C_m} = 0\\ SL \le - \% 15\\ {\sigma _{{\rm{fabric}}}} \le {\sigma _{{\rm{allowable}}}}_{_F}\\ {\sigma _{{\rm{Lines}}}} \le {\sigma _{{\rm{allowable}}}}_{_L}\\ {m_{{\rm{parachute}}}} \le \% 4{m_{{\rm{payload}}}}\\ {a_{{\rm{max}}}} \le {a_{{\rm{allowable}}}}\\ {V_V} \le {V_{{\rm{Safe}}\;{\rm{Landing}}}} \end{array}
\end{equation}$$
Basically, there is a large number of design and state variables in the large-scale multi-disciplinary design optimisation problems so that a single-level optimisation method cannot efficiently handle all of them(Reference Martins and Lambe40). In addition, in case of highly coupled disciplinary constraints, employing a multi-level strategy to decompose the problem into multiple subproblems and solve the partitioned problem is necessary. Unlike the large-scale problems, herein the disciplinary state equations are not strongly coupled and so the disciplinary constraints, in form of residuals, have a small number of state variables that simply can be evaluated at each iteration. Hence, the problem can be solved by a single level architecture, namely AAO so that all design and state variables can be handled by system level optimiser. As an invaluable feature for the AAO, the algorithm does not need to maintain the interdisciplinary feasibility at each optimisation iteration and the problem can be solved quickly whereas the optimiser explores the disciplinary regions(Reference Martins and Lambe40). On the other hand, the complimentary vectors and relevant consistency constraints are omitted from the standard AAO formulation to establish a simultaneous analysis and designFootnote 3 cycle. The resulting SAND approach avoids increasing the number of design variables and so the design complexity. Therefore, the AAO methodology appears to be the simplest to implement, has fast expected speed and is an efficient approach compared to the other monolithic methods and sophisticated multi-level architectures applied to solve several benchmark problems(Reference Balling and Wilkinson41,Reference Tedford and Martins42) . Accordingly, an integrated design framework is established using a multi-objective multi-disciplinary design optimisation approach.
5.2. Tournament-based Constrained Multi-Objective Genetic Algorithm (TCOMOGA)
As compared to classical multi-objective optimisation methods, the pareto-based multi-objective genetic approaches appeared to be effective strategies for generating uniform pareto front, especially when the pareto front has non-convex portions(Reference Deb43). Among these strategies, multi-objective genetic algorithm (MOGA) is ideally suited for solving multi-criteria problems in recent decades. It was introduced by Fonseca and Fleming(Reference Fonseca and Fleming44,Reference Fonseca and Fleming45) and applied to a vast range of aerospace system optimal design problems. In this respect, MOGA is applied to conceptual design of an air-breathing hypersonic vehicle(Reference Jing and Shou46), aerodynamic design of cascade aerofoils(Reference Obayashi, Sasaki and Oyama47), design of a multi-stage compressor(Reference Oyama and Liou48). In MOGA, individuals are first ranked based on a dominance concept in which the rank of non-dominated individuals is equal to 1. Then fitness values are assigned to the population so that the non-dominated individuals have the best fitness value. When the optimisation problem consists of constraints, the evolutionary algorithm should be improved to handle them. In constraint optimisation, since the classification of solutions in pareto front is very sensitive to the correct choice of penalty parameters in the penalty function approach, so the constraints are handled using different strategies. To do so, in the present MOGA algorithm, each individual is labelled by two values. One value is a rank based on the dominance in population and another is the degree of constraint violation or the degree of infeasibility. However, the feasibility of solutions is preferred to their dominance. Using these metrics, a constrained tournament selection operator is applied to refine the solutions based on superiority and feasibility before recombination. Thus, after selection of individual pairs from the population, the following rules are adopted to choose parents:
1 - If two individuals are feasible or infeasible with the same degree of constraint violation, the individual with the better rank is selected.
2 - If two individuals are infeasible, the one with the smaller constraint violation is selected.
3 - If one individual is feasible and another is infeasible, the feasible one is preferred.
4 - In case of both having an equal degree of constraint violation or pareto rank, a solution which falls in the sparse region is selected. In this situation, as a measure of merit, the niche count is used to decide between two individuals.
A non-constraint-dominated set is created using the above steps. Now, for ‘m’ inequality constraints, the degree of constraint violation C(X) is measured as shown below:
 $$\begin{equation}
C({{\bf X}}) = \sum\limits_{j = 1}^m {{c_j}(X)} \;{\rm{where}}\;{{{\bf c}}_{{\bf j}}}({{\bf X}}) = \left\{ {\begin{array}{@{}*{1}{c}@{}} {{\rm{max}}(0,{{{\bf g}}_{{\bf j}}}({{\bf X}}))\;,\;j = 1,\ldots ,k}\\ {{\rm{max}}(0,\left| {{{{\bf h}}_{{\bf j}}}({{\bf X}})} \right| - \varepsilon ),\;j = k + 1,\ldots ,m} \end{array}} \right\}
\end{equation}$$
$$\begin{equation}
C({{\bf X}}) = \sum\limits_{j = 1}^m {{c_j}(X)} \;{\rm{where}}\;{{{\bf c}}_{{\bf j}}}({{\bf X}}) = \left\{ {\begin{array}{@{}*{1}{c}@{}} {{\rm{max}}(0,{{{\bf g}}_{{\bf j}}}({{\bf X}}))\;,\;j = 1,\ldots ,k}\\ {{\rm{max}}(0,\left| {{{{\bf h}}_{{\bf j}}}({{\bf X}})} \right| - \varepsilon ),\;j = k + 1,\ldots ,m} \end{array}} \right\}
\end{equation}$$
The fitness sharing is a niche-count metric and is used to quantify the crowding of individuals(Reference Konak, Coit and Smith49). Accordingly, the procedure of the TCOMOGA is given in following steps:
Step 1: Generate a random population as the first generation, set generation = 0.
Step 2: Evaluate objective functions and constraints.
Step 3: Assign a rank to each individual based on his dominance concept as:
(a) Assign a fitness to each individual based on its rank.
(b) Calculate the shared fitness based on niche count of each individual.
(c) Normalise the fitness values using shared fitness values.
(d) Calculate the degree of constraint violation for each individual using Eq. (26).
Step 4: Use the tournament selection method to provide mating pool.
Step 5: Apply the cross-over and the mutation operators to create offsprings.
Step 6: Apply reinsertion and elitism criteria to generate anew population.
Step 7: Check the stopping criteria. If satisfied, terminate the algorithm; else, set generation = generation+1 and return to Step 2.
Accordingly, the overall MOGA algorithm constructed here is illustrated in Fig. 8.
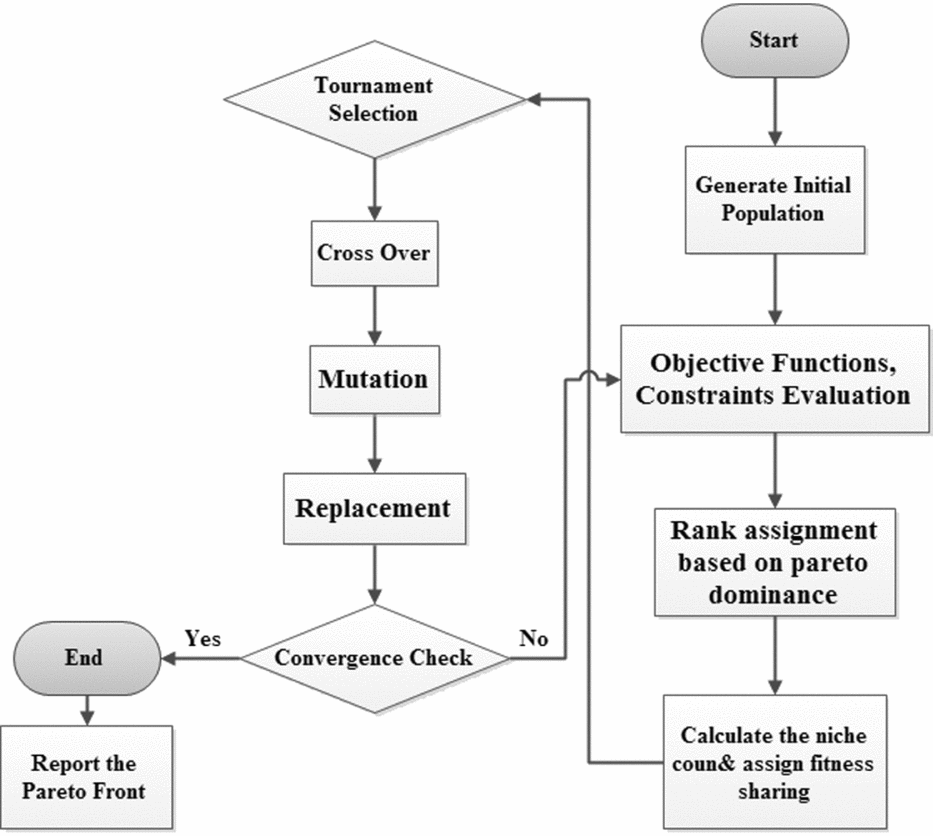
Figure 8. Flowchart of TCOMOGA.
Evidently, in presence of hard equality constraints such as trim equation, the mating pool may be mostly filled by the infeasible fittest solutions for the first generations. To avoid this problem, an elitism strategy is implemented to enrich the population by the fittest and feasible individuals. Therefore, 5% of the next generation is formed by feasible elites if they exist; otherwise, by elites with the minimum degree of constraints violation. The TCOMOGA algorithm is combined with the parachute design cycle to establish an integrated design framework for the gliding parachute optimal configuration design and to facilitate the conceptual design phase using the novel algorithm. In this case, as a hard constraint, the trim equation is relaxed by adopting some loss in accuracy as shown below:
 $$\begin{equation}
{C_m} = 0 \to \left| {{C_m}} \right| - \varepsilon \le 0
\end{equation}$$
$$\begin{equation}
{C_m} = 0 \to \left| {{C_m}} \right| - \varepsilon \le 0
\end{equation}$$
The tolerance chosen is a small value and based on the type of the problem, its value is selected.
6.0 RESULTS AND DISCUSSION
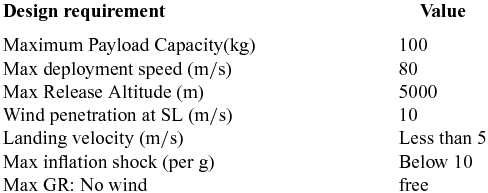
Analyses are conducted in this paper for a cargo-type canopy as the standard case study and the design cycle is handled by considering a multi-objective approach. In order to investigate the effectiveness of the design procedure in practice, a case study is defined that is based on the associated design requirements for a conventional light-cargo gliding parachute in reachable glide ratios. It is obvious for a fixed mass of payload: different glide ratios may be achieved for a configuration by changing the rigging angle, but this does not mean a minimised cost for the configuration with each glide ratio. In other words, based on the desired operational glide ratio that a configuration has been designed for, a minimum cost can be achieved, The design requirements are summarised as shown in Table 4.
Table 4 Gliding parachute design requirements

The candidate materials for fabrication are divided into low- and high-technology levels. For instance, the assigned materials for suspension lines can be:
• Low-technology material for suspension lines, which is made of braided polyester such as Dacron and has relatively high diameter and low cost;
• Advanced material for suspension lines, which is called Spectra and has lower diameter and higher cost.
For this case, since the parachute is a light cargo parachute, based on experience with similar parachutes, a conventional ripstop nylon fabric, MIL-C-44378, is proposed. Therefore, to clarify the role of the material technology level on the parachute design, two groups of suspension lines are introduced which their specifications are listed in Table 5 using respective military standards.
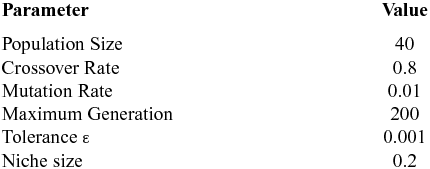
According to Table 5, two curves can be fitted to the material diameter and strength to provide the required dataflow during optimisation. It is noted that the baseline aerofoil is Clark Y, as a conventional section for ram-air parachutes. Finally, the TCOMOGA algorithm is implemented in MATLAB and its respective parameters are stated in Table 6.
Table 6 GA parameters
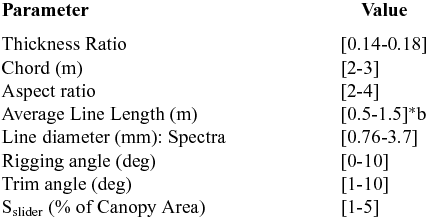
The stopping criteria is the maximum number of generation and the stall length of 20 for domination. The search space for present case study is given in Table 7.
Table 7 Search space
The design cycle stopped because it met the stall generation criteria after 183 generations with a run time of 15738 s on the computer (CPU: Intel(R) Core i7-3470, 3.2 GHz, RAM 8 GB). The resulting pareto front is shown in Fig. 9.
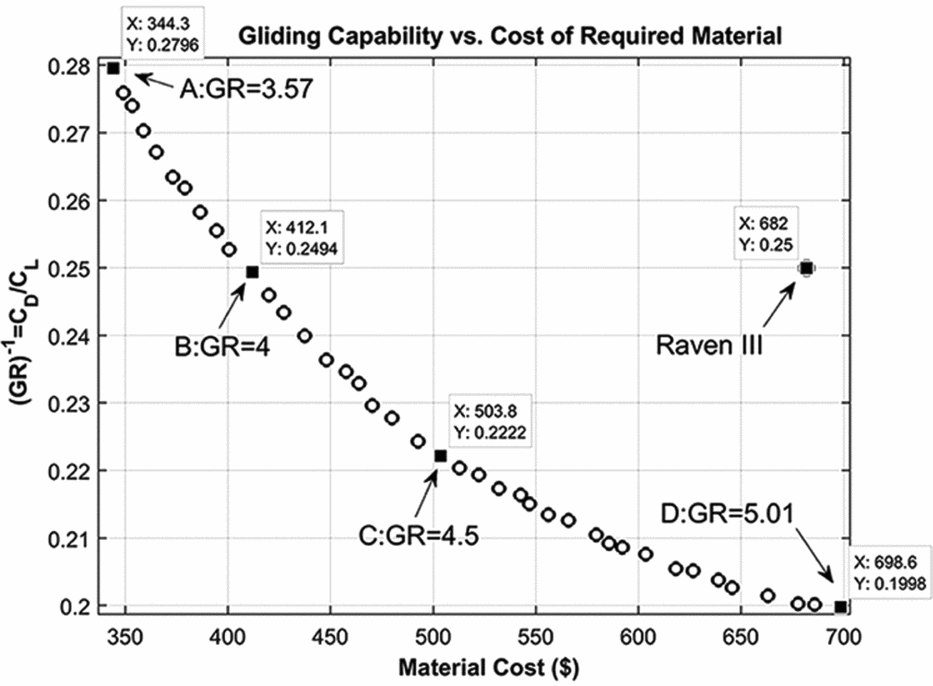
Figure 9. Pareto front for achieved GRs ranged from 3.5 to 5.
The resulting pareto front facilitates the decision-making between the platforms according to their material cost and gliding capability. In Fig. 9, the four labelled points achieved by the glide ratio have the characteristics shown in Table 8.
Table 8 Detail specifications of optimal platforms
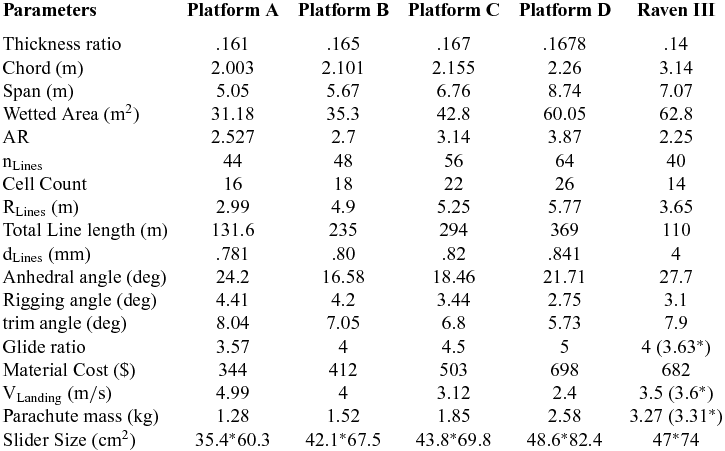
*Estimation using present approach
As part of the MATLAB code which provides an integrated framework for gliding parachute design and optimisation, the schematics of the four configurations stated above are shown in Fig. 10.
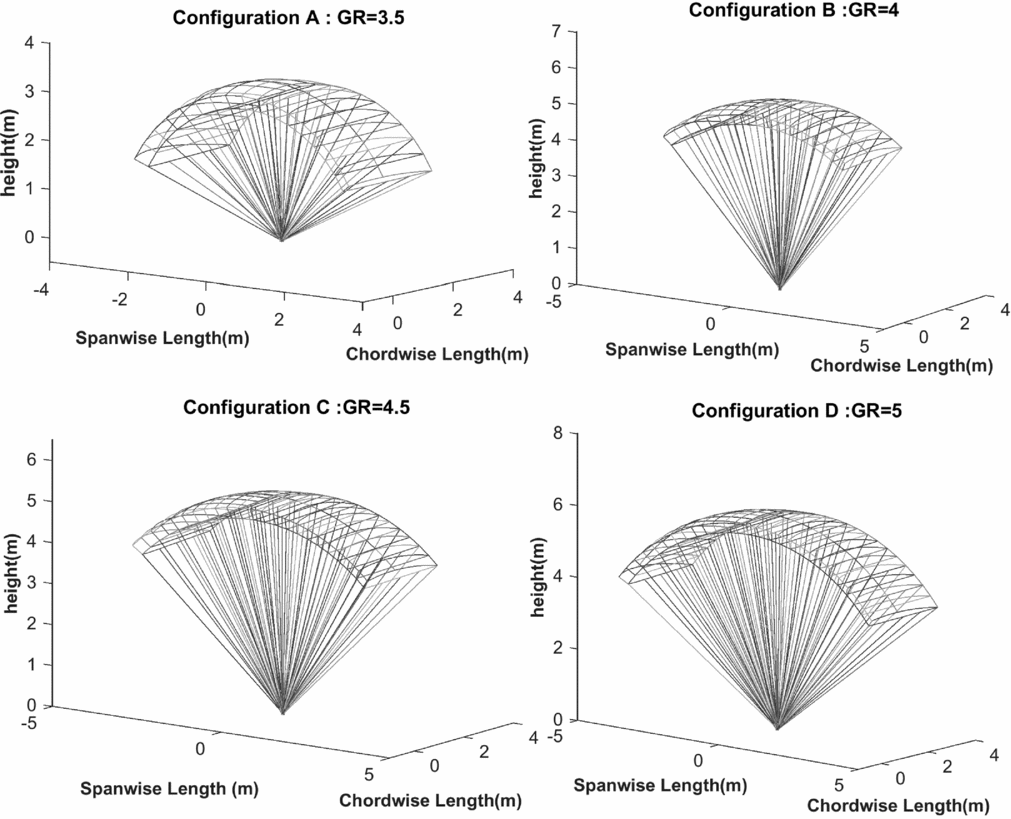
Figure 10. Schematics of configurations with glide ratios from 3.5 to 5.
According to the evolution of the configurations in Fig. 10, a unique configuration for each glide ratio is obtained with minimal cost. This is achieved by adopting the following approaches in the design procedure:
• Assigning advanced material instead of low-technology material in lines to decrease the line diameter and so the profile drag;
• Increasing the aspect ratio to reduce the induced drag, increasing the glide ratio and obtaining a safe landing velocity simultaneously;
• Achieving a lower design factor than that for personnel-type parachutes in contrast to reducing the excess operational safety and durability;
• Increasing the parachute landing velocity margin and using shock absorbers such as honeycomb structures if necessary;
• Decreasing the parachute cord and anhedral angle to reduce the material cost and increase the lift, respectively.
As compared to the aspect ratio and the suspension lines length, it is clear that the parachute cord has a more significant effect on the material cost. Thus, for the lowest material cost with a maximal GR, namely configuration A, the parachute is sized, based on a minimum planform area so that the landing velocity is equal to its maximum allowable value. In other words, the lowest cost configuration is bounded by the landing velocity mainly to minimise the cost as much as possible whereas the maximum attainable glide ratio for this configuration is obtained by increasing the aspect ratio. In configuration B, the parachute has the maximum glide ratio of 4 but the landing velocity is not necessarily equal to the maximum allowable value and is below the maximum allowable landing velocity. This situation exists for the other configurations and achieving the maximum GR in each configuration decreases the landing velocity based on the value of the desirable aspect ratio. In configurations C and D, the aspect ratio grows above 3 to attain a configuration with more glide ratio in decision space. This causes the increasing of the number of lines, ribs and so the wetted area which means increasing the material cost, but this is compensated by decreasing the parachute cord and line diameter. For this purpose, assigning the advance technology materials in lines will be desirable. In all cases, the lines length and slider area are determined by the algorithm to keep the inflation loads and material strength inside the feasible region. All solutions in the pareto-optimal set satisfied an assigned stability level of 15 percent. It is noted that for the gliding parachutes, the stability level can be artificially improved by changing the rigging scheme, but it is limited by the desired trim angle representing the maximal glide ratio. In other words, the higher the rigging angle, the larger the static stability level, in contrast to the smaller the trim angle, which may result in a lower glide ratio. As another result, it is concluded that under no circumstances a glide ratio less than 3.57 and more than 5 cannot be reachable inside the search space for an optimal configuration. Also, an optimised aerofoil profile with better 2D aerodynamics characteristics should be taken to attain higher gliding characteristics. In four specified points on the pareto front, the average thickness ratio of 16.5% is reached, which indicates an optimal value for thickness ratio for the gliding parachute. On the other hand, as a significant design parameter, the aspect ratio is restricted by increasing the cells and suspension lines. As the aspect ratio increases, the number of cells is increased, which leads to increasing the material cost. So, a trade-off is made between reduction of cord and increasing the aspect ratio. Herein, by increasing the aspect ratio, the induced drag decreases and increasing the number of lines is compensated by using advance materials. In spite of usage of materials with higher cost, the overall cost remains in a desirable range with respect to the similar platform. Briefly, in order to design an affordable cargo gliding-parachute platform, configuration should be designed so that the glide ratio increases as much as possible in contrast to reduction of material cost.
From a practical point of view, as a low-cost high-glide-ratio parachute platform, the Raven III parachute is a candidate in this paper for the cargo delivery application. To evaluate the effectiveness of design optimisation algorithm, the Raven parachute is compared with configuration B which has the same glide ratio. The glide ratio of Raven III parachute is estimated using present approach which has an error of less than 10% relative to its reported Glide ratio(52). The schematics of two configurations are shown in Fig. 11.
Figure 11. Comparison of Raven III personnel parachute and the optimised affordable cargo parachute platform.
Results show that for the optimised platform, the cord and anhedral angle are decreased whereas the aspect ratio and number of cells are increased. As a main result, near 39% reduction in material cost is achieved in platform B. Also, in case of 10% underestimation for glide ratio, the cost reduction will be slightly more than 25% that is an acceptable result for the design algorithm. Therefore, using the introduced design procedure, an affordable cargo gliding parachute can be fabricated with a desirable stand-off distance and respective minimal cost.
7.0 CONCLUSION
The design of an affordable cargo gliding parachute was defined as a minimisation problem of the platform cost versus drag-to-lift ratio which characterises the amount of material for fabrication and gliding capability, respectively. To solve the problem, the gliding parachute configuration was defined by a set of significant disciplinary design variables. Under an all-at-once approach, all design variables were obtained with a single optimiser in the system level. Since the rigging angle and therefore the angle-of-attack were necessary to validate the static stability criterion of each platform, instead of solving the trim problem in a separate loop, the trim point analysis was embedded into the underlying optimisation problem. In this case, the analysis and design were carried out by the optimiser simultaneously which in turn reduced the computational cost. The novel design algorithm reported pareto-optimal solutions using tournament-based multi-objective genetic algorithm at the end, which handled the constraints through the selection stage. The output of design cycle provided unique points in which the glide ratio was maximum whereas the cost was minimum. Applying advanced material in suspension lines increased the degree of freedom in increasing the aspect ratio. The higher cost of parachute fabric rather than the suspension lines justified the usage of the advanced material in lines from an economic point of view. So, a reduction of the parachute cord together with an increase in the aspect ratio increased the glide ratio and reduced the wetted area, which in turn led to a lower cost configuration. Unlike the personnel-type parachutes, the choice of a lower design factor positively contributed the glide ratio by decreasing the profile drag. Also, increasing the aspect ratio along with lower profile drag obtained higher glide ratio concepts. Finally, as compared to a candidate gliding parachute for aerial delivery application, namely ‘Raven III’ with a low-technology material suspension lines, the design algorithm resulted in an optimised affordable platform with the same gliding capability and a reduced material cost by at least 25%.