NOMENCLATURE
- NN
Neural Networks
- EGD
Extended Great Deluge
- Cp
pressure coefficient
- CD
drag coefficient
- CL
lift coefficient
- CM
moment coefficient
- MSE
mean squared error
- Re
Reynolds number
- Ma
Mach number
- L
characteristic linear dimension (m)
- V
air viscosity (m/s)
- ν
kinematic viscosity (m²/s)
- a
sound speed
- P
total pressure
- P∞
pressure in the freestream
- ρ∞
freestream fluid density
- u∞
freestream velocity of the fluid
1.0 INTRODUCTION AND BACKGROUND
The ability to predict the parameters of various air loads on an aircraft is very useful in aircraft design. The precise determination of aerodynamic parameters such as pressure distributions and aerodynamic coefficients (lift, drag and moment) from known parameters such as angles of attack, Mach and Reynolds numbers in real time is still not rapidly achieved by numerical analysis aerodynamics methods. The numerical results are usually validated by experimental tests in wind tunnels or in flight.
Control systems are used to control the air on a wind-tunnel model, usually of reduced scale, by using various control methodologies incorporating modern sensors and actuators. These methods use various optimisation techniques (e.g. neural network, fuzzy logic, extended great deluge). The tests were performed in the Price-Païdoussis subsonic blow-down wind tunnel at the Research Laboratory in Active Controls, Avionics and Aeroservoelasticity (LARCASE). This wind tunnel has two test chambers; the first chamber has a 1-by-2-foot section that provides maximum speed of 60 m/s, and the second chamber has a 2-by-3-foot section that works for maximum speed of 40 m/s.
Neural networks (NNs) have been used in multiple domains including pattern classification, optimal control and manufacturing(Reference Wrong, Vincent and Lam1-Reference Chen and Burrel5). Applications of NNs in the field of reliability have been proposed by Nourelfath and Nahas(Reference Nourelfath and Nahas6,Reference Nourelfath and Nahas7) , and by Yuan and Guangchen(Reference Yuan and Guangchen8). A model based on NNs and fuzzy min-max was proposed by Seera et al(Reference Seera, Lim, Ishak and Singh9) to detect and classify the comprehensive fault conditions of induction motors. In aerospace engineering, NNs can be applied to a large range of complex problems(Reference Faller and Schreck10). Neural networks have been used to solve many problems in the aeronautical industry such as the detection and identification of structural damage(Reference Rauch, Kline-Schoder, Adams and Youssef11), the modelling of aerodynamic characteristics from flight data(Reference Linse and Stengel12,Reference Amin, Gerhart and Rodin13) , the detection of unanticipated effects such as icing(Reference Johnson and Rokhsak14-Reference Johnson and Rokhsaz16), and autopilot controllers and advanced control laws for applications such as carefree manoeuvring(Reference Napolitano and Kincheloe17,Reference Yavrucuk, Prasad and Calise18) , as well as lift and drag aerodynamic coefficients CL and CD prediction(Reference Wallach, De Mattos and Da Mota Girardi19).
In 2000, researchers began to use neural network techniques in wind tunnels in the aerospace field, mainly to design control systems. Lunia et al(Reference Lunia, Isaac, Chandrashekhara and Watkins20) presented an experimental study for the use of smart sensing and Neural Networks applied to strain loads for different airflow cases. They have used a fibre optic sensor to train and verify the neural network performance and incorporated a multilayer network to map the inputs and the outputs for a nonlinear system. They used a neural network consisting of three layers; the first layer contained three neurons, the second layer contained five neurons, and the third contained one neuron. A ‘hyperbolic tangent sigmoid function’ was used in the first and second layers; in the third layer, the ‘linear function’ was employed. The network was developed through ‘supervised learning’ in which parameters were adjusted to achieve the target outputs for given inputs. In particular, a back-propagation algorithm was used to minimise the error between the desired output and the current network output. The principle of this algorithm was to provide input to the network, and then, by forward propagation, to calculate the output obtained from the network. The error was calculated for the output and the error contribution of each neuron was further estimated. Then, by using the ‘steepest gradient algorithm’, the weights and biases of each neuron were updated to minimise the error(Reference Lunia, Isaac, Chandrashekhara and Watkins20).
In 2000, Scott(Reference Scott21) developed an adaptive neural network-based control system. Three control systems were developed and tested in their work. The first system was used for flutter design and for validation of suppression control laws, the second system employed a predictive NN control scheme, and the third system used a neural network in an inverse model control scheme. The author described some of the methodologies and results obtained in the Adaptive Neural Control of Aeroelastic Response (ANCAR) project. The goal was to develop and demonstrate control systems using the Benchmark Active Controls Technology (BACT) wind-tunnel model.
Suresh et al(Reference Suresh, Omkar, Mani and Guru Prakash22) used recurrent neural networks for the prediction of lift coefficients at a high angle-of-attack. In their approach, the lift coefficient was obtained from the wind-tunnel test. Fei et al(Reference Fei, Zhu, Zhou and Wang23) considered the air speed, the angle-of-attack and the angle of sideslip fundamental parameters in the control of flying bodies. They proposed a new experimental methodology by which the flight parameters were inferred from multiple hot-film flow speed sensors mounted on the surface of the wing of a Micro Air Vehicle (MAV). To obtain a good mathematical relationship between the readings of the sensors and the flight parameters, they proposed micro hot-film flow speed sensor arrays and a back-propagation neural network to determine three flight parameters: air speed, angle-of-attack and angle of sideslip(Reference Fei, Zhu, Zhou and Wang23).
Peyada(Reference Peyada and Ghosh24) proposed using feed-forward neural networks to estimate aircraft parameters from flight data. That method used feed-forward neural networks to establish a neural model able to predict the time histories of motion variables at the (k + 1)th instant, given that the measured initial conditions correspond to the kth instant(Reference Peyada and Ghosh24).
A neural network based on a flush air data sensing system and demonstrated on a MAV was presented by Samy et al(Reference Samy, Postlethwaite and Gu25). A new active fault tolerant control strategy was proposed by Guo et al(Reference Guo, Zhang and Jiang26) for the system in the presence of actuator fault and input constraints, utilising neural networks to approximate the plant uncertainty and the adaptive parameters, adjusted with a projection algorithm(Reference Guo, Zhang and Jiang26). Xuan et al(Reference Xuan, Chen, Wu, Zhang and Guo27) presented a fuzzy neural network controller, which had the advantages of both fuzzy control and neural networks, for the control of uncertain parameters for nonlinear time-varying systems.
Neural network structures have several advantages. For example, they employ a highly parallel structure if networks with a larger number of hidden layers are used. All the neurons in a layer can be computed simultaneously to enhance the speed. Another advantage is the simplicity of the required computations performed by each neuron in the network.
Fuzzy logic can be used to model highly nonlinear, multidimensional systems, including those with parameter variations, or where the sensors’ signals are not accurate enough for other models(Reference Sivanandam, Sumathi and Deepa28). De Jesus-Mota and Botez(Reference De Jesus Mota and Botez29) proposed a new technique for helicopter model identification from flight data tests based on neural networks. The dynamics behaviour of the helicopter was identified with a recurrence method and an optimisation procedure based on neural network theory and the tuning of the initial conditions(Reference De Jesus Mota and Botez29). An aeroservoelastic model was presented by Boeły et al(Reference Boeły and Botez30,Reference Boeły, Botez and Kouba31) in which neural network and fuzzy logic algorithms identify the multi-input and multi-output systems of an F/A-18 aircraft.
Many numerical and meta-heuristic algorithms have been proposed for the optimisation and training of NN models, such as genetic algorithm, extended great deluge and simulated annealing. A numerical algorithm was proposed by Zhang(Reference Zhang and Rutkowski32) for training feed-forward neural networks using a recursive prediction error method(Reference Zhang and Rutkowski32). A flight parameter control system based on neural networks was proposed by Ben Mosbah et al(Reference Ben Mosbah, Botez and Dao33), in which the proposed NNs are optimised using a meta-heuristic algorithm, called the extended great deluge (EDG). Their approach predicted pressure distributions and aerodynamic coefficients from the known parameters (angles of attack, Mach numbers, Reynolds numbers, etc.). Xiao et al(Reference Xiao, Hu and Zhang34) proposed a fault-tolerant altitude tracking control scheme for flexible spacecraft with a partial loss of actuator effectiveness fault. In their proposed model, NNs are integrated to approximate the unknown system dynamics. An approach to identify and model the dynamics of fighter aircraft using NNs was proposed by Roudbari and Saghafi(Reference Roudbari and Saghafi35).
NNs have also been applied in the design field. Xin-lai et al(Reference Xin-lai, Hu, Gang-lin and Zhe36) proposed a hybrid approach for helicopter design based on genetic algorithms and NNs. An approach based on the genetic algorithm and NNs was proposed by Yuan-ming et al(Reference Yuan-ming, Shuo and Xiao-min37), and was further applied to replace the currently deployed expensive finite element analysis during composite structural optimisation(Reference Yuan-ming, Shuo and Xiao-min37).
Kouba et al(Reference Kouba, Botez and Boeły38,Reference Kouba, Botez and Boeły39) proposed an identification model based on fuzzy logic methods to identify nonlinear aircraft models for many flight test cases; their proposed model was applied for an F/A-18 aircraft. A study presented by Grigorie et al(Reference Grigorie, Botez and Popov40) described a new method for realising two neuro-fuzzy controllers for a morphing wing design application. Their proposed system correlated each set of pressure differences, calculated between the optimised and the reference aerofoil, with each of the aerofoil deformations produced by the actuators. Piroozan(Reference Piroozan41) proposed an intelligent control system that used electro-optics and neural networks to control the flow of air over a flexible wall. A study presented by Panigrahi et al(Reference Panigrahi, Dwivedi, Khandelwal and Sen42) predicted the turbulence statistics behind a square cylinder using neural networks and fuzzy logic. An improved neural network-based method was proposed by Voitcu et al(Reference Voitcu and Wong43) to predict the nonlinear oscillations in the aeroelastic response. A neural network model was used by Li et al(Reference Li, Fairbank and Johnson44) to control a grid-connected rectifier/inverter. Several other uses of fuzzy logic have been presented by the same authors in identification and control areas(Reference Grigorie and Botez45-Reference Grigorie, Botez, Popov, Mamou and Mébarki50).
2.0 FLIGHT PARAMETERS
The main objective in this section is to determine the influence of the Mach number Ma and the angle-of-attack α around an aerofoil. For the learning and validation of the NN-EGD, the results were obtained by use of the wind tunnel of the Research Laboratory in Active Controls, Avionics and Aeroservoelasticity (LARCASE). Using XFoil aerodynamics software, the distribution of pressure coefficients (Cp) was obtained around the aerofoil for an ATR-42 reduced-scale wing model.
The distribution of the total pressure P was obtained using the well-known aerodynamics formula (Equation (1)):
The Reynolds number (Re) and Mach (Ma) number were calculated using the following formulas (Eqautions (2) and (3)):
Another objective is to determine the drag (CD), lift (CL) and moment (CM) coefficients for different values of the air speed and angles of attack for an ATR-42 aerofoil. To learn and test our approach, XFoil code was used to obtain their values.
3.0 XFOIL CODE
In This study, XFoil 6.96 was used to obtain aerodynamic coefficient for an ATR-42 aerofoil. This bi-dimensional aerodynamic analysis code is developed by Drela(Reference Drela and Giles58) in 1987 and is used to analyse and draw aerodynamic aerofoils. The aerodynamic analysis using XFoil gives a good prediction of the laminar/turbulence transition resulting of the precision of drag and lift calculation. This performance was proved by experimental tests performed by Madsen and Filippone(Reference Madsen and Filippone59). Authors tested and proved that XFoil code gives a acceptable aerodynamic coefficients regarding to the experimental results in cruise flight angle-of-attack for subsonic aerofoil analysis(Reference Coutu, Brailovski and Terriault60).
For the viscose/inviscid calculation, different methods were used in XFoil. The inviscid analysis are performed using a linear vorticity stream function panel method. To perform a good prediction, a Karman-Tsien compressibility correction is added to XFoil. For viscose calculation, the eN method was used for the boundary layer and wake formulations(Reference Coutu, Brailovski and Terriault60).
The XFoil code is faster than other CFD software, which is useful when connected to an optimisation process of morphing aerofoils. However, the obtained results using XFoil cannot match exactly the wind-tunnel results due to the three-dimensional flow effects(Reference Coutu, Brailovski and Terriault60).
4.0 NEURAL NETWORKS
Neural networks have been used in different domains, especially in aerospace. Some applications of neural networks are aircraft component fault detectors, autopilot enhancements, flight path simulations and aircraft control systems. They have also been proposed to control flight parameters.
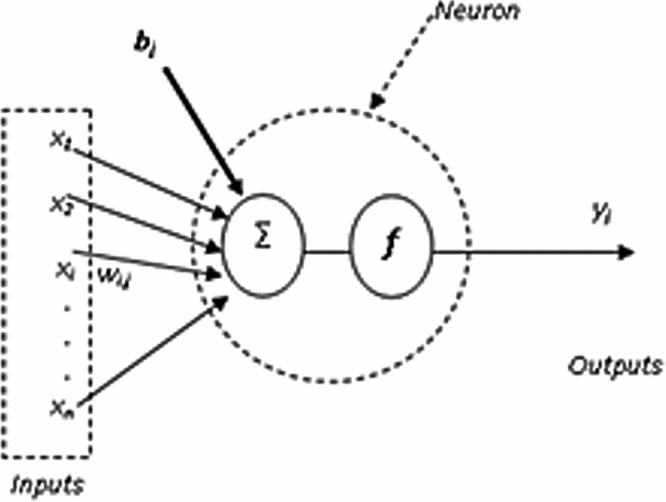
Artificial neural networks are mathematical models inspired by biological neurons; they can reproduce an artificial intelligent reasoning. Neural networks are one of the most important components of the field of artificial intelligence. An artificial neural network is a processing structure which employs a massively parallel architecture and is built up of interconnected simple processing units or neurons. Each neuron passes on a weighted function of its inputs to the next layer of neurons(Reference Lunia, Isaac, Chandrashekhara and Watkins20). A general structure of one neuron is shown in Fig. 1. Neural networks have many inputs (x1 x2 . . . xn), outputs (yi), and linearity or/and nonlinearity in their transfer functions. The function of each neuron is to sum the weighted inputs (wi,j) and the bias (bj) and process this sum through a transfer function (f)(Reference Scott21). This function (f) can be linear ![]() $( {{y_j} = \mathop \sum _i^n {x_i}{w_{i,j}} + {b_j}} )$ or nonlinear (for example: the tan-sigmoid transfer function
$( {{y_j} = \mathop \sum _i^n {x_i}{w_{i,j}} + {b_j}} )$ or nonlinear (for example: the tan-sigmoid transfer function ![]() ${y_j} = {\rm{Tanh}}\ ( {\mathop \sum _i^n {x_i}{w_{i,j}} + {b_j}} )$.
${y_j} = {\rm{Tanh}}\ ( {\mathop \sum _i^n {x_i}{w_{i,j}} + {b_j}} )$.

Figure 1. Architecture of an artificial neuron.
5.0 EXTENDED GREAT DELUGE
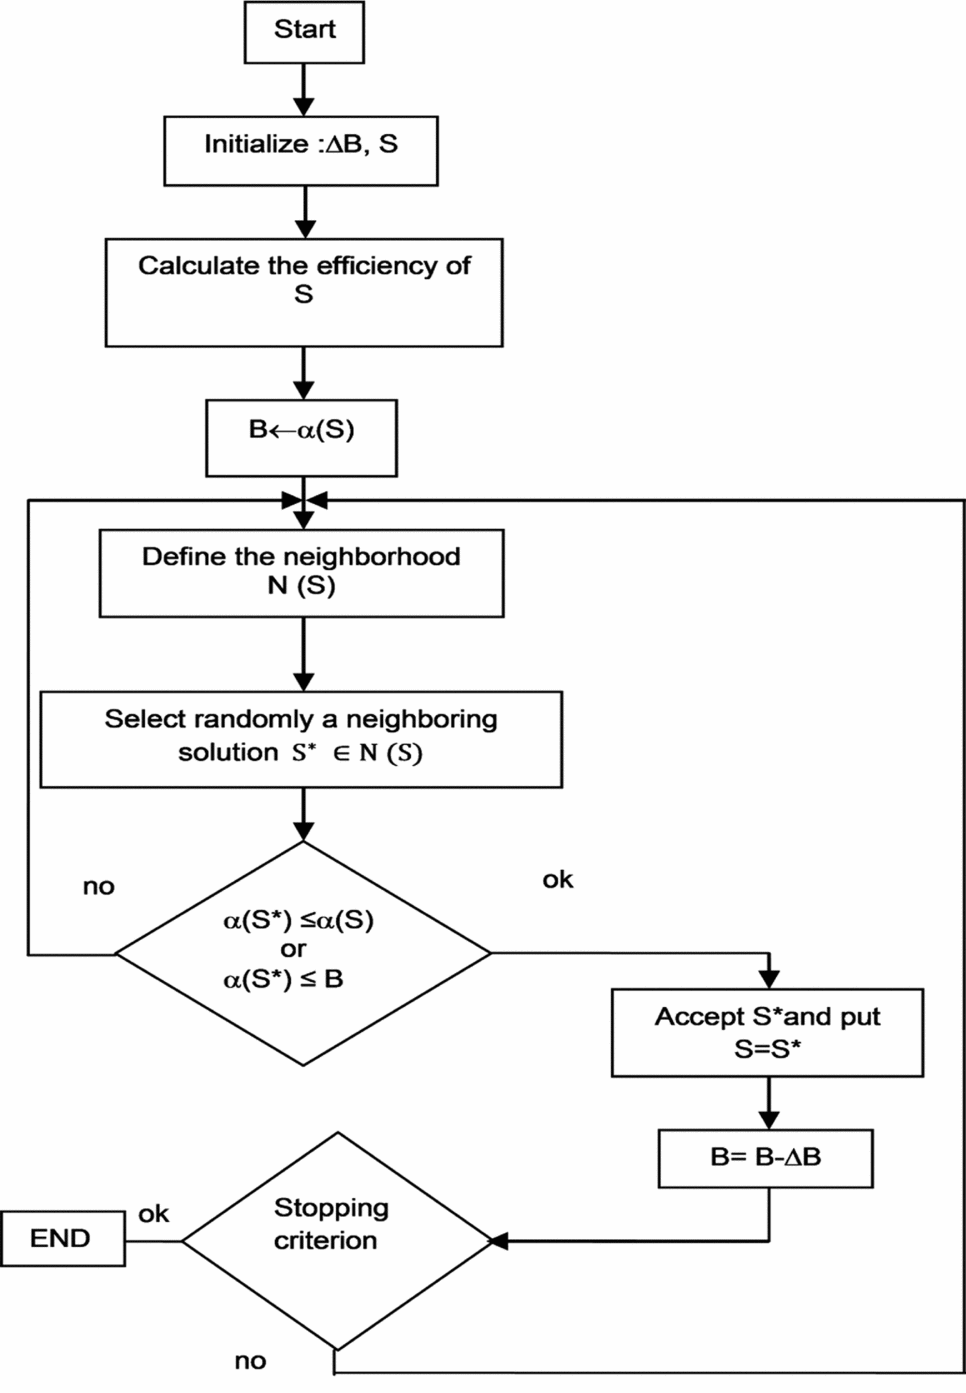
In this work, an optimisation algorithm based on the meta-heuristic extended great deluge (EGD) is used. This algorithm was presented by Burke et al(Reference Burke, Bykov, Newell and Petrovic51), and the first application realised with this approach was the optimisation of the exam timetable problem treated by Burke et al(Reference Burke, Bykov, Newell and Petrovic51). Several of their results have been improved using approaches such as ‘taboos search’. Figure 2 shows the steps of the EGD algorithm(Reference Burke, Bykov, Newell and Petrovic51). This algorithm was used to solve a preventive maintenance optimisation problem for multi-state systems by Nahas et al(Reference Nahas, Khatab, Ait-Kadi and Nourelfath52). Their model found an optimal sequence of maintenance actions that minimised maintenance costs(Reference Nahas, Khatab, Ait-Kadi and Nourelfath52). Another application of the EGD algorithm was the optimisation of the group scheduling problem by Ben Mosbah and Dao(Reference Ben Mosbah and Dao53-Reference Ben Mosbah and Dao55) (two of the authors of this paper), in which the EGD algorithm gave better results than a genetic algorithm (GA) and simulated annealing (SA).

Figure 2. General flowchart of the EGD algorithm(Reference Ben Mosbah and Dao55).
The EGD algorithm has not yet been used in aerospace problems. Based on its strong performance, this algorithm was used in hybridisation with neural networks to find the predicted flight parameters. As explained by Burke et al(Reference Burke, Bykov, Newell and Petrovic51), the EGD is a local search procedure introduced by Dueck(Reference Dueck56). This algorithm works as simulated annealing (SA) but it accepts solutions that are poorer than those from SA to identify the local minimum.
The first step of the algorithm, as shown in Fig. 2, consists of randomly initialising ΔB and the initial value of the SVM parameters (S). Next, the efficiency α (the error) of S is calculated, and its value is assigned to B. The neighbourhood N(S) of S is then defined; a neighbouring solution S* belonging to N(S) is randomly selected; and the new solution N(S*) is compared with the old solution, N(S) and B. If the two conditions (α(S*) ≤ α(S) and B) are not satisfied, then a new neighbouring solution S is selected; if one of these conditions is true, then the solution S* is accepted, and B = B – ΔB is recalculated. Finally, the stopping criterion is tested, and if the number of iterations has been reached, the algorithm ends. A new neighbouring solution S is selected and the algorithm is tested again(Reference Ben Mosbah and Dao57).
In this work, a hybrid NN-EGD method is proposed to control the pressure distribution, as well as the lift, drag and moment coefficients by varying the angles of attack at low Reynolds numbers.
6.0 NN-EGD ALGORITHM
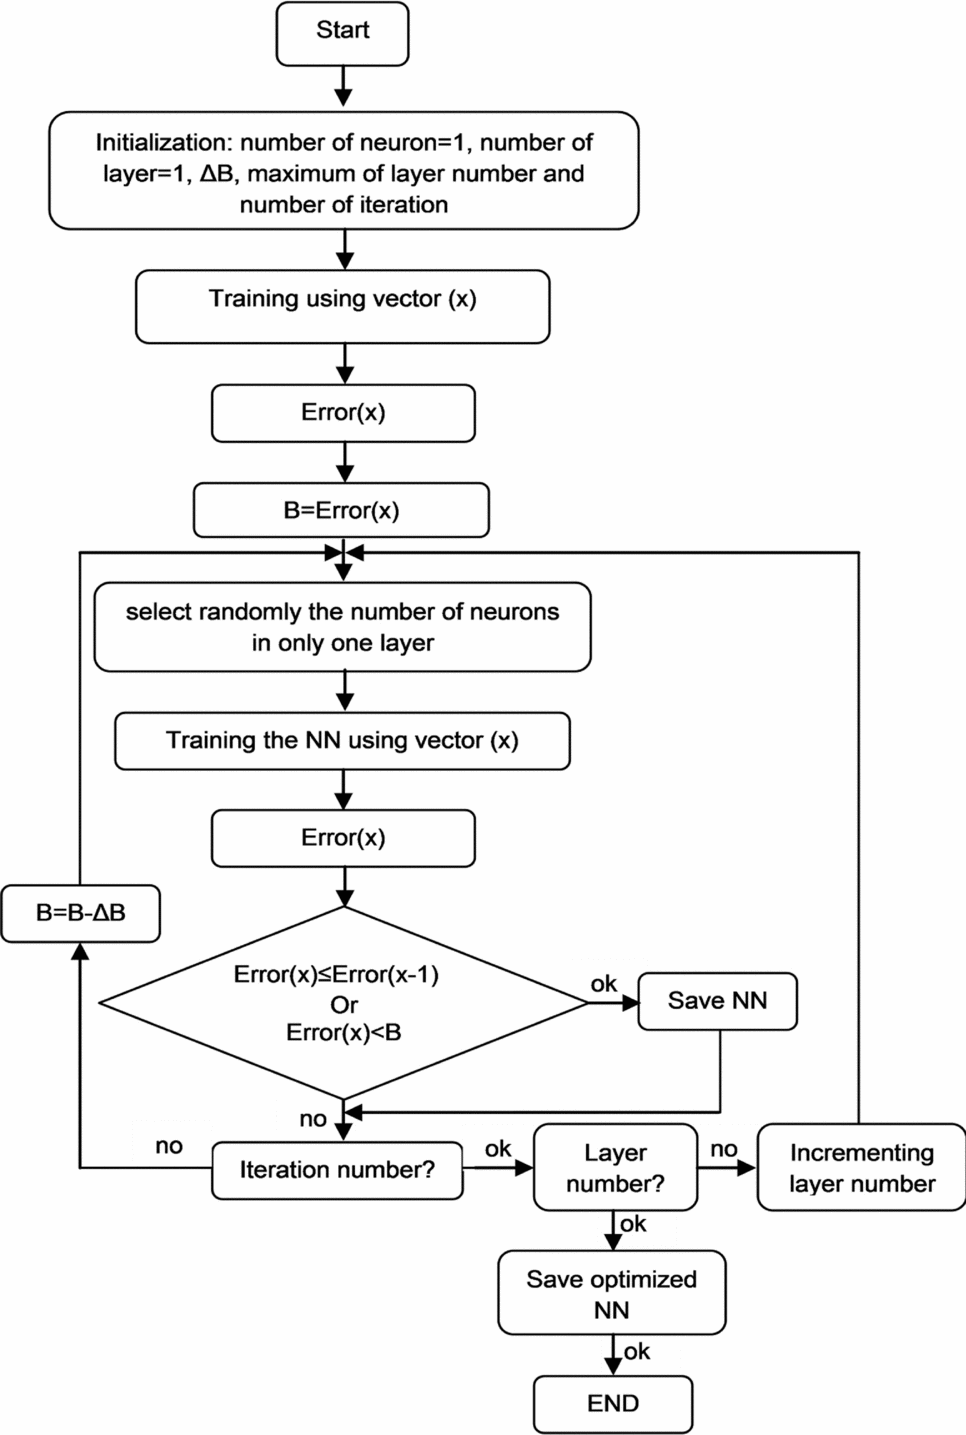
The EGD algorithm is used to obtain the optimal network configuration so that the output error would be as small as possible. The different steps of the approach are presented in Fig. 3. Qualitative performance measures are used to describe the learning abilities of given trained neural networks. The training error is defined as the mean sum of the squared residuals (mean squared error or MSE) of the training data, as follows (Equation (4)):
 $$\begin{equation}
{\rm{Error}} = \frac{1}{N}\sum_{i \in N} {{{({t_i} - {y_i})}^2}} ,
\end{equation}$$
Figure 3. Proposed algorithm.
where ti is the desired value, yi is the estimated output of the recurrent neural networks and N is the number of data points used by the training set.
It is necessary to specify the type of neighbourhood in which the EGD algorithm needs to be adjusted, as shown in Fig. 2, applied to an optimisation NN problem. The research is based on an iteratively feasible solution to another conducted to find a solution to the problem by performing changes in motions in the neighbourhood. During the optimisation process, the number of neurons is restricted to 15 neurons per layer. The NN parameters are chosen and the algorithm is performed as follows:
1) Number of layers = 1
2) Random selection of a number of neurons between 1 and 15
3) Training and testing of the network
4) Number of layers = number of layers + 1
5) One layer is chosen randomly; go to step 2 if the number of iterations has not been reached.
7.0 IMPLEMENTATION OF NN-EGD AND THEORETICAL RESULTS
In this study, two prediction systems are proposed, both based on neural networks. The first (NNPred_1) is used to predict the lift (CL), the drag (CD) and the moment coefficients (CM), and the second (NNPred_2) is used to predict the pressure coefficients (Cp). The inputs parameters for these prediction systems are the angles of attack and the Mach numbers. These systems are described in Fig. 4.

Figure 4. Predictions systems.
7.1 The CL, CD and CM prediction system
The lift (CL), drag (CD) and moment (CM) coefficients are obtained with XFoil to ‘train’ and ‘test’ the NN-EGD_pred1 given in Fig. 4. A number of 101 combinations of angles of attack α between –5° and 5° (0.1° per step), and Mach number = 0.1 (Reynolds number was 539,470) were used. The validation data set and the test data set were around 20% of the database, corresponding to 11 random vectors were used for each.
The optimal architecture obtained using the EGD algorithm is composed of a four-layer feed-forward network. The number of neurons and the transfer functions are presented in Table 1.
Table 1 Neural network architecture for CL, CD and CM prediction

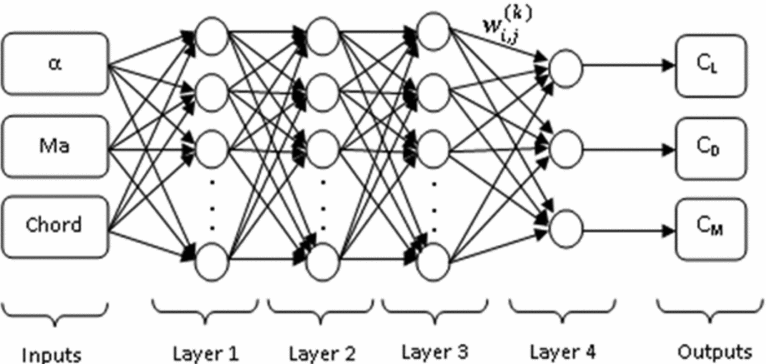
The scheme of the neural networks used to predict aerodynamic coefficients is illustrated in Fig. 5. Let O(k) represent the outputs of layer k, the general formula to calculate the outputs O(k) is as follows (Equation (5)):
 $$\begin{equation}
O_j^{\left( k \right)} = f\left( {\mathop \sum _{i = 1}^n O_i^{\left( {k - 1} \right)}{w_{i,j}} + {b_j}} \right),
\end{equation}$$
Figure 5. Neural Network architecture for the NN-EGD_pred1 model.
where: f is the transfer function;
j is the index of neurons in the layer (k);
n is the number of the neurons in the layer (k-1); and
i is the index of neurons in the layer (k-1).
For layer 1, the transfer function is logarithmic sigmoid and the outputs O( Reference Wrong, Vincent and Lam1) are calculated using Equation (6):
 $$\begin{equation}
\begin{array}{rl} O_j^{\left( 1 \right)} &= logsig\left( {\alpha \times {w_{\alpha ,j}} + Ma \times {w_{Ma,j}} + Chord \times {w_{Chord,j}} + {b_j}} \right)\\ &= \displaystyle\frac{1}{{1 + exp\left[ { - \left( {\alpha \times {w_{\alpha ,j}} + Ma \times {w_{Ma,j}} + Chord \times {w_{Chord,j}} + {b_j}} \right)} \right]}} \end{array}
\end{equation}$$
$$\begin{equation}
\begin{array}{rl} O_j^{\left( 1 \right)} &= logsig\left( {\alpha \times {w_{\alpha ,j}} + Ma \times {w_{Ma,j}} + Chord \times {w_{Chord,j}} + {b_j}} \right)\\ &= \displaystyle\frac{1}{{1 + exp\left[ { - \left( {\alpha \times {w_{\alpha ,j}} + Ma \times {w_{Ma,j}} + Chord \times {w_{Chord,j}} + {b_j}} \right)} \right]}} \end{array}
\end{equation}$$j =1. . .12 (number of neurons in layer 1)
For layer 2, the transfer function is hyperbolic tangent sigmoid and the outputs O( Reference Hunt, Sbarbaro, Zbikowski and Gawthrop2) are calculated as follows (Equation (7)):
 $$\begin{equation}
\begin{array}{rl} O_j^{\left( 2 \right)} &= tansig\left( {\mathop \sum _{i = 1}^{12} O_i^{\left( 1 \right)} \times {w_{i,j}} + {b_j}} \right)\\ &= \displaystyle\frac{2}{{1 + exp\left[ { - 2\left( {\mathop \sum \nolimits_{i = 1}^{12} O_i^{\left( 1 \right)} \times {w_{i,j}} + {b_j}} \right)} \right]}} - 1, \end{array}
\end{equation}$$
$$\begin{equation}
\begin{array}{rl} O_j^{\left( 2 \right)} &= tansig\left( {\mathop \sum _{i = 1}^{12} O_i^{\left( 1 \right)} \times {w_{i,j}} + {b_j}} \right)\\ &= \displaystyle\frac{2}{{1 + exp\left[ { - 2\left( {\mathop \sum \nolimits_{i = 1}^{12} O_i^{\left( 1 \right)} \times {w_{i,j}} + {b_j}} \right)} \right]}} - 1, \end{array}
\end{equation}$$j =1. . .8 (number of neurons in layer 2)
For layer 3, the transfer function is logarithmic sigmoid and the outputs O( Reference Udo3) are determined as follows (Equation (8)):
 $$\begin{equation}
\begin{array}{rl} O_j^{\left( 3 \right)} &= logsig\left( {\mathop \sum _{i = 1}^8 O_i^{\left( 2 \right)} \times {w_{i,j}} + {b_j}} \right)\\ &= \displaystyle\frac{1}{{1 + exp\left[ {\left( {\mathop \sum \nolimits_{i = 1}^8 O_i^{\left( 2 \right)} \times {w_{i,j}} + {b_j}} \right)} \right]}} \end{array}
\end{equation}$$
$$\begin{equation}
\begin{array}{rl} O_j^{\left( 3 \right)} &= logsig\left( {\mathop \sum _{i = 1}^8 O_i^{\left( 2 \right)} \times {w_{i,j}} + {b_j}} \right)\\ &= \displaystyle\frac{1}{{1 + exp\left[ {\left( {\mathop \sum \nolimits_{i = 1}^8 O_i^{\left( 2 \right)} \times {w_{i,j}} + {b_j}} \right)} \right]}} \end{array}
\end{equation}$$j =1. . .9 (number of neurons in layer 3)
Layer 4 represents the output layer and O( Reference Wong, Bodnovich and Selvi4) is a vector equal to (CL, CD, CM); the transfer function used in this layer is linear and the equations of CL, CD, CM are as follows (Equation (9)):
 $$\begin{equation}
\begin{array}{rl} O_j^{\left( 4 \right)} &= \left( {\begin{array}{*{20}{c}} {{C_L}}\\ {{C_D}}\\ {{C_M}} \end{array}} \right) = \displaystyle\mathop\sum _{i = 1}^9 O_i^{\left( 3 \right)} \times {w_{i,j}} + {b_j}\\ \left( {\begin{array}{*{20}{c}} {{C_L}}\\ {{C_D}}\\ {{C_M}} \end{array}} \right) &= \left[ {\begin{array}{*{20}{c}} {\begin{array}{*{20}{c}} {{w_{1,1}}}&{{w_{2,1}}} \end{array} \ldots {w_{9,1}}}\\ {\begin{array}{*{20}{c}} {{w_{1,2}}}&{{w_{2,2}}} \end{array} \ldots {w_{9,2}}}\\ {\begin{array}{*{20}{c}} {{w_{1,3}}}&{{w_{2,3}}} \end{array} \ldots {w_{9,3}}} \end{array}} \right]\left( {\begin{array}{*{20}{c}} {\begin{array}{*{20}{c}} {{O_1}}\\ {{O_2}}\\ \vdots \end{array}}\\ {{O_9}} \end{array}} \right) + \left( {\begin{array}{*{20}{c}} {{b_1}}\\ {{b_2}}\\ {{b_3}} \end{array}} \right) \end{array}
\end{equation}$$
$$\begin{equation}
\begin{array}{rl} O_j^{\left( 4 \right)} &= \left( {\begin{array}{*{20}{c}} {{C_L}}\\ {{C_D}}\\ {{C_M}} \end{array}} \right) = \displaystyle\mathop\sum _{i = 1}^9 O_i^{\left( 3 \right)} \times {w_{i,j}} + {b_j}\\ \left( {\begin{array}{*{20}{c}} {{C_L}}\\ {{C_D}}\\ {{C_M}} \end{array}} \right) &= \left[ {\begin{array}{*{20}{c}} {\begin{array}{*{20}{c}} {{w_{1,1}}}&{{w_{2,1}}} \end{array} \ldots {w_{9,1}}}\\ {\begin{array}{*{20}{c}} {{w_{1,2}}}&{{w_{2,2}}} \end{array} \ldots {w_{9,2}}}\\ {\begin{array}{*{20}{c}} {{w_{1,3}}}&{{w_{2,3}}} \end{array} \ldots {w_{9,3}}} \end{array}} \right]\left( {\begin{array}{*{20}{c}} {\begin{array}{*{20}{c}} {{O_1}}\\ {{O_2}}\\ \vdots \end{array}}\\ {{O_9}} \end{array}} \right) + \left( {\begin{array}{*{20}{c}} {{b_1}}\\ {{b_2}}\\ {{b_3}} \end{array}} \right) \end{array}
\end{equation}$$The NN-EGD are implemented in MATLAB. The obtained results are presented in Figs. 6–8 and Tables 2–4.

Figure 6. Lift coefficient versus angle-of-attack.

Figure 7. Drag coefficient versus angle-of-attack.

Figure 8. Moment coefficient versus angle-of-attack.
Table 2 Lift coefficients variation with the angle-of-attack (XFoil versus NN-EGD results)

Table 3 Drag coefficients variation with the angle-of-attack (XFoil versus NN-EGD results)

Table 4 Moment coefficients variation with the angle-of-attack (XFoil versus NN-EGD results)

The results presented in Figs. 6–8 and in Tables 2–4 show the efficiency of the proposed approach. The error between the obtained values using XFoil and the values predicted by the proposed neural network was of a very low order. The proposed NN-EGD method gave very good results as the error percentages for the lift, drag and moment coefficient did not exceed 0.6%, 1.2% and 2%, respectively.
7.2 The Cp prediction system
The pressure coefficients CP results used to train and test the NN-EGD_pred2 given in Fig. 4 were obtained in XFoil for 11 combinations of angles of attack α and Mach numbers. The angles of attack varied between –5° and 5° (1° per step) and the Mach number was fixed to 0.1, corresponding to Reynolds number of 539470. The NN-EGD results were validated and tested with two random angles of attack, α = –2° and α = 3°. The optimal architecture obtained using the EGD algorithm that gave the best results was composed of a 4-layer feed-forward network. The number of neurons and the transfer functions are presented in Table 5.
Table 5 Neural network architecture for Cp prediction

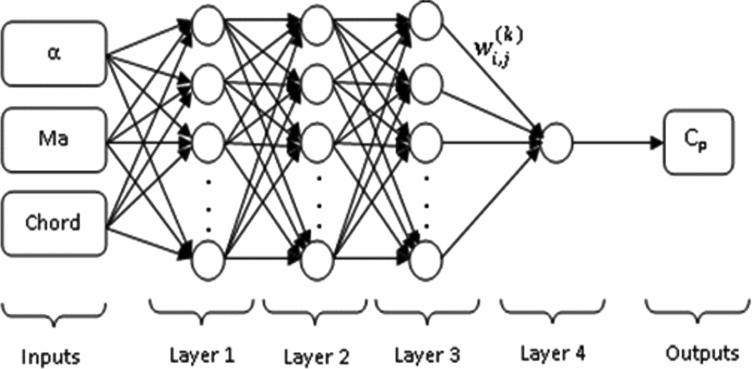
The scheme of the neural networks used to predict pressure coefficients is illustrated in Fig. 9.

Figure 9. Neural architecture of the NN_pred2 model.
The outputs O(k) of each layer k are calculated similarly as the for the outputs of the NN_pred1 model. Layer 4 represents the output layer and O( Reference Wong, Bodnovich and Selvi4) is equal to Cp; the pressure coefficient Cp is calculated as follows in Equations (10)-(13):
Layer 1:
Layer 2:
 $$\begin{equation}
O_j^{\left( 2 \right)} = logsig\left( {\mathop \sum _{i = 1}^{10} O_i^{\left( 1 \right)} \times {w_{i,j}} + {b_j}} \right);\ \ \ \ j = 1...10
\end{equation}$$
$$\begin{equation}
O_j^{\left( 2 \right)} = logsig\left( {\mathop \sum _{i = 1}^{10} O_i^{\left( 1 \right)} \times {w_{i,j}} + {b_j}} \right);\ \ \ \ j = 1...10
\end{equation}$$Layer 3:
 $$\begin{equation}
O_j^{\left( 3 \right)} = tansig\left( {\mathop \sum _{i = 1}^{10} O_i^{\left( 2 \right)} \times {w_{i,j}} + {b_j}} \right);\ \ \ \ \ j = 1...10\
\end{equation}$$
$$\begin{equation}
O_j^{\left( 3 \right)} = tansig\left( {\mathop \sum _{i = 1}^{10} O_i^{\left( 2 \right)} \times {w_{i,j}} + {b_j}} \right);\ \ \ \ \ j = 1...10\
\end{equation}$$Output layer:
 $$\begin{equation}
{O^{\left( 4 \right)}} = {C_p} = \mathop \sum _{i = 1}^{10} O_i^{\left( 3 \right)} \times w_i^{\left( 4 \right)} + {b^{\left( 4 \right)}}
\end{equation}$$
$$\begin{equation}
{O^{\left( 4 \right)}} = {C_p} = \mathop \sum _{i = 1}^{10} O_i^{\left( 3 \right)} \times w_i^{\left( 4 \right)} + {b^{\left( 4 \right)}}
\end{equation}$$The distributions of the CP on the inner and upper surfaces of the ATR42 wing aerofoil are presented in Figs. 10 and 11 for two values of angles of attack.

Figure 10. Pressure coefficient distribution vs the chord for the angle-of-attack α = –2°.

Figure 11. Pressure coefficient distribution vs the chord for the angle-of-attack α = 3°.
In this test, the average percentage error for the pressure coefficients CP is lower than 5%, except at one point on the chord. The experimental results are generally good, as shown in Figs. 10 and 11.
8.0 EXPERIMENTAL TESTS
This section presents the numerical results obtained during testing in the Price-Païdoussis wind tunnel. The goal is to measure the pressures on the upper surface of the aerofoil to determine the pressure coefficients’ distribution and to compare it with the numerical results obtained with both the XFoil code and the proposed algorithm shown in Fig. 3.
8.1 Equipment
This section presents the Price-Païdoussis wind tunnel, the ATR-42 wing model and the pressure transducer systems.
The Price-Païdoussis subsonic blow-down wind tunnel available at the Research Laboratory in Active Controls, Avionics and Aeroservoelasticity (LARCASE) (Fig. 12) was used to realise the testing and validation of our prediction systems. This subsonic wind tunnel is equipped with two test chambers, each with its own characteristics and dimensions. The smaller chamber provides a maximum airspeed of 60 m/s and the larger offers a maximum airspeed of 40 m/s.

Figure 12. Price-Païdoussis wind tunnel.
The wing model used in the wind-tunnel tests is a reduced scale model of the ATR42 aircraft. This model was designed and manufactured in the LARCASE laboratory. Figure 13(a) represents a composite aircraft ATR-42 wing model used for wind-tunnel tests. The upper surface wing is covered by distributed pressure taps, as shown in Fig. 13(b). The locations of these taps were pre-defined to ensure an optimal observation of the changes in the Cp distribution given by the XFoil code. Figure 14 represents the aerofoil of the ATR 42 model.

Figure 13. Model of the composite wing ATR-42.

Figure 14. Aerofoil of the ATR-42 wing.
During these wind-tunnel tests, for experimental validation purposes, three pressure transducers were used to measure the pressure distribution around the ATR-42 aerofoil. The first system was the FlowKinetics transducer; in this transducer, the pressure measurements were obtained at each port, as shown in Fig. 13(b) and were made one at a time, because this transducer was equipped with three sensors of different precisions.
The second transducer was a pressure transducer array (PTA) produced by AEROLAB. This system was equipped with 24 pressure transducer channels to measure the pressure at the same time on all 14 taps on the wing aerofoil.
The third measurement system used in these wind-tunnel tests was the multitube manometer tubes system. This system is equipped with 36 tube tilting manometers to measure pressures taken from the control points on the models in the Price-Païdoussis subsonic wind tunnel. The tubes are filled with coloured water to enhance the data visibility.
9.0 EXPERIMENTAL RESULTS
This section presents the results of experimental tests carried out using the Price-Païdoussis wind tunnel at the LARCASE laboratory. Table 6 summarises the positions of the pressure taps along the chord on the upper surface of the ATR-42 wing aerofoil. Their positions can be observed on the wing in Fig. 13.
Table 6 Location of pressure taps along the chord

During these tests, a FlowKinetics system transducer is used to calculate the static pressure and the total pressure with a pitot tube. Figures 15 and 16 present the results obtained using NN-EGD, using XFoil and experimental wind-tunnel tests (with FlowKinetics system). During the wind-tunnel tests, the Mach number was 0.1 (the corresponding Reynolds number was 539,470) and the angles of attack α were 2.3° and –2°. The pressure coefficient values and the MSE (the error presented in section IV) obtained for these tests are presented in Tables 7 and 8. In these test cases, the NN-EGD gave good results and the obtained MSE is very low.

Figure 15. NN-EGD, XFoil and wind-tunnel tests results (by use of FlowKinetics system) for Cp for the angle-of-attack α = 2.3o

Figure 16. NN-EGD, XFoil and wind-tunnel tests results (FlowKinetics) for Cp for the angle-of-attack α = –2.
Table 7 Cp values residual error between the NN-EGD, XFoil and experimental results for α = 2.3°

Table 8 Cp values residual error between the NN-EGD, XFoil and experimental results for α = –2°

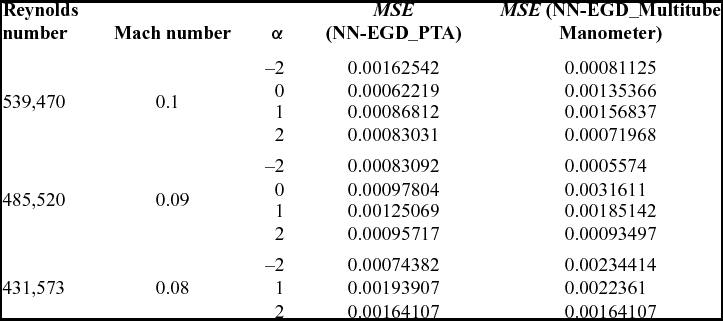
The experimental results using the AEROLAB PTA transducer and the multitube manometer are presented here. Our approach is validated using 11 flight cases. The values of the angles of attack and the Mach numbers of the experimental tests are presented in Table 9. A comparison between the results obtained using NN-EGD and the experimental results is shown in Figs. 17–27. The MSE of the tests are given again in a better format in Table 10. As mentioned in paragraph 3.0, XFoil results cannot match exactly the wind-tunnel results due to the three-dimensional flow effects. Since XFoil aerodynamic analysis were used to train NN-EGD approach, it is possible to have a little difference between Price-Païdoussis wind-tunnel results and the NN-EGD predicted values, mostly close to the transition zone, such as shown in Figs. 20 and 21.
Table 9 Test parameters


Figure 17. NN-EGD and experimental results (PTA & Multitube manometer) of Cp for angle-of-attack α=0° and Reynolds number=539470.

Figure 18. NN-EGD and experimental results (PTA and multitube manometer) of Cp for angle-of-attack α = 0° and Reynolds number = 485,520.

Figure 19. NN-EGD and experimental results (PTA and multitube manometer) of Cp for angle-of-attack α = 1o and Reynolds number = 539,470.
Table 10 The residual error between the NN-EGD method and the experimental results


Figure 20. NN-EGD and experimental results (PTA and multitube manometer) of Cp for angle-of-attack α = 1° and Reynolds number = 485,520.

Figure 21. NN-EGD and experimental results (PTA and multitube manometer) of Cp for angle-of-attack α = 1° and Reynolds number = 431,573.

Figure 22. NN-EGD and experimental results (PTA and multitube manometer) of Cp for angle-of-attack α = 2° and Reynolds number = 539,470.

Figure 23. NN-EGD and experimental results (PTA and multitube manometer) of Cp for angle-of-attack α = 2° and Reynolds number = 485,520.

Figure 24. NN-EGD and experimental results (PTA and multitube manometer) of Cp for angle-of-attack α = 2° and Reynolds number = 431,573.

Figure 25. NN-EGD and experimental results (PTA and multitube manometer) of Cp for angle-of-attack α = –2° and Reynolds number = 539,470.

Figure 26. NN-EGD and experimental results (PTA and multitube manometer) of Cp for angle-of-attack α = –2° and Reynolds number = 485,520.

Figure 27. NN-EGD and experimental results (PTA and multitube manometer) of Cp for angle-of-attack α = –2° and Reynolds number = 431,573.
10.0 CONCLUSIONS
This work presents a new combined methodology of neural networks and extended great deluge methods (NN-EGD) used in network prediction. Different cases were used to test the performance of the approach; 11 theoretical test cases were used to predict the CD, CL and CM coefficients, and 2 other tests cases were used to predict pressure coefficients. The theoretical results were acceptable and they could be further improved. The average percentage error did not exceed 0.6% for lift CL, 1.2 % for drag CD and 2% for the moment CM coefficient. The average percentage error for the pressure coefficients CP was lower than 5%, except for a few points on the chord. To verify the quality of the pressure coefficients predicted by the NN-EGD method, the obtained results were compared to 11 experimental test case results. These experiments were conducted using the Price-Païdoussis subsonic blow-down wind tunnel and the 3 measurement systems at the LARCASE laboratory. The obtained results were very good and the mean squared error (MSE) did not exceed 3.10–3 for all of the test cases. Based on these theoretical and experimental tests, the proposed NN-EGD approach was found to be a good flight parameter prediction system for the ATR42 wing aerofoil. Future research could evaluate the performance of this approach on the morphing ATR-42 wing aerofoil and other aerofoils.
ACKNOWLEDGEMENTS
Thanks are due to Professors Michael Païdoussis and Stuart Price for the donation of their subsonic blow-down wind tunnel to Professor Ruxandra Mihaela Botez at the LARCASE laboratory at ETS. Special thanks are also dues also to Mr. Oscar Carranza Moyao and to Mrs. Odette Lacasse from ETS. This project received funds from the Canada Research Chair Program in Aircraft Modelling and Simulation Technologies.


