Nomenclature
Abbreviations
- CAD
computer aided design
- CFD
computational fluid dynamics
- FEA
finite element analysis
- HP
high pressure
- HPC
high pressure compressor
- IP
intermediate pressure
- IPT
intermediate pressure turbine
- LHM
latent heat of melting
- LP
low pressure
- NGV
nozzle guide vane
- NRT
non-dimensional rotational speed
- SAS
secondary air system
- VOL
volume
Symbols
- A
contact area (m2), rotor gas path area (m2)
- C
heat capacity (J/kg K)
- D
diameter (m)
- F
force (N)
- Q
SAS heat transfer term (J/s)
- f
pipe friction coefficient
- h
enthalpy per unit mass (J/kg)
- k
thermal conductivity (W/m2 K)
- L
length (m)
- ṁ
mass flow rate (kg/s)
- P
pressure (Pa)
- q
friction flux (W/m2)
- R
radius (m)
- Re
Reynolds number
- t
time (s)
- T
temperature (K), torque (N m)
- U
velocity of disc (m/s)
- V
velocity (m/s), rotor absolute velocity (m/s)
- W
turbine power (J/s)
- α
absolute flow angle (deg)
- β
heat partition ratio
- γ
specific heat ratio
- η
efficiency
- μ
friction coefficient
- ρ
density (kg/m3)
- ω
angular speed (rad/s)
Subscripts
- Ax
axial
- in
flow entering to the pipe
- o
total
- out
flow exiting the pipe
Superscripts
- ‘
Isentropic
- n
number of pipe connections
- t
time
1.0 INTRODUCTION
The release of high-energy material from an aero-engine casing must be prevented to ensure both aircraft and passenger safety. Following a shaft failure, the turbine and compressor become decoupled, allowing the turbine to accelerate due to the sudden loss of load and the continued extraction of power from the gas flow. Upon disconnection of the turbine and compressor, and according to the bearing arrangement and break location, the force can dislocate the free-running turbine. With the dislocation, the rotor comes into contact with the stationary parts. The system benefits from the friction generated at the contacts which creates a counter torque to reduce acceleration. In case the acceleration cannot be stopped, possible hazardous consequences of an overspeed include blade release, disc burst, the liberation of high energy debris from the engine’s structure and fire due to secondary damage to the internal engine oil/piping systems. The event summary and the loads acting on the rotor, namely axial force and gas torque are sketched in Fig. 1.
Several shaft failure and overspeed incidents have been reported in open literature. The shaft tends to fail due to localized weakening, however, the root-cause may go back to factors such as unforeseen wear of materials, end of life due to fatigue loading and manufacturing non-conformance. In 2008, during a Canadian North airline flight, a Boeing 737-217 sustained an engine power loss with fire during a landing( 1 ). While one of the Pratt & Whitney JT8D-17A engines failed, all debris and fire were contained and the aircraft was able to land safely. Investigators found that due to wear of a roller bearing the radial constraint on the LP shaft was reduced, resulting in excessive LP shaft flex. Seven failures out of 11 reported on this engine type were caused by this failure mechanism, as reported by Pratt & Whitney. In 2006( 2 ), a Boeing 767-223(ER), fitted with GE CF6-80A engines, suffered an uncontained HPT disc failure on engine one. The root cause was found to be a dent, causing a fatigue crack to propagate from rim to bore. Engine one was split into two by the HPT disc departing in sections, with one of these sections embedding into engine number two. This event occurred at a ground run near nominal speed; however, similar hazardous conditions can also be seen as an uncontained disc burst during an overspeed event following a shaft failure.
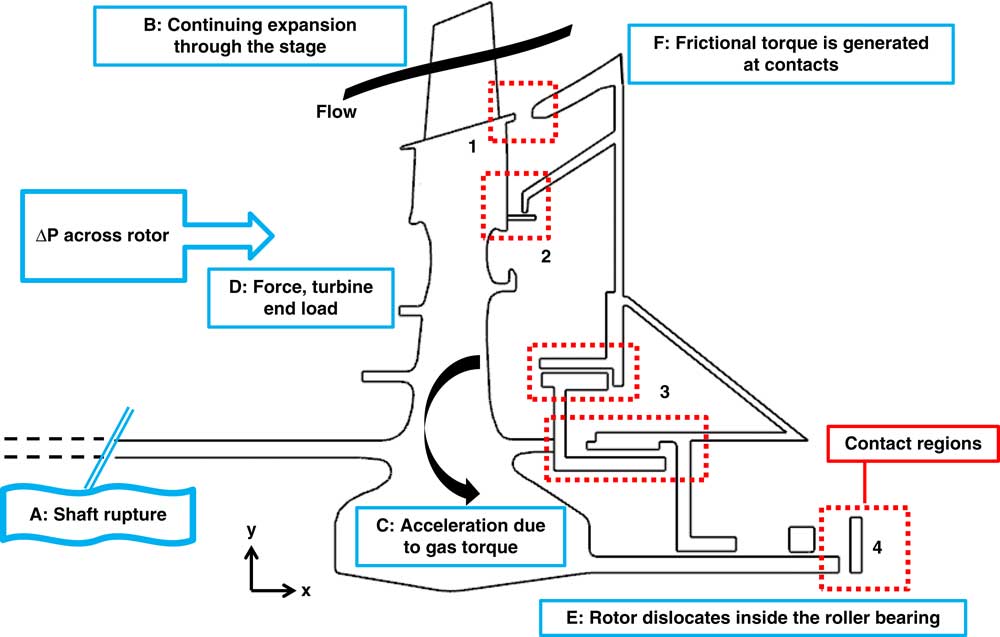
Figure 1 Notional turbine assembly and event summary.
There are several detection methods, design choices and modelling approaches that can be applied to an engine regarding shaft failure and overspeed prevention. To produce a fail-safe environment requires implementation of speed limiting mechanisms in a multi-disciplinary approach, integrating control systems, structural mechanics and aero/thermodynamics. A detection system is proposed by Mons( Reference Mons 3 ) to be used in Snecma engines. A temperature sensor, fixed to a static part, is located immediately downstream of the turbine rim. The sensor is embedded under a ceramic mass to be protected from the hot gases during normal operation. When the shaft is broken, the turbine moves downstream and the rim contacts the ceramic mass to create friction. When the measured temperature by the embedded sensor inside the ceramic mass exceeds a predetermined value, indicating that a shaft failure has occurred, the engine control system shuts fuel flow to the engine to limit power available to the potentially overspeeding turbine. In 2007, the shaft of a General Electric CF6 starter motor, fitted to an Airbus A330-300, suffered an unlocated failure( 4 ). Air turbine starter rings were designed to separate the blades from the disc in case of an unlocated failure, which would result following rearward axial movement. In this situation, the blades were successfully cut from the disc, preventing overspeed and disc burst. However, the blades skid along the shroud, hitting only the edge of the containment ring and were able to penetrate through the containment ring and damage nearby locations in the engine. The actions taken by the engine manufacturer were the redesign of the cutter ring to enhance cutting efficiency and minimise rearward dislocation, larger containment ring pocket design to capture the cut blades after downstream movement, and a weaker stator shroud allowing penetration of the blades to be captured in the containment pocket.
Gonzalez and Pachidis( Reference Gonzalez and Pachidis 5 ) modelled blade tangling and obtained friction correlations using a series of design of experiments carried out using LS-DYNA finite element software. The correlations were applied to a test engine where the aggressive friction generated by clashing of blades was enough to decelerate the overspeeding turbine. It is reported that turbine torque and rotor pressure differential used to calculate the axial force were taken from experimental data. Haake et al.( Reference Haake, Fiola and Staudacher 6 ) presented a shaft failure simulation methodology based on the integration of component performances and friction characteristic behaviour between structures. The compression system performance calculations were validated using experimental observations: a slam acceleration test for pre-stall operation and a fuel spiking test for post-stall operation. Turbine capacity was read from a graph as a function of the turbine exit total pressure to ambient pressure ratio. A tip clearance loss model was applied to account for turbine performance loss due to downstream axial movement. The axial movement of the rotor was calculated by a solid melting approach that takes into account heating and melting of the structures. The frictional energy generated by the contact between the rotor and the stationary structures is converted to increase in material enthalpy to calculate a melt removal rate. The axial force on the turbine was calculated by scaling the steady-state load with the time evolution of the turbine pressure ratio. The methodology was verified against experimental results from an intermediate pressure shaft failure that occurred on a three-spool engine, and was subsequently applied to the simulation of a shaft failure on a two-spool engine.
Proper handling of the secondary air system thermal and flow characteristics provides better understanding of the rotating and stationary structure behaviour. Controlling thermal growths, seal clearances, flow leaks through seals and bearing end loads result in increased performance and reliability of the engine environment. Secondary air system effects for steady and transient engine operation have been studied in the past, where Muller( Reference Muller 7 , Reference Muller 8 ) applied a coupled fluid network and thermomechanical simulation to calculate the losses, clearance changes and mass flows across network seals. The secondary air system is represented by a one-dimensional lumped network and the results were reported to be in agreement with MTU Aero Engines internal air system program. The coupling of a fluid network and a thermomechanical model was done using CalculiX. The lumped network utilized correlations for the heat transfer and the flow through secondary system elements. The fast lumped system information was fed to the structural model and the iterative process yielded to a turbine assembly ensuring the properties at steady-state operation. Ganine et al.( Reference Ganine, Javiya, Hills and Chew 9 ) studied the fluid cavities that surround the high-pressure turbine of a three-spool engine using a coupled FEA-CFD analysis to look at thermal behaviour of the turbine assembly. The Rolls-Royce codes, SC03 and HYDRA, were used for thermal and CFD calculations, respectively. The CFD solution of the internal air system surrounding the high-pressure rotor provided a detailed resolution of the temperature profiles for steady and transient operation. The thermal characteristics obtained by the conjugate heat transfer method can support the fast lumped network systems which rely on correlations for the calculation of clearances depending on rotating and stationary structure thermal growths. Together with the gas path CFD simulations, this kind of high-fidelity applications provide detailed information to the whole engine steady and transient thermomechanical simulations to ensure engine performance.
The scope of this paper is to obtain a methodology incorporating a secondary air system network with a turbine performance and a frictional method to model a failure case. A one-dimensional lumped secondary air system including the high-pressure and the intermediate-pressure air networks of a modern three-spool turbofan is verified against intact operation and run in transient in an integrated environment to calculate the turbine end load under the effect of the secondary air system transients. The global target of the study can be listed as to develop a method to be used as a standalone tool for overspeed prediction, to provide boundary conditions of a post-shaft failure explicit thermomechanical analysis with finite element software and to investigate different engine architectures to maximize the friction to arrest turbine overspeed by exploiting turbine end load.
2.0 TURBINE OVERSPEED DESIGN SPACE
Basic considerations in an unlocated shaft failure are the gas torque, which is accelerating the turbine, and the frictional torque, which acts against the gas torque to decelerate the rotor. Possible solutions to limit turbine acceleration, as described in the EASA standards( 10 ), include disc rubbing, blade interference and blade shedding and spragging. Disc rubbing occurs between parts of the disc within the secondary air system network rubbing against stationary structures to generate friction torque. The other three methods can also be used to both create friction and reduce gas torque through blade damage. Blade interference or blade tangling is the axial interaction of the blades with the downstream vanes or platforms. Blade shedding involves rupture of blades and their containment within the casing while blade spragging is the partial distortion of blades during their interaction with the casing, i.e. an increase in tip clearance by the destruction of blade tips.
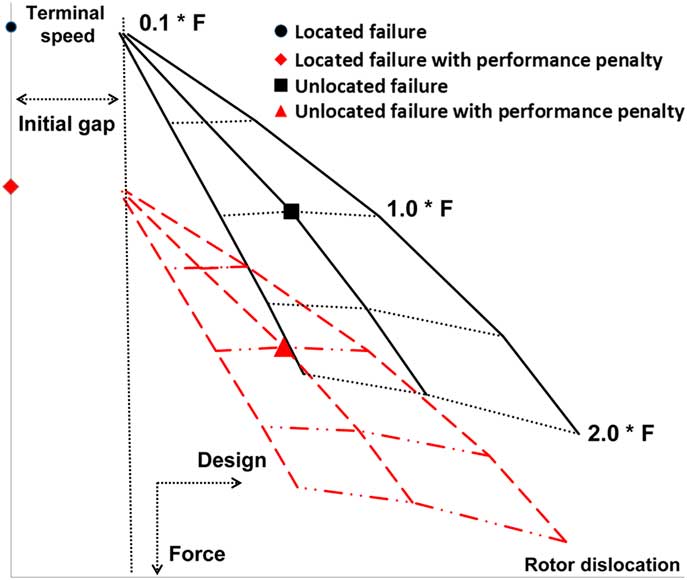
The behaviour of a turbine overspeed event is described in Fig. 2. This is obtained for a particular high-pressure turbine geometry, taking into account disc rubbing and blade interference. The y-axis is the terminal speed of the rotor and the x-axis is the axial location of the unlocated turbine. In the case of a positive net axial force, the rotor travels the free distance between the rotor intact position and the rearward stationary structure. Increasing the axial force promotes friction generation in the system and so terminal speed reduces. If the architecture of the stationary structures is such that the radius of contact increases, i.e. a rising-line turbine, frictional torque is promoted through the change in radius since it is a function of both the force and the radius. This describes the shape of the solid lines in Fig. 2, with increasing negative gradient with rotor dislocation. Different solid lines represent different stationary structure arrangements, and dashed lines are force isolines. The reference force is given as 1.0*F and represents the average turbine end load in time after a shaft failure. For a given stationary arrangement, the terminal speed decreases with the increase in time average turbine end load. However, a design providing higher dislocation will also result in lower terminal speed for a given force. This effect is more visible, especially after the 1.0*F isoline. The highest terminal speed occurs for a located failure, in which the bearing arrangement does not allow free movement of the turbine when decoupled from the compressor.
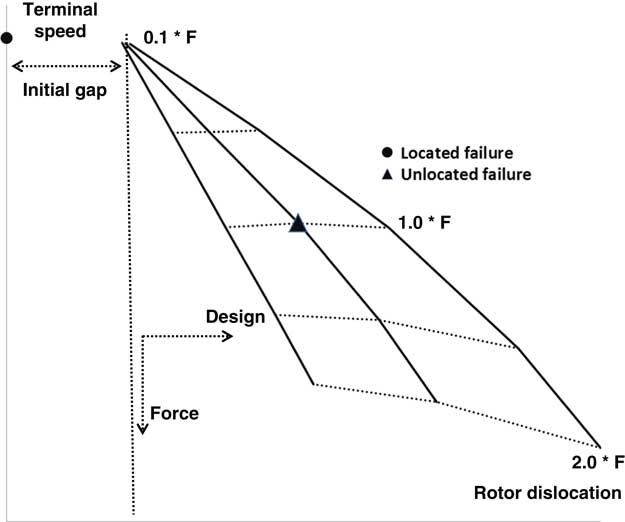
Figure 2 Design space considering turbine overspeed.
The solid arms of the triangular surface represent different turbine assembly designs. Taking the middle line as a reference, the left-hand side design has more metal and so it does not allow dislocation for a given turbine end load. Similarly, the right-hand side design line has less metal to allow a higher dislocation rate for a given end load. Change in contact thickness and radius result in the shift in design curves. Additionally, a totally different turbine assembly with reoriented stationary parts, i.e. axial reorientation, can also shift the solid design lines.
3.0 METHODOLOGY
As mentioned previously, the few attempts to model shaft failure that has been reported in the open literature have used either experimental measurements or scaling of steady-state values for the axial force acting on the turbine used to calculate the friction between rotating and static components. Due to change in turbine performance, i.e. distortion of velocity triangles resulting in turbine capacity change, secondary air system (SAS) transients resulting from rotor dislocation; the assumption of scaling intact steady-state force values based on the operating condition of the turbine is not strictly valid, therefore, an updated method is required for when experimental values are not available. The novel approach in the present study is to add the capability of capturing secondary air system dynamics during the transient shaft failure and overspeed simulation. A coupled tool is created that combines a secondary air system model, a turbine performance model and a friction model.
The secondary air system network used in this study is a one-dimensional model including reservoirs and pipes with effective flow areas. Matching of the network, in terms of tank pressures and temperatures, is carried out in steady-state against a more comprehensive validated model. All sub-components of the model, in terms of basic transient capability, have been validated individually and reported in previous publications. Within the friction model, the frictional power generated between structures in contact is converted to rotor axial displacement using a solid melting formulation which considers continuous removal of the melt. The generated friction is subtracted from the gas torque to obtain the rotational speed evolution, and the axial displacement is passed to the secondary air system to update the axial load on the rotor structure. Rotor gas torque is calculated using a simplified performance model based on a meanline analysis and penalized according to CFD-based coefficients, accounting for performance degradation due to axial movement and overspeed.
3.1 SASmethodology
The secondary air system is modelled using a transient one-dimensional network of tanks and pipes. Time-dependent boundary conditions are imposed at boundary nodes, which are placed at interface locations between the main gas path and the secondary air system, with total pressure and temperature imposed at network inlets and static pressure imposed at network outlets. Boundary conditions are taken from an intact high-power engine surge which can be representative of post-shaft failure engine conditions. Component transient behaviour has been previously validated against experimental data from the public domain( Reference Gallar, Calcagni, Pachidis and Pilidis 11 , Reference Gallar, Calcagni and Pachidis 12 ). Cavity volumes, pipe areas and component failure locations are coupled to the friction tool to become a function of axial displacement, with necessary information being extracted from a CAD model.
Pipe pressure loss is given in Equation (1), where the Darcy friction coefficient( Reference Mishra 13 ) is given by Equation (2) for laminar flow and given by Equation (3) by Nikuradse( Reference Mishra 13 ) for turbulent flow. The diameter term is also converted to hydraulic diameter to handle non-circular cross-sectional pipes:
 $${\rm \Delta P}{\equals}{\minus}{1 \over 2}.{\rm \rrho }.{\rm V}^{2} .{{\rm L} \over {{\rm D}_{{{\rm hydraulic}}} }}.{\rm f}$$
 $${\rm f}{\equals}{{64} \over {{\rm Re}}}$$
 $${\rm f}{\equals}0.0032{\plus}{\rm }{{0.221} \over {{\rm Re}^{{0.237}} }}$$
Reservoir pressure is calculated according to Equation (4), with the heat transfer term q corresponding to the convection within rotating cavities and the internal cooling of nozzle guide vanes:
 $${\rm P}^{{{\rm t}{\plus}1}} {\equals}{\rm P}^{{\rm t}} {\plus}{{{\rm \Delta t}} \over {{\rm VOL}}}\left( {\left( {{\rm \rgamma }{\minus}1} \right).\left[ {{\rm Q}{\plus}\mathop{\sum}\limits_{{\rm i}{\equals}1}^{\rm n} \dot{\rm m}_{{{\rm in}}} .{\rm h}_{{{\rm in}}} } } \right]{\plus}{\rm \gamma }\mathop{\sum}\limits_{{\rm i}{\equals}1}^{\rm n} {{\dot{ \rm m}}_{{{\rm out}}} .{{{\rm P}^{{\rm t}} } \over {{\rm \rrho }^{{\rm t}} }}} } \right)$$
The secondary air system is constructed and verified against the Rolls-Royce SPAN code, an in-house developed air system network tool. With volumes of tanks and lengths of pipes extracted from CAD geometry, connections are made between tanks neglecting connections with a mass flow less than a given cutoff. The cutoff is determined arbitrarily, set to 0.05 kg/s in the present model, which represents no more than 1% of the total secondary flow in any network. This simplification reduces the complexity of the network by an order of magnitude, which is not significant in terms of overall network matching for the present purpose of studying shaft failure scenarios. The model is then aligned to SPAN results in steady-state, with resulting errors shown in Figs 3 and 4. Pressures and temperatures in all tanks are within 4%, with important tanks either side of the turbine disc within 1% for pressure since this controls the axial force. Matching is achieved through the modification of pipe areas, starting from an initial calculated value from the known mass flow and pressure drop through a given connection. Modifications are necessary since the full range of components is not modelled, hence there are some differences that arise. The obtained areas are re-scheduled to be used in the coupled transient analysis according to the dislocation of the turbine and the resulting change in geometry.

Figure 3 Network pressure error.

Figure 4 Network temperature error.
3.2 Frictiontorquecalculation
The friction torque is made up of disc rubbing, between the rotating turbine and stationary structures, and blade interference, which occurs between the turbine rotor and the downstream NGV platform. Friction is calculated using a friction clutch approach, whereby the pressure is assumed to be distributed inversely with radius across the contact surface and the corresponding frictional torque is calculated.
The axial dislocation rate is adopted from a model proposed by Carslaw and Jeager( Reference Carslaw and Jaeger 14 ). This approach considers melting of the solid at the contact interface with continuous removal of the melt. The friction model uses a criterion to heat and melt the material for a given amount of axial movement, the assumptions in this model are listed below:
∙ The surfaces in contact are at a constant representative solid temperature, T solid.
∙ Friction coefficient is constant and the magnitude corresponds to a condition where a melted liquid film exists between the contact interfaces.
∙ The model considers the contact surface as a rubbing ring so that the contact interface is assumed to be at right angles to the axial movement.
Assuming one-dimensional heat transfer without radiation and surface convection heat transfer, the heat equation is given by Equation (5). The heat source, which is the friction generated at the interface, moves with the velocity U in the x-direction. So the flux term, Equation (6), includes a conductive and a convective term. The frictional power is large and the interface temperatures quickly reach the melting temperatures, so a quasi-stationary heat flow is assumed. Removing the time derivative at Equation (7), the steady temperature distribution is given in Equation (8) with the boundary conditions at Equations (9), (10) and (11):
 $$\rrho .\rm c.{{\rm \partial \hskip1pt{\rm T}} \over {\rm \partial {\rm t}}}{\plus}{{\partial ({\rm flux})} \over {\partial {\rm x}}}{\equals}0$$
 $$\rm flux_{x} {\equals}{\minus}{\rm k}{{\partial {\rm T}} \over {\partial {\rm x}}}{\plus}\rrho .c.T.U$$
 $${{\partial {\rm T}} \over {\partial {\rm t}}}{\minus}{{\rm k} \over {{\rm \rrho }.{\rm c}}}.{{\partial ^{2} {\rm T}} \over {\partial {\rm x}^{2} }}{\plus}{\rm U}.{{\partial {\rm T}} \over {\partial {\rm x}}}{\equals}0$$
 $${\rm T}{\equals}{\rm T}_{{{\rm solid}}} {\plus}\left( {{\rm T}_{{{\rm melt}}} {\minus}{\rm T}_{{{\rm solid}}} } \right).{\rm e}^{{{{{\minus}{\rm U}.{\rm x}.{\rm p}.{\rm c}}. \over {\rm k}}}} $$
 $${\minus}{\rm k}{{\partial {\rm T}} \over {\partial {\rm x}}}{\equals}{\rm q}_{{{\rm friction}}} {\minus}{\rm LHM}.{\rm U}\quad {\rm \,@\,}\,{\rm x}{\equals}0$$
 $${\rm T}{\equals}T_{m} \quad {\rm \,@\,}\,{\rm x}{\equals}0$$
 $${\rm T}{\equals}T_{{\rm solid}} \quad {\rm \,@\,}\,{\rm x}{\equals}\infty$$
With this steady temperature distribution, Equation (8), the flux into the solid is zero as the melted material is centrifuged from the interface as it is formed. The power available per unit area is equal to its rate of removal. With the temperature condition at the friction source in Equation (10), the velocity of the friction interface can be found by inserting Equation (8) into the boundary condition (Equation (9)). As the melt is formed, it is removed and the axial location is updated accordingly. Gonzalez( Reference Gonzalez 15 ) and Haake et al.( Reference Haake, Fiola and Staudacher 6 ) utilized this approach in their shaft failure analysis to calculate the axial movement of the unlocated turbine test and the overspeed track of the unlocated intermediate pressure turbines utilizing friction torque reported to be in agreement with the experimental overspeed track.
The friction flux, defined as the frictional power generated per contact area, is given in Equation (12). This flux is the source used to heat and melt the material during platform rubbing. The velocity equation used to calculate the axial movement of the disc is given in Equation (13). The latent heat of melting (LHM) parameter is defined as the latent heat per unit volume (J/m3) required to melt the material at the melting temperature, T melt. The β term in Equation (13) represents the heat partition between the surfaces that are in contact. This value changes from 0 to 1, with a value of 0.5 corresponding to half of the heat going to the static part and the other half to the rotating part. Barber( Reference Barber 16 ) provided a condition for the heat partition as given in Equation (14):
 $${\rm q}_{{{\rm friction}}} {\equals}{{{\rm F}_{{{\rm axial}}} .{\rm R}_{{{\rm contact}}} .{\rm \rmu }.{\rm \romega }} \over {{\rm A}_{{{\rm contact}}} }}$$
 $$\left[ {{\rm \rrho }.{\rm c}.\left( {{\rm T}_{{{\rm melt}}} {\minus}{\rm T}_{{{\rm solid}}} } \right){\plus}{\rm LHM}} \right].{\rm U}{\equals}{\rm q}_{{{\rm friction}}} .(1{\minus}{\rm \rbeta })$$
 $${\rm \rbeta }{\equals}{{{\rm q}_{{{\rm friction}\_1}} } \over {{\rm q}_{{{\rm friction}\_2}} }}{\equals}{{{\rm \rrho }_{1} .{\rm C}_{1} .\sqrt {\rm k} _{1} } \over {{\rm \rrho }_{2} .{\rm C}_{2} .\sqrt {\rm k} _{2} }}$$
Contact points between the unlocated turbine and rearward stationary structures are localised in four main regions. The first contact region includes the rotor blade to NGV platform interference and rotor shank to NGV platform. The second contact region occurs between the rotor retention plates and the stationary knife seal. The third region includes rotor triple seal contacts namely outer and inner triple seals. The fourth region includes contact between the shaft and the bearing chamber assembly, which occurs at a very low radius. These contact regions are summarised in Fig. 1.
During multiple contacts, the net force acting on the turbine assembly is distributed among all contacts to provide equal frictional power per unit area at each contact. The interference regions which are prone to create discontinuous wear due to impact failures are not considered to disturb force distribution so the disc is assumed to move according to the velocity equation where there is disc rubbing. The equal frictional power per unit area is the natural outcome of using a pressure distribution inversely proportional to the radius and results in equal wear progression (Fig. 4).
Friction coefficient depends on rig testing and represents an average value. This value is constant at the contact region during the analysis. Implementation of the friction model requires specification of the contact area and radius, which is extracted directly from CAD geometry. Assuming the rotor wheel is rigid and considering only the erosion of the static part, the contact area and the radius can be extracted at each axial position by translation of the rotor body within the CAD model. Necessary information is obtained by intersecting the rotating and static parts, as demonstrated in Fig. 5. This radius and area database is then used as an interpolation table within the calculation.
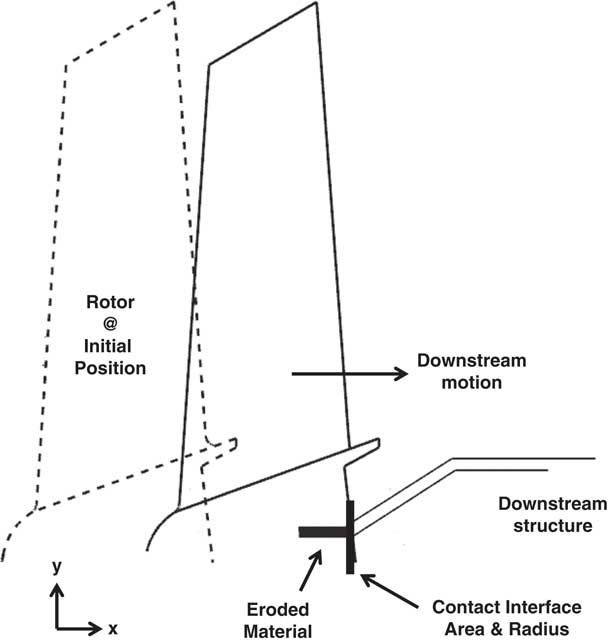
Figure 5 Schematic of geometry analysis of the friction method.
In real cases, the use of different materials, temperatures and velocities can change the frictional behaviour and the wear characteristics. Erosion in the rotating part will also cause changes in the contact radius and the area to affect the load distribution among the contacts. A lower strength material can fail sooner than a higher strength material or one material may be softer than the other due to the difference in thermal behaviour. Apart from these, the way that structures are designed, i.e. shapes and support locations, can also affect the system behaviour. Lefebvre and Durocher( Reference Lefebvre and Durocher 17 ) proposed a turbine section to be used in the passive control of overspeed in Pratt & Whitney engines. In the proposed architecture, the stationary parts are weakened in the axial direction. These parts are frangible and they are designed to break or deform easily when they are exposed to an axial force. On the other hand, Soupizon( Reference Soupizon 18 ) gives an example of structures, which are oversized in thickness, to be capable of cutting through the blades of a dislocating rotor to secure the disc from bursting in Snecma engines. When different design features of the assembly are considered, assuming identical materials, a constant friction coefficient and a rigid rotor assumption can provide a reasonable reference point, especially for design applications.
3.3 Turbineperformancemodel
Gas torque acting on the turbine rotor is calculated using a meanline analysis. Time evolution of turbine inlet total pressure is taken from an intact engine high-power surge test, representing post-stall conditions during a shaft failure. The following assumptions are then made during calculation of the torque:
∙ Turbine total to total pressure ratio is constant.
∙ Turbine total to total isentropic efficiency is constant.
∙ Effect of cooling mass flow rate is not taken into account in mass flow conservation.
∙ Rotor inlet flow is at zero incidence and exit flow has zero deviation.
From the assumed total to total pressure ratio, the total temperature drop across the rotor is calculated using Equations (15) and (16). The gas power can then be obtained using the steady one-dimensional energy equation, with the torque being obtained by dividing by the rotational speed. Calculation of the axial force across the rotor is split into two components, the pressure and momentum force, for which static properties at both rotor inlet and outlet are required. Applying the principle of angular momentum to the rotor, Equation (17), and iterating with the mass conservation equation, Equation (18), static properties across the rotor can be calculated. Station 1 designates rotor inlet and 2 designates rotor outlet( Reference Saravanamuttoo, Rogers and Cohen 19 ):
 $${{p_{{\rm o,1}} } \over {P_{{\rm o,2}} }}{\equals}\left( {{{T_{{\rm o,1}} } \over {T_{{0,2}}^{\prime} }}} \right)^{{{\rgamma \over {\rgamma {\minus}1}}}} $$
 $$\reta {\equals}{{T_{{0,1}} {\minus}T_{{0,2}} } \over {T_{{0,1}} {\minus}T_{{0,2}}^{\prime} }}$$
 $$W_{{\rm turbine}} {\equals}\dot{m}.\romega .\left( {R_{2} .V_{2} .\sin \ralpha _{2} {\minus}R_{1} .V_{1} \sin \ralpha _{1} } \right)$$
 $$m{\equals}\rrho .V.\cos \ralpha .A$$
The gas torque calculation based on the work equation described above considers the turbine as intact. During a real event, the turbine will accelerate and dislocate, changing rotor incidences, tip clearances and cooling mass flow rates. For this reason, the performance is penalized as a function of rotor dislocation and rotor speed. The performance penalty is applied as a scaling factor during the analysis with the magnitude of the factor coming from a parallel activity aimed at characterizing the turbine as a function of axial displacement( Reference Pawsey, Rajendran and Pachidis 20 – Reference Pawsey, Rajendran and Pachidis 22 ). This work was aimed at providing full overspeed characteristics of a high-pressure turbine during an unlocated shaft failure, and was based on steady CFD. The CFD model extends from HPT NGV inlet to IPT rotor outlet, and includes the trailing edge slot flow on the HPT NGV, important as it influences the capacity of the NGV, the tip seal arrangement on the HPT and the rim seal flow of the HPT rotor. The rim seal flow is defined by the output of the secondary air system model during this event, to provide a realistic assessment of the mass flow and temperature. Aside from these features, other cooling flows are neglected due to model complexity and the high number of simulations required to fully characterize the performance over the full engine operating range. In future studies, these could be included; however, care must be taken as turbine dislocation will disrupt the pre-swirl feed to the base of the rotor blade, which will limit the mass flow to the internal cooling passages. Three axial locations were studied by moving the turbine rotor rearward, with the turbine characterized for a range of speeds, 100–200% NRT, and a range of pressure ratios in each location. The torque maps were provided to this study in a non-dimensional form, having been divided by a reference state torque. As described in the above references, the CFD model was validated at nominal operating conditions, since the isolated performance of a turbine in these extreme off-design conditions was not available. Further validation should be carried out looking at the global performance of the engine, which would indirectly validate the generation of such characteristics in this way. A qualitative description of the performance penalty is given in Fig. 6. Since the calculated gas torque at each timestep is lower when compared with the previous intact state, the terminal speed is reduced. The available power at the friction interface is lower and so the rotor dislocates less with respect to the intact case since the flux required to heat and melt the material at the contact interface is lower.

Figure 6 Effect of turbine performance penalty on overspeed design space.
After each calculation step, the force as a result of pressure and momentum changes is added to the force acting on the disc region. The total force is then distributed among the contacts with frictional force calculated as the product of the friction coefficient and the force available at the contact. Friction torque is obtained by calculating the moment of the force around the rotation centre, with the new rotational speed for the next timestep being calculated from the momentum equation given in Equation (19). This is based on a simple Euler integration, with the timestep affecting solution accuracy. The timestep in this study was selected to minimise this error to be negligible:
 $$\omega _{{\rm new}} {\equals}{{\left( {Torque_{{\rm gas}} {\minus}Torque_{{\rm friction}} } \right).Inertia} \over {Timestep}}{\plus}\omega _{{\rm current}} $$
4.0 SAS, FRICTION AND PERFORMANCE INTEGRATION
Following a shaft failure, the axial load on the turbine assembly depends on various aerodynamic and mechanical factors. Additionally, the compression system post-stall behaviour has a large effect on the secondary air system cavity pressure evolution. As the turbine moves rearward during an unlocated failure, the geometry of the secondary air system network will change, as ports open and close. While pressure increases in some tanks due to a charging effect, the general trend is a decay in time due to the run-down of the compression system in stall. It is possible, however, that in certain circumstances the closing of some discharge ports can prevent gas escaping and a spike in pressure can follow. This has the possibility of reversing the net axial force on the turbine to push it upstream. In this case, the contact between rotating and static structures will cease and the frictional torque goes to zero, which is detrimental to overspeed in the sense that the terminal speed will increase. Additionally, during movement, some reservoirs may combine due to mechanical damage of components, which can be beneficial in reducing the accumulation of pressure at some rear cavities to maintain a positive net axial force. The effect of compressor surge on the combustor is not considered in the present study; however, this is intended to be included in future iterations of the methodology.
The primary parameters in the integration of the models include the axial force on the rotor, the rotor gas torque used to accelerate the rotor, the friction torque used to resist rotor acceleration and the axial position of the rotor. A process flow chart of the model integration is given in Fig. 7. Starting from the initial condition, which comes from intact rotor conditions:
• The disc force is available from the steady-state solution of the secondary air system model.
• The gas torque is obtained from the reduced order performance model (including torque penalty).
• The force due to pressure and momentum thrust across the rotor is fed into the friction model.
• If the contact condition has been reached, then the axial force is used to calculate the friction torque acting against the gas torque. The difference between the two values is then used to calculate the new angular speed at the next timestep.
• The new axial position is calculated from the velocity equation, which depends on frictional parameters.
• If no contacts are present, the axial force along with Newton’s second law of motion is used to calculate the new axial position.
• The secondary air system network is updated in terms of volume and area information at the new axial position, and the corresponding axial force on the disc is fed to the friction model.

Figure 7 Process flow chart of the model integration.
The change in reservoirs downstream of the turbine disc is sketched in Fig. 8. The portion of the overall network around the unlocated rotor is shown in Fig. 9. The boundaries represent connections to the main gas path, where boundary 7 is the connection of the rear rim cavity to the main gas path and boundary 4 represents the high-pressure compressor outlet. Where the shaft fails there is a new link introduced that connects Tanks 23 and 19. Tank 23 contains high-pressure air, having been compressed by the high-pressure compressor, and Tank 19 contains intermediate-pressure air having yet to be compressed. Variable elements of the network are indicated with dotted lines. The neighbouring networks are represented by dashed lines. As the rotor moves rearward, the volumes in front of the disc increase and volumes on the rear decrease. Having a detailed network allows the calculation of the axial force considering the pressure in each cavity around the disc, where the total net force is the sum of the disc force and the pressure and momentum thrust across the rotor.
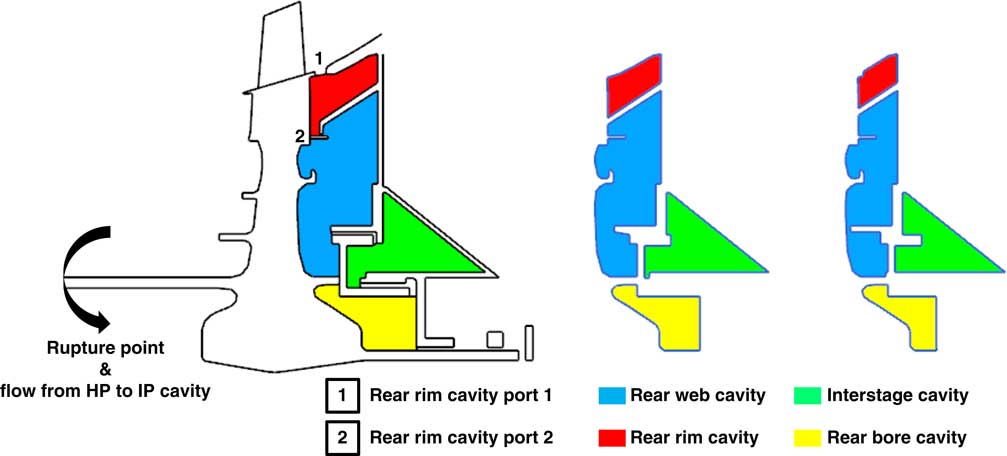
Figure 8 Change of rear reservoirs during turbine dislocation.

Figure 9 Secondary air system network around the rotor.
According to the failure type, the vibration levels can be different. For the failures where the shaft fails due to localized heating, the shaft separates into two clean halves. In this type of clean failure, the vibration levels tend to decrease after the break. On the other hand, if the shaft fails due to a mechanical reason like corrosion, over-torque or fatigue, the shaft separates into two with significant deformation over its length. The vibration levels in this type of dirty failure tend to continue during the entire event( Reference Gallar 23 ). Following the shaft failure, it is assumed that there is minimal unbalance and that seals conserve their sealing capabilities. With the increase in rotational speed, the flow area will also decrease due to radial growth, however, this is not considered in the current study. As demonstrated in Fig. 10, the change in flow area due to axial movement is significantly larger than can be expected from radial growth.

Figure 10 Triple labyrinth seal dislocation.
5.0 POST-SHAFT FAILURE SCENARIOS
The integrated modelling tool has been applied to several shaft failure scenarios to demonstrate its capability. The first scenario looks at the effect of introducing variable geometry, and compares to using a fixed secondary air system network. This highlights the necessity to model variable geometry networks. The second scenario looks at possible damage scenarios that may occur during such an event and how the outcome may be affected. The comparisons will be made based on the time-averaged force over the entire simulation, terminal speed and axial position values at the end of the simulation. In the present model, the simplifications made in the performance cycle of the engine mean that a terminal speed will not be reached, since no account is made for the chopping of fuel or the actuation of variable geometry within the compression system. With these accounted for, the energy input to the turbine would be effectively removed, following which a terminal speed could be reached.
5.1 FixedandvariableSASelements
This scenario couples geometry parameters within the secondary air system to the friction tool as a function of rotor axial location. As a result of this coupling, flow from the shaft failure gap and closure of the rear rim and web cavity ports become big drivers in the outcome of the event. The notional geometry used is shown in Fig. 1 with key areas marked. The pressure differential across the shaft failure gap, which creates a link between the high-pressure (HP) and the intermediate-pressure (IP) air network, allows HP air to flow into the IP cavity and to the rear of the turbine disc, affecting the net force on the turbine. The closure of the rear rim and web cavity ports causes raised or constant pressures, while pressures elsewhere around the disc are decaying due to compressor run-down. This again affects the net axial force acting on the turbine in a detrimental fashion.
All parameters in figures are normalized, forces by the end load and pressures by the static pressure at the rotor inlet representing the values at the beginning of the event. The first case, referred to in figures as Case 1, is based on the assumption of fixed SAS elements, with no flow through the shaft failure gap (Fig. 1). In this case, the rotor is found to be accelerating to a terminal speed of 150%, which means 150% of its initial rotational speed. The net force on the turbine is always positive, as indicated in Fig. 11, and is also considered as the ‘baseline’ case. The oscillation in net force is due to the surge boundary conditions applied, in which the engine undergoes several deep surge cycles. In Case 2, flow through the shaft failure gap is allowed, which results in a decrease in net axial force acting on the disc due to HP air reaching the downstream portion of the disc. With respect to the baseline, the net axial force is reduced by 13%, but the force always remains positive.

Figure 11 Change of net force on dislocating rotor.
In Case 3, geometry of the secondary air system is variable and a function of axial movement, allowing pipe areas and tank volumes to change. As in Case 2, flow is allowed through the shaft failure gap. The effect of this flow, which travels into the IP air network and to the rear bore cavity behind the disc, is to raise the pressure in this cavity. This is shown in Fig. 12, where Cases 2 and 3 demonstrate a raised pressure in the cavity due to this flow. The rise in pressure, which is governed by the pressure differential across HP and IP networks, occurs at the beginning of the event and the pressure at this cavity is maintained at a higher level at Cases 2 and 3 with respect to the baseline case. In Case 3, the net axial force is found to be significantly lower than the previous two cases, oscillating around zero for brief periods. With respect to Case 1, the net force is 50% lower, there is 33% less axial movement and the terminal speed is 4% higher. The terminal speed trajectories for the three cases are shown in Fig. 13.

Figure 12 Rear bore cavity pressure.

Figure 13 Rotor acceleration track.
The evolution of pressure in the rear rim and web cavities is given in Fig. 14. When the rear rim cavity becomes isolated during Case 3, the pressure becomes constant. The first rear rim cavity port is the gap between the blade shank and the NGV platform, as indicated by number 1 in Fig. 1, which connects the rear rim cavity to the main gas path. The second rear rim cavity port is the gap between the rotor and the knife seal, as given by number 2 in Fig. 1, which connects the rear rim cavity to the rear web cavity. These ports are represented as the Pipes 7 and 36 in the schematic secondary air system around rotor at Fig. 9. These pipe areas allow the flow through the rear rim cavity and are variable. The total of these two flow areas is plotted in Fig. 14 as a function of time, on the secondary y-axis. When zero, the ports are completely closed, which occurs when the turbine moves axially rearward, and one, when the ports are open, which occurs when the turbine moves axially forward. When the total area of the ports is zero, there will be no flow from rear rim cavity and the gas will be isolated. For a forward motion to occur, the net axial force must be negative. At the beginning of the event, the pressure builds in both the rear rim and web cavities. As the force on the turbine crosses zero first time at 0.25 and becomes negative the turbine moves axially forward, opening the ports and venting the HP air to other reservoirs. This phenomenon repeats until the start of the first re-pressurisation at a normalised time of around 0.6.

Figure 14 Change of rear rim cavity pressure.
Following this re-pressurisation, the engine enters into a series of surge cycles. During the re-pressurization phases, the net force is positive and axial movement is in a rearward direction. Following this, the rear rim cavity becomes isolated again and the pressure in the rear web cavity increases. The pressure builds until the net force on the turbine becomes negative, and the rotor changes direction and moves forward. With the change in direction, the ports of the rear rim cavity open and gas flows from the rear web cavity to the rear rim cavity. This flow is seen as a pressure spike in the rear rim cavity that appears directly after the isolation period. This isolation and pressure spike re-occurs during the three surge cycles. From an overspeed prevention point of view, the decrease in net axial force on the turbine rotor is undesirable since the frictional capacity of the system is also reduced. Additionally, during forward axial movement, the turbine generates zero friction.
The force evolution of the baseline condition Case 1 has the characteristics of the compressor delivery pressure during the surge and recovery cycles. Without taking into account the change in the secondary air system, the scaling of the steady-state load as a function of the compressor behaviour can be representative of the post-shaft failure turbine end load. However, according to the force trajectories plotted in Fig. 11, the change of the secondary air system elements affects the turbine end load, especially in Case 3, where the force changes direction.
Several damage scenarios or active control systems can be utilized on the engine platform to reduce the negative effect of system dynamics during an unlocated shaft failure. The next section investigates a configuration in which the net force, lowered due to the effect of secondary air system dynamics, can be increased.
5.2 Damageorairventilationscenario
Case 3 represents what is predicted to occur with the given turbine and secondary air system geometry, using the same set of boundary conditions as in all previous cases. Let us now consider how this outcome can be reversed to re-gain some lost benefits and return closer to Case 1. Case 4 considers the result of a potential design change where the rear rim cavity port does not close completely, yet a continuous discharge is allowed using a modified schedule. This scenario assumes a mechanical damage at the region so a gap remains after the first contact. Following the initial closure of the gap between the rotor and the structures indicated in Fig. 8 by numbers 1 and 2, a certain gap is maintained as shown on the secondary y-axis in Fig. 15. With respect to Case 1, the net axial force is 38% lower, the turbine dislocates 22% less and the terminal speed is 2.7% higher. To quantify the improvement with respect to Case 3, in Case 4, the net axial force is 25% higher, the turbine dislocates 15% more and the terminal speed is 1% lower. The axial force and terminal speed trajectories are shown in Figs 16 and 13, respectively.

Figure 15 Change of rear web cavity pressure.

Figure 16 Change of turbine end load.
As in Case 3, flow through the shaft failure gap increases the pressure in the rear web and rim cavities at the beginning of the event. This increase results in forward rotor movement which opens the rim cavity ports. After this initial contact between the rotor and the stationary structures downstream of the rotor, the artificial schedule is applied. The opening is kept at half the initial opening. The pressure evolution in the rear cavities differ significantly from Case 3. Allowing flow to continue allows the pressure in the rear and web cavities to equalize, allowing the net force to become positive. Case 3 resulted in 50% decrease in axial force with respect to reference Cases 1 and 4 resulted in 38% decrease in axial force with respect to Case 1. So Case 4 recovered 12% axial force, which is beneficial in terms of preventing overspeed. The time evolution of pressures for Cases 1, and 4 are shown in Fig. 15. The secondary y-axis is the total area of the rear ports.
The results of the post-shaft failure scenarios are summarised in Table 1 with respect to reference Case 1. Additionally, five additional conditions are tabulated to quantify the change in results based on the assumptions made in the overspeed analysis. These cases are simulated with the Case 1 settings which do not consider the effects of the variation in secondary air system pipes and reservoirs. For this reason in all these five additional cases, the turbine end load is almost unaffected. At the intact turbine condition, the turbine performance penalty factors are not applied. Six per cent increase in terminal speed is seen in this case.
Table 1 Comparison of different scenarios with respect to Case 1

The friction coefficient may also have variability as a function of the sliding speed, pressure, temperature, etc. The effect of the friction coefficient is investigated in the ±0.02 range from the reference value and expands the range of friction coefficient in these types of contact conditions where the friction coefficient is low. Friction coefficient is directly effective on both the friction torque and the axial dislocation. The effect on terminal speed is found to be ±2%. The last two simulations are related to a change in material properties which can differ according to the production of the material used in the engine. For this particular shaft failure scenario ±100K change in the melting point of the material has a minor effect on the terminal speed.
The inclusion of the secondary air system variability changes the terminal speed behaviour and the methodology can also to be applied to a design study. The method will establish guidelines on the component design to exploit the friction in the system during early phases of the engine development.
6.0 SUMMARY AND CONCLUSIONS
Previous attempts to model shaft failure have neglected the effect of secondary air system dynamics and the close coupling with thermo-mechanical behaviour. The axial force, which is a dominant parameter in friction generation between contacting structures, can differ significantly as a result of both air system geometry and transient changes. The novel approach in this study is that the capability to capture secondary air system dynamics and geometry changes is done through the addition of a transient one-dimensional secondary air system model. Another advantage is that possible damage scenarios can be implemented and investigated. This allows useful guidelines to be generated to minimize the potential hazardous consequences of shaft failure and overspeed.
Several scenarios were run, including fixed and variable geometry cases, as well as introducing a design change to recover some lost benefits due to system performance. The gap introduced where the shaft fails, and air flow from the HP to the IP air network, increase the terminal speed by 1%. The biggest impact comes from the isolation of cavities rearward of the turbine disc, allowing pressure to build. This reduces the net axial force and consequently friction torque, and has the ability to reverse the force direction and move the turbine disc forward removing contact altogether. Considering variable air system geometry, as a function of axial movement, as well as the shaft failure gap, the resulting increase in terminal speed is found to be 4%. In this condition, the average axial force acting on the turbine is 50% less. The last post-shaft failure scenario was introduced to compensate the loss in turbine end load by introducing an artificial rear rim cavity geometry schedule to allow a continuous air vent. This design was found to recover 12% of the turbine end load (Figs 1–16).
ACKNOWLEDGEMENTS
The authors would like to express their gratitude to Rolls-Royce plc for supporting this research and permission to publish the paper.