NOMENCLATURE
- AirTOp
air traffic optimization
- ASEAN
Association of Southeast Asian Nations
- ATM
air traffic management
- FSC
full-service carrier
- ICAO
international civil aviation organization
- LCC
low-cost carrier
1.0 INTRODUCTION
Air transport is a critical element in the flow of capital and people through the Asia Pacific region(Reference Duval12,Reference Zhong, Salleh, Chow and Ong39) ). In 2008, the ASEAN (Association of Southeast Asian Nations) member states accepted a Multilateral Agreement on Air Services, which might result in an eventual Single Aviation Market(Reference Tan31). Founding joint ventures may be an approach for foreign carriers to enhance the network in the region(Reference Hanaoka, Takebayashi, Ishikura and Saraswati21). Recently, the rise of low-cost carriers (LCCs) in South-East Asia(Reference Xie, Aneeka, Lee and Zhong34) has seen a huge spike in demand for affordable air travel within the Asia Pacific region(Reference Phyoe, Nguyen, Aneeka, Zhong, Kowalski, Lukasik and Kulczycki28,Reference Zhong37) ). The LCC's traffic numbers are expected to peak further(29). The competition among LCCs and full-service carriers (FSCs) is increasing(Reference O'Connell and Williams27), and this competition reduces business and leisure fares of FSCs uniformly(Reference Alderighi, Cento, Nijkamp and Rietveld2). FSCs tend to reduce fares on the routes that are also offered by LCCs(Reference Malighetti, Paleari and Redondi26). Regular long-haul operations of LCCs are also possible if appropriate trunk routes are determined and FSC products are not bundled(Reference Daft and Albers10).
LCC network extensions result in a permanent increase in traffic(Reference Gillen and Lall20). Due to the operation type and usual flight routes of LCCs, this increase in LCC flight movements can be translated to an increase in medium-sized aircraft. A conservative estimate is a 5% increase of medium-sized aircraft in the air traffic mix in 2020(5). With the new open sky policy, it is expected to increase regional and domestic connectivity and thus increase the overall capacity of the region(Reference Forsyth, King and Lyn Rodolfo18). With the surge of LCCs, studies have also been conducted on how they might affect the efficiency of airports. In the study conducted by(Reference Choo and Oum8), it was concluded that airports with increasing LCCs actually had decreasing efficiency. Hence, more studies should be conducted to increase the efficiency of air transport operations with increasing LCCs.
Airports have witnessed exponential growth, and the associated risks include congestion, delays and dissatisfied passengers(Reference Dursun, O'Connell, Lei and Warnock-Smith11). The runway capacity of an airport(Reference Andreeva-Mori, Suzuki and Itoh3,Reference Gelhausen, Berster and Wilken19) is defined as the number of arrival and departure flights per hour(22). A runway capacity depends on numerous factors. In the article of(Reference Kolos-Lakatos24), it was stated that the capacity of a runway is significantly affected by traffic mix, wake vortex separation, runway occupancy time, rapid exit taxiways, etc.. It was concluded that for heavy-medium aircraft pairing, the limiting factor was wake vortex separation, whereas for small-medium aircraft pairing, the limiting factor was runway occupancy time.
The point that a runway capacity is affected by many factors is further supported by the operational performance report of EUROCONTROL and Federal Aviation Administration(13). The runway capacity of every airport is different, and there is no solution suitable for and applicable to all airports. Hence, there is a need to study the runway capacity of Changi Airport, specifically using its actual flight data.
The runway occupancy time is defined as the time that the aircraft occupies the runway(16). During this study, the average runway occupancy time would be collated and analysed to investigate the extent of the effects of different runway operations.
The airport being studied, currently has two runways for commercial flights. Due to the larger noise associated with aircraft take-offs, runway 1 is primarily utilised for arrivals due to its closer proximity to residential areas, and runway 2 is primarily utilised for departures(6). The operation of flight movements on each runway has a significant effect on the runway capacity especially during peak hours, when the airport is facing a large amount of flight movements in a short period of time. The two runways are spaced sufficiently far apart (1.64 km(Reference Tan32)) for them to be operated independently by ICAO (International Civil Aviation Organization) standards, such that both arrival and departure flights can occur concurrently on both runways. However, the current operation is to utilise them as dependent runways with staggered separation distances(Reference Tee33). This is mainly due to the additional equipage and manpower required for independent runway operations.
In summary, Asia Pacific has been recording faster air traffic growths, compared to regions such as Europe and North America, largely because of emerging markets and developing economies in Asia Pacific. This is especially seen in the demand and supply for LCCs in Southeast Asia. Changi Airport, being one of the major air traffic hubs in Asia, is facing overloaded traffic in the future due to this exponential growth. Although a new runway and new terminals are proposed and in the process of being built, the coming years could still bring a huge challenge to the airport, if its existing capacity is not enhanced to cope with the increasing traffic demand.
Could the runway capacity be further enhanced, higher than the existing capacity? In addition, LCCs were holding over 50% of the region aviation market and are expected to increase further. Would the two runways be able to handle such increases, before building a new runway is completed? To answer such questions, we proposed to study and analyse different approaches for the runway operations using the fast-time simulation approach in this work. As contributions to ATM (Air Traffic Management) research in one of the fastest growing aviation markets in the world, we sought to analyse the impacts of future increasing LCC flights on the airport runway capacity. Different runway operational scenarios were simulated to investigate their advantages and disadvantages in terms of the runway capacity.
2.0 FLIGHT DATA AND SIMULATION TOOL
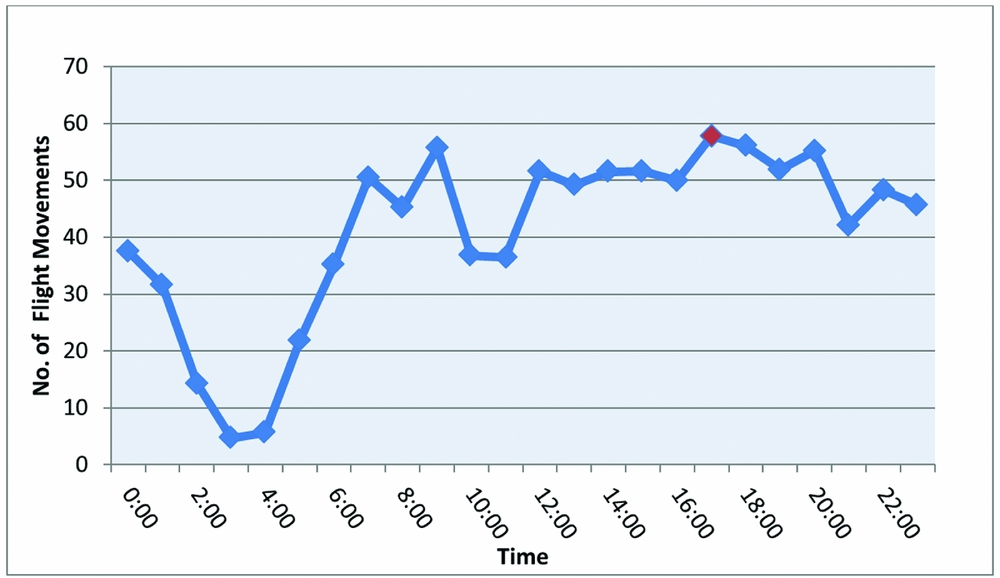
To collate and analyse the data with high accuracy, daily flight data of the airport were compiled from the website (www.flightstats.com). From the website, the average numbers of flight movements in the airport during 3 -9 Jan 2015 were calculated, and are shown in Fig. 1. Based on our previous studies(Reference Chow9,Reference Zhong, Salleh, Chow and Ong38) ), the traffic of January 2015 was equivalent to 8.17% of the annual traffic of 2014. It can be observed that the peak hour for the airport was 1700 -1800 (highlighted by a red marker in Fig. 1). Hence, in this work, this hour was the peak hour that was analysed, as it was related to the highest number of flight movements per hour in that week. Most importantly, if the airport is able to handle the traffic occurred during the peak hour, it is highly likely that it can handle the air traffic experienced during other hours of the day.

Figure 1. Average hourly flight movements during 3–9 Jan 2015.
The simulator used in this work is known as AirTOp (Air Traffic Optimization). It is a modular and open fast-time simulation platform, which can be used for en-route, approach and departure simulations, and airport ground movement studies(14). The simulation software usually operates under deterministic assumptions and does not take into account stochastically varying properties(Reference Tee33). It is capable of setting up operational scenarios to analyse complex concepts in a single simulation scenario. Using it, we can model the airport runway layout and ground movements for analysis purposes. The fast-time simulation approach can be applied to the studies for other airports, saving huge costs, manpower and time for performing actual tests(Reference Zhong and Tee40).
Airlines, airport operators, aircraft manufacturers, service companies, air navigation service providers, research labs in Nanyang Technological University, Federal Aviation Administration, EUROCONTROL etc. are using fast-time simulators to conduct complexity and capacity researches(1). Flight plans can be imported to the simulator to create realistic flight trajectories based on Base of Aircraft Data(Reference Li, Cai, Yan, Tang and Zhu25). Fast-time simulations were also performed to quantify the relative capacity enhancements(Reference Zhong, Varun and Lin41). Readers can read these references, if they need to understand more about fast time-time simulations.
3.0 THE SIMULATIONS
3.1 The airport model
The terminal gates, taxiways and parking positions were all modelled exactly as that in the airport studied, to obtain high accuracy during simulations(Reference Tee33,Reference Zhong, Varun and Lin41) . However, one paper cannot address all the issues such as choked taxi-ways, stand availability, etc., which need much more future researches to address all these important issues. Other factors such as runway occupancy times and delays were also taken into consideration. Only flights that were not cancelled were taken into consideration during the input of the data into the simulations, for a more accurate and realistic comparison with the actual operating conditions of the airport. The ICAO international standard for wake turbulence separations was also adopted.
Wake vortex separations for aircraft are required due to the phenomenon known as wake turbulence, generated behind an aircraft through its passage in the air(15). Various components make up this turbulence, of which most important are wingtip vortices and jetwash. Wingtip vortices are formed when an aircraft wing is generating lift, and their strengths mainly depend on the aircraft weight and airspeed(17). Jetwash is extremely turbulent(15,17) ). Due to the high attack angle during take-off and landing, wake turbulence becomes significant and extremely hazardous. As such, ICAO(23) has set minimum separation standards for departure and arrival flights. As most airports do not use radar separations for initial climb and take-off, the resulting wake turbulence separations between departure flights are measured by time interval, while they are measured by distance for arrival flights(30). The wake turbulence separation matrix used in the fast-time simulator(Reference Tee33) is given in Fig. 2.
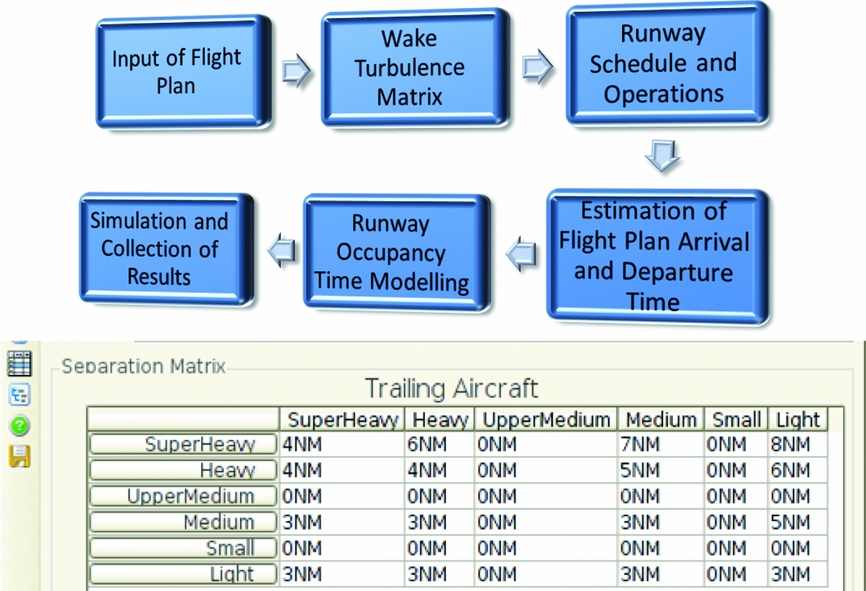
Figure 2. The flow chart for the set-up of the simulation model, and the wake turbulence separation matrix used in the fast-time simulator(Reference Tee33).
The flight data obtained from the airport website and Flightstats.com were compiled. The traffic data in the peak hour 1700–1800 were studied, for the reasons discussed earlier. The increased supply and demand of LLCs was assumed to be an increase in the amount of medium-sized aircraft for the reasons(5) discussed in section 1. The directions of both arrival and departure flight movements were set in the northeast direction.
A baseline simulation model was established to ensure that the airport model utilised could handle the actual flight data for the airport. Hence, the actual flight data from 3 January 2015 were used as the simulation flight data, because they had one of the highest total flight movements in the airport during the peak hour.
Figure 2 shows the flow chart for the set-up of the simulation model. The following steps were taken to set up the baseline simulation model.
Step 1: Input of Flight Plan. Fifty-nine flight plans were entered into the simulation model. The arrival time and the departure time of the aircraft were set such that the aircraft would land on the runways at their scheduled time. The specific aircraft for each flight plan was chosen from the existing list of the aircraft available in the model in accordance with the actual flight data. For the specific operational scenarios studied, the runway for the flights movements was individually input into the flight plan.
Step 2: Wake Turbulence Matrix. To conduct the simulation in accordance with the required wake turbulence separation and staggered runway separation, turbulence separations were checked with the existing separation matrix, and input as a factor into the simulation model.
Step 3: Runway Schedule and Operations. As this work sought to study the best runway operation approach for the peak-hour air traffic in the airport, the runway schedule was edited for both runways, such that they fulfilled the various operational scenarios. The detailed explanations about these operational scenarios are presented in Section 3.2.
Step 4: Estimation of Flight Plan Arrival and Departure Times. Once the set-up of the runway schedules was made, the estimation of the flight plan arrival and departure times was calculated using the AirTOp software, which had the estimation functions required for such time calculations.
Step 5: Runway Occupancy Time Modelling. The runway occupancy time for both arrival and departure was recorded. The actual flight data were input into the simulation for the software to capture both arrival and departure times for the analysis.
Step 6: Simulation and Collection of Results. The simulation was conducted, and the various simulation results required for this study were output into Excel files for further analyses and comparisons.
3.2 Operational scenarios simulated
3.2.1 Scenario 1a: baseline scenario with segregated parallel arrivals/departures
The baseline scenario was simulated with two types of runway operations, to study the effects of both strategies on the runway capacity. The first strategy would be the standard approach utilised for noise management of arrival and departure flights. The second strategy is explained in Section 3.2.2. The operation of using separate runways for arrival and departure aircraft may help to optimise the waiting time between arrival and departure aircraft. In scenario 1a, all departure flights would depart on runway 02C (runway 2), while all arrival flights would land on runway 02L (runway 1), as shown in Fig. 3.
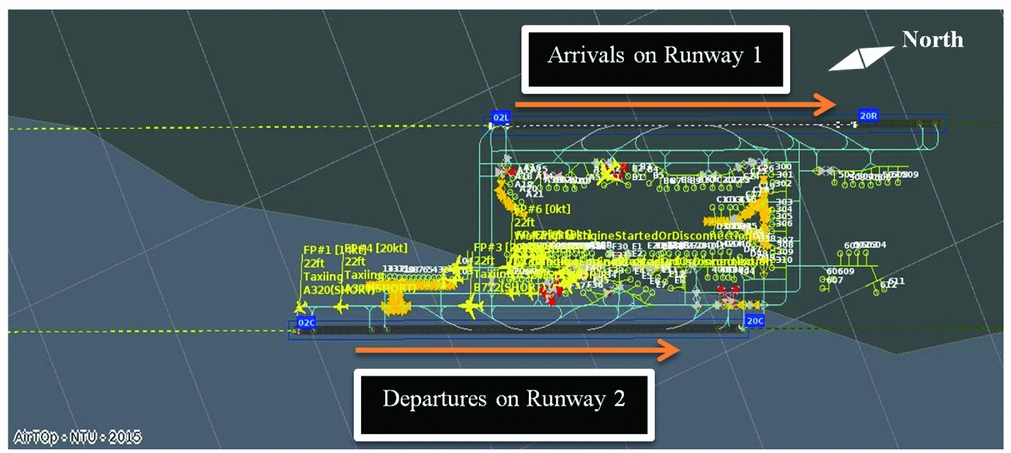
Figure 3. The runway operation of baseline scenario 1a(Reference Tee33).
3.2.2 Scenario 1b: baseline scenario with mixed parallel operations
In this operational scenario, both arrival and departure flights were allowed to operate on both runways. Every arrival flight was allocated by the software adaptor known as the Runway Arrival Sequence Adaptor. With it, arriving flights would be allocated to either runway 1 or runway 2, depending on which runway would be available for the flight to land first. Departure flights were also allocated to the earliest available runway, although they had to wait in line if there was an incoming arrival flight. This is because arriving flights are not allowed to be in holding in the airspace for a long period of time, while departing flights can remain stationary on the ground waiting for further clearance.
3.2.3 Projected flight movements in year 2020
As the new runway of the airport will only be available earliest in 2020, the two runways of the airport have to be able to handle the growth of commercial flights at least till 2020, specifically due to the growth of LCC flights(4). Hence, this work forecasted the peak hour flight movements up to 2020 by using the commercial aircraft movements data provided by the airport(7). By calculating the yearly percentage change from 2012 to 2014, an average growth rate could be obtained. Although a forecast of the flight volume might not be achieved by simply taking the average growth rate of the past two years, we assumed a simplifying hypothesis of the future growth, which we applied for the sake of the simulations. This was also because forecasting of flight movements was not the main focus of this work.
Using the average growth rate, the maximum peak-hour flight movements that are expected in 2020 are around 70. Out of these 70 flights, by using the average percentage of arrival and departure flights in the peak hour of the one week of flight data collated, 41 of them were calculated to be arrival flights and 29 to be departure flights. This is because arrival aircraft take more time. To consider the worst-case scenario, more arrivals were taken for the study.
Using the seven days of flight data collected, the average percentage of air-traffic mix for both the arrival and departure flights was calculated. In view of the future increase in LCC flights as discussed earlier in section 1, based on the actual flight data, a 5% increase of medium-sized aircraft(5) was allocated in the air-traffic mix, by adjusting the percentage of heavy aircraft for the air-traffic data of the year 2020. The resulting air-traffic mix is shown in Table 1. This new traffic mix was applied to the peak hour flight movement data for the simulations of the year 2020.
Table 1 Air-traffic adjustment in the peak hour for year 2020
3.2.4 Scenario 2a: year 2020 scenario with segregated parallel arrivals/departures
The single runway departure and single runway arrival approach was adopted with the new projected flight data set of the year 2020. The set-up of the scenario was similar to that for simulation scenario 1a, with the additional aircraft movements added into the existing list of the flight plans.
3.2.5 Scenario 2b: year 2020 scenario with mixed parallel operations
With this scenario, the simulation was conducted using the same flight plans stated in Section 3.2.4, while the runway operation method was the one utilised in scenario 1b, as stated earlier. This would allow direct comparison of both scenarios and studies of the effects of an increase in flight movements and medium-sized aircraft percentage in the air-traffic mix.
3.2.6 Scenario 2c: year 2020 scenario with semi-mixed parallel operations
A mixed parallel approach may not be the most optimal. This is because two arrival flights have to maintain a separation distance that may be much higher than most of the wake turbulence separation distances imposed by ICAO, in order to allow one departure flight to take off on the same runway in between the two arrival flights. Hence, a new runway operation method was proposed to increase the runway capacity. In this operational scenario, runway 1 would only handle arrival flights, while runway 2 would handle all departure and 10 arrival flights as shown in Fig. 4. This exact division of arrival flights arises, because arrival flights occupy more time on the runway compared to departing flights. Hence, with a total of 41 arrival flights and 29 departure flights, this runway operation scenario is designated, such that there are a total of 31 arrivals flights for runway 1, and 29 departures and 10 arrival flights for runway 2. Ultimately, this would allow the maximum utilisation of both runways and might increase the runway capacity.

Figure 4. The runway operation of scenario 2c(Reference Tee33).
3.2.7 Scenario 2d: year 2020 scenario with mixed independent runway operations
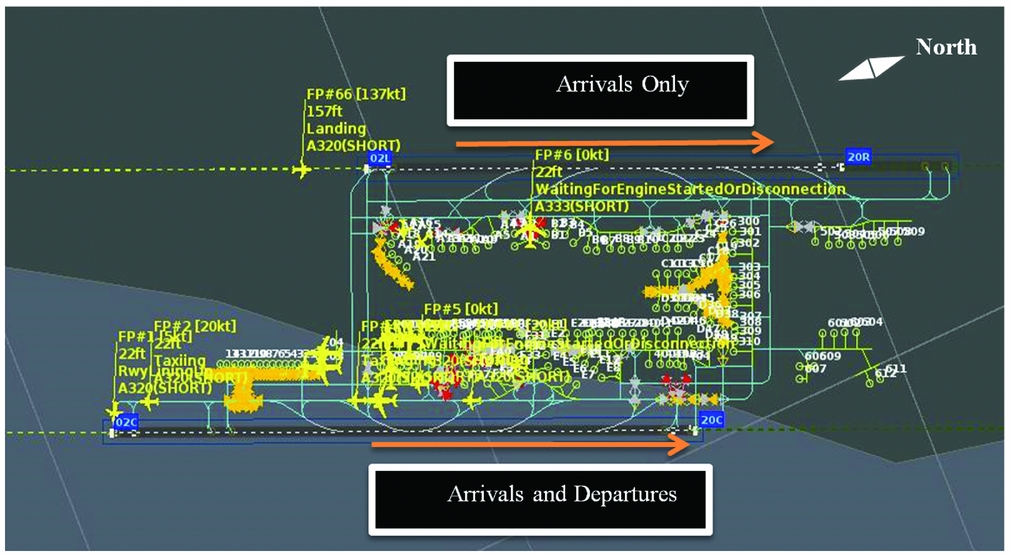
In case operational scenarios 2a, 2b and 2c could not cope with the estimated flight movements in 2020, scenarios 2d, 2e and 2f would be simulated to study if the operation of both runways as independent runways could cope with the increased demand. Scenario 2d was simulated with mixed traffic on both runways operated independently without the staggered runway separation currently imposed by the airport. As this allows both runways to accommodate arriving and departing flights concurrently, this may greatly help to increase the runway capacity and cope with the projected increasing flight movements.
3.2.8 Scenario 2e: year 2020 scenario with semi-mixed independent runway operations
Likewise to scenario 2c, this scenario would enable the analysis of the potential benefits of semi-mixed operations that might bring to the runway capacity, and other aspects such as runway delay or holding duration of arriving aircraft. The significant difference in this scenario, compared with scenario 2c, is that both runways would be operated independently. Hence, there would not be any staggered runway separations applied.
3.2.9 Scenario 2f: year 2020 scenario with dedicated medium-sized aircraft arrival runway operations
The final simulation scenario would test the runway operation whereby one runway would be dedicated to medium-sized aircraft arrivals. This might help to reduce the wake turbulence separation required on that specific runway, as no other types of aircraft would land on that runway. In this scenario, runway 02C (runway 2) was the chosen runway for all arriving medium-sized aircraft. Departure flights would continue to depart on both runways, and not be restricted to either runway to ensure the maximum runway utilisation of both runways. Both runways would also be operated independently without any staggered separation requirement.
3.2.10 Overview of the simulation methodology
An overview of the simulation methodology is shown in Table 2. This table summarises the operational scenarios simulated, and the detailed explanations about these scenarios are presented in the early subsections. In this work, factors such as the number of flight movements completed within the peak hour, runway delay and holding duration were analysed, to determine which runway operation method would be the most suitable for the airport to cope with future flight movements.
Table 2 Summary table of the operational scenarios

4.0 RESULTS AND DISCUSSIONS
4.1 Summarised results
Table 3 summarises the simulation results of operational scenarios 1 and 2. It could be seen that the baseline scenarios were able to cope with the air traffic in 2015. Scenario 2c had a total of 64 flight movements achieved within the peak hour. However, when the flight data were updated to the 2020 projected flight movements, none of operational scenarios 2a-2c was able to accommodate all 70 flights. Therefore, scenarios 2d-2f had to be simulated to confirm that the runway capacity in these operational scenarios indeed could cope with the increased demand.
Table 3 Summarised simulation results of scenarios 1 and 2 within peak hour
4.2 Comparisons between scenarios 1 and 2a-2c: different traffic levels, same operating modes
During the compilation of the runway occupancy time values for operational scenarios 1 and 2a-2c, it was observed that the values obtained for both the arrival and departure runway occupancy time(16) were similar. This suggested that the availabilities of the taxiways and parking positions were more than adequate to allow aircraft to vacate the runway without any delay.
After compiling the data obtained from the simulations of operational scenarios 1 and 2a-2c, an analysis and comparison of the simulation results was conducted. In terms of the average runway delay, the data from these five scenario simulations were compiled and are presented in Fig. 5. To give complete pictures, the averages of the delayed (not all) aircraft for departures and arrivals are also given in Figs. 5 and 6, as “DELAYED aifcraft” and “Holding duration (delayed)”, respectively. These averages have the same trends as that of their corresponding averages of all the aircraft for departures and arrivals simulated. Thus, only the averages of all the aircraft for departures and arrivals simulated are compared and discussed in the rest of this paper.
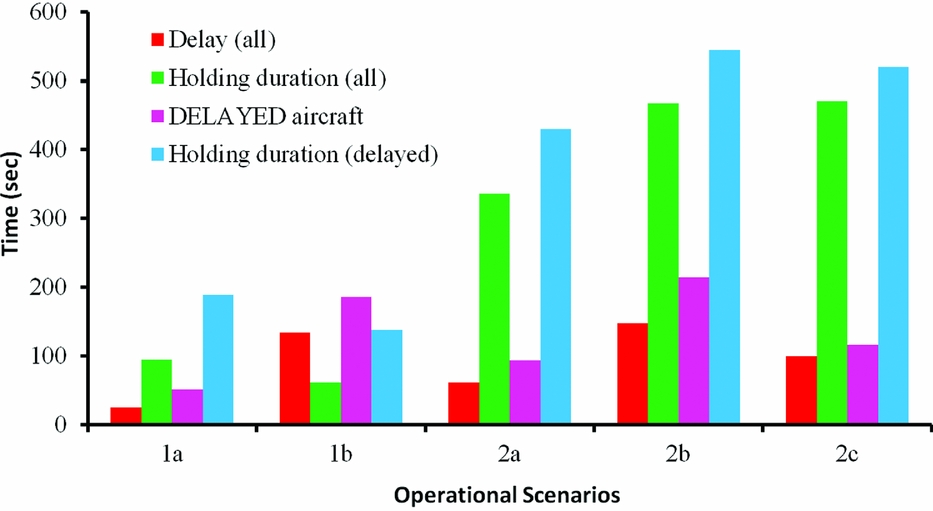
Figure 5. Comparison of average runway departure delay and average holding duration of operational scenarios 1 and 2a-2c.

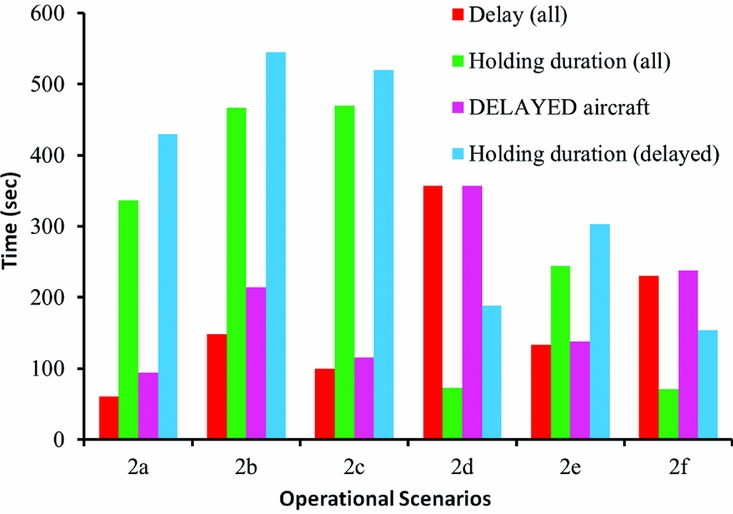
Figure 6. Comparison of average runway departure delay and average holding duration of scenarios 2a-2f.
Due to the complexity and waiting time involved between arriving and departing flights occurring on both runways, operational scenarios 1b and 2b both have a much higher runway delay time (the time that the aircraft wait on the line before being allowed to take off), compared to the other operational scenarios. Despite scenarios 2a and 2c having more aircraft flight movements than scenario 1b, their average runway delay time (the average delay time of all departures simulated) is still much less than that of scenario 1b, with 54.5% and 25.4% less delay time, respectively. This means that the runway departure delay is not influenced by the number and type of airplanes, and is instead affected by the runway operation method.
Another important delay aspect which can be compared is that the average holding duration of all arrival flights simulated has to be handled before these flights can touch down on the runways. From Fig. 5, it can be seen that the average holding duration is low when the total flight movements are still within the capacity of the two runways. However, once the two runways have reached their maximum capacity, the average holding duration increases exponentially with the additional flight movements. This suggests that the number and the type of aircraft have direct effects on the holding duration of the arrival aircraft. As medium-sized aircraft are subjected to higher wake turbulence separation distances when landing behind jumbo or heavy aircraft, they may need longer holding durations, if more jumbo or heavy aircraft are in the traffic flow.
4.3 Comparisons among scenarios 2a-2f: same traffic level, different operating modes
By comparing the simulation results of scenarios 2a-2f, a better understanding of the advantages and disadvantages of each scenario and how they perform relatively to each other can be obtained. First, from the simulation results presented earlier, it can be concluded that the existing runway operation of the airport may be unable to handle the projected flight movements in the year 2020, regardless of the traffic direction on both runways.
Figure 6 indicates that scenario 2d has the highest runway delay of 357 seconds among the scenarios compared. Hence, despite being able to accommodate all 70 flight movements within the peak hour, scenario 2d has a relatively significant departure runway delay. This is because, in this operation scenario, runway 02C (runway 2) has 23 departures, compared to 6 departures on runway 02L (runway 1). Hence, there can be a significant runway delay experienced by departure flights on runway 02C (runway 2), while waiting for incoming arrival flights. In scenario 2e, where there is a dedicated runway for departure with a mixture of 7 arrivals, the runway delay of only 133 seconds is significantly less.
Figure 6 also shows that the holding durations of scenarios 2a-2c are significantly higher than that of scenarios 2d-2f. This indicates that the holding duration is a significant sign that the runway capacity of the airport reaches its maximum limit. None of scenarios 2a-2c can accommodate all 70 flight movements within the peak hour. Scenario 2e has a relatively significant average holding duration of 244 seconds, compared to scenarios 2d and 2f.
Hence, there are advantages and disadvantages to scenarios 2d/2f and 2e, as they experience relatively significant delays for departure and arrival flights, respectively. However, arrival flights are more costly and environmentally damaging to be kept in holding for a long period of time in the air. Hence, scenarios 2d and 2f are better runway operation methods for the airport, compared to scenario 2e. The departure runway delay experienced in scenarios 2d and 2f can possibly be reduced by revising departure time slots within the peak hour, while air traffic controllers can also adjust the departing traffic flow accordingly. On the other hand, the delays experienced by arrival flights are much harder to control and reduce, due to factors such as weather conditions(Reference Xie and Zhong35,Reference Xie, Zhong, Aldabass, Achalakul, Sarochawikasit and PromOn36) and cruising speeds of different aircraft.
4.4 Discussions
Both the segregated parallel arrival-departure and the mixed parallel runway operations could handle the peak-hour traffic in 2015. Both also displayed acceptable results for overall delays for the peak-hour traffic in 2015 when this work was conducted. However, the segregated parallel arrival-departure runway operation adopted by the airport was more beneficial, because it also allowed the airport to operate under its noise-management policies. Most importantly, as there was only one traffic flow per runway, there was shorter waiting times for arrival and departure flights to handle. This was because the scheduling could be made independently and would not be affected by any delay due to either traffic flow. However, if there are more aircraft on the airport grounds, this conclusion may not hold true(Reference Tee33).
This work also studied the effects of the projected increase in future flight movements on the runway capacity of the airport. The runway capacity, which is limited due to its operating procedures, might be unable to cope with this demand. With the new runway only available in 2020 earliest, a possible solution during this gap period is to increase the two-runway capacity through a new runway operation approach.
By simulating various operational scenarios with the projected increasing flight movements, the most advantageous runway operation among the options analysed could be either a dedicated runway for medium-sized aircraft arrivals or mixed aircraft type arrivals on both runways. Both operations could lead to a lower holding duration for arriving aircraft, compared to a semi-mixed independent runway operation. Although both operations result in significant runway delay for departing aircraft, this could possibly be reduced by methods such as air traffic controllers’ adjustment of the move-off time of departure flights from their parking positions.
It is important to note that the projected flight movements used for the simulations may be lower than the actual flight movements faced in the year 2020. Hence, a dedicated runway to medium-sized arrival aircraft may be more beneficial compared to a mixed runway operation, as it allows lower wake turbulence distances for both runways. This will possibly enable it to have a higher runway capacity to cope with the increasing flight movements.
Lastly, adopting an independent runway operation in the coming years will also enable the airport to have the trained personnel and equipage ready to increase the capacity of the new third runway if required. This will allow the airport to stay competitive and remain as one of the most important international air hubs in the Asia Pacific.
5.0 CONCLUSIONS
We studied and analysed different approaches for the runway operations using the fast-time simulation approach in this work. As contributions to ATM research in one of the fastest growing aviation markets in the world, we analysed the impacts of future increasing LCC flights on the airport runway capacity. Different runway operational scenarios were simulated to investigate their advantages and disadvantages in terms of the runway capacity. The answers to the two questions stated in Introduction were found: (1) the runway capacity can be further enhanced, higher than the existing capacity; (2) the two runways can handle the increased traffic, before the building of a new runway is completed.
Both the segregated parallel arrival-departure and the mixed parallel runway operations could handle the peak-hour traffic. The segregated parallel arrival-departure runway operation is more beneficial because of the reasons discussed in Section 4.4. However, if there are more aircraft on the airport grounds, this conclusion may not hold true. By simulating various operational scenarios with the estimated increasing flight movements, the most advantageous runway operation analysed could be a dedicated runway for medium-sized aircraft arrivals or mixed aircraft type arrivals on both runways. Both operations lead to a lower holding duration for arriving aircraft, compared to a semi-mixed independent runway operation. A dedicated runway to medium-sized arrival aircraft may be more beneficial compared to a mixed runway operation, because it allows lower wake turbulence distances for both runways.
In scenarios 2d-2f simulated, 70 operations were induced by the estimated traffic demand. The simulations suggest that 70 aircraft per hour can be served in 2020. However, the maximum runway capacity could be higher than the runway capacity resulting from the various operating procedures investigated in this work. To maximise the runway capacity with considerations of other factors could be the future research work to cope with the ever-increasing flight movements.
ACKNOWLEDGEMENTS
We thank Mr. Kevin Cheong and Mr. Soon Boon Hai for their support, sharing, and advice. We also thank the reviewers of this article for their positive suggestions.