NOMENCLATURE
- ADS-B
-
Automatic Dependent Surveillance-Broadcast
- .csv
-
Comma Separated Variable
- FAA
-
Federal Aviation Administration
- ft
-
altitude in feet
- GPS
-
Global Positioning System
- ID
-
manoeuvre identification code
- ID 11, ID 12
-
right or left turn, respectively
- ID 31, ID 32
-
tail-right or tail-left pushback, respectively
- ID 41
-
constant aircraft speed or acceleration
- ID 42
-
aircraft deceleration
- ID 511, ID 512
-
right or left runway entry turn, respectively
- ID 521, ID 522
-
right or left backtrack runway entry turn, respectively
- ID 66
-
straight taxi
- ID 711, ID712
-
right or left runway exit turn, respectively
- ID 721, ID 722
-
right or left high-speed runway exit turn, respectively
- ID 731, ID 732
-
right or left backtrack runway exit turn, respectively
- ID 81, ID 82
-
right or left turn onto stand, respectively
- Kn
-
speed in knots
- RET
-
Rapid Exit Taxiway
- RTO
-
Rejected TakeOff
Greek symbol
-
 $\rho$
-
Pearson correlation coefficient

1.0 INTRODUCTION
Aircraft landing gear are exposed to a complex sequence of loads during taxi, takeoff and landing(Reference Schmidt, Sartor, Boller, Chang and Fujino1,Reference Ladda and Struck2,Reference Buxbaum3) . These cyclic loads originate from the large variety of ground manoeuvres, such as turns and braking, that aircraft must perform during routine service(Reference Schmidt, Sartor, Boller, Chang and Fujino1,Reference Ladda and Struck2,Reference Buxbaum3) . Whilst the large static loads from landing touchdown typically drive the structural sizing of the landing gear, the repeated sequencing of ground manoeuvres and their associated cyclic loads drive the fatigue life of landing gear(Reference Buxbaum3). Within existing landing gear fatigue design practice, the occurrence and sequencing of ground manoeuvres and their resulting loads must be accounted for within the landing gear load spectrum(Reference Buxbaum3,4,Reference Weibul5,Reference Holmes, Sartor, Reed, Southern, Worden and Cross6,Reference Schmidt7) . The definition of a landing gear load spectrum is required to provide the cyclic loads applied to the landing gear to support fatigue design, analysis and substantiation activities(Reference Ladda and Struck2,Reference Hoole, Sartor and Cooper8) . Currently, the construction of landing gear load spectra requires assumptions to be made regarding the variability of ground manoeuvre occurrence and sequencing(Reference Weibul5,Reference Holmes, Sartor, Reed, Southern, Worden and Cross6,9) . As such assumptions could lead to an under- or over-conservative design, additional data is required to validate these assumptions to facilitate the design of more efficient structural assemblies with reduced mass or a longer service life while retaining their structural integrity and remaining safe in-service.
1.1 Variability in landing gear loads
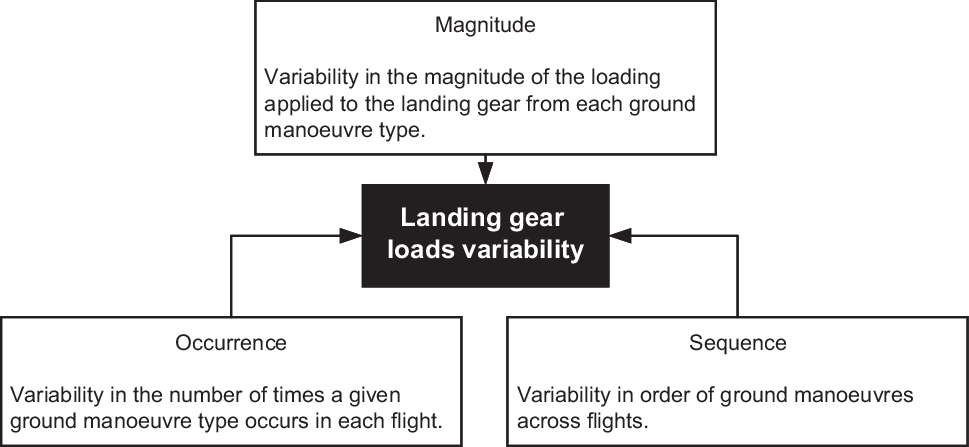
Due to the nature of aircraft operations, the loads that a landing gear structural assembly will carry in-service will vary significantly from flight-to-flight(Reference Schmidt, Sartor, Boller, Chang and Fujino1,Reference Ladda and Struck2) . The variability present within in-service landing gear loads can be decomposed into the following three areas, as visualised in Fig. 1:
-
1. Loading magnitude for a given ground manoeuvre (e.g. how ‘hard’ a landing is due to variability in the aircraft touchdown rate)(Reference Sartor, Bond, Staszewski and Schmidt10).
-
2. Manoeuvre occurrence (e.g. how many left turns are performed during pre-takeoff taxi).
-
3. Manoeuvre sequencing (e.g. how likely is it that a right turn will follow a left turn).

Figure 1. The variability present in landing gear loads.
The load spectra constructed during fatigue design of landing gear aims to represent the variability present within each of these three areas(Reference Buxbaum3). The variability in loading magnitude for landing gear loads has been widely characterised within previous studies(Reference Ladda and Struck2,Reference Buxbaum3,11) . More recently, the landing gear design community has focused on the multibody simulation of landing gear loads(Reference Castrichini, Cooper, Benoit and Lemmens12), along with improved characterisation of non-linearities within landing gear loads(Reference Coetzee, Krauskopf and Lowenberg13). In addition, sensitivity analysis methods have been applied to landing gear loads to identify the most influential flight and aircraft parameters regarding landing gear loads during hard landings(Reference Sartor, Worden, Schmidt and Bond14). The load factors applied to landing gear during specific manoeuvres are typically represented using exceedance curves(Reference Buxbaum3), such that ‘blocking’ can be performed to construct the load spectrum(Reference Hoole, Sartor and Cooper8). Exceedance curves have been produced for specific landing gear loads by Laddda and Struck(Reference Ladda and Struck2) and Buxbaum(Reference Buxbaum3) for a wide-body civil aircraft. Exceedance curves are also available for a number of aircraft, including wide-body civil aircraft, from the Federal Aviation Administration (FAA) statistical loads program(15). It is important to highlight that previous studies into landing gear loads and aircraft ground manoeuvres were reliant on either dedicated instrumented landing gear and aircraft, or extensive processing of aircraft flight recorder data from a limited number of aircraft.
The variability in both ground manoeuvre occurrence and sequencing is a direct result of the aircraft taxi routes at departure and arrival airports and is therefore dependent on a significant number of factors, not limited to:
-
• Departure and arrival airport
-
• Airport geometry and aircraft compatibility
-
• Weather and environmental conditions (for active runway direction for takeoff and landing)
-
• Airport traffic and local air traffic control taxi procedures
-
• The operator’s typical gate location at airports
It is therefore anticipated that the ground manoeuvre occurrence and sequencing for aircraft in routine service will show significant variability. However, the variability in ground manoeuvre occurrences has only been characterised to a limited extent in previous studies. In addition, during the construction of landing gear load spectra, assumptions are currently required regarding the occurrence and sequencing of ground manoeuvres(Reference Ladda and Struck2,Reference Buxbaum3,Reference Weibul5,Reference Holmes, Sartor, Reed, Southern, Worden and Cross6,9) . Previous studies only provide average values of ground manoeuvre occurrences (e.g. four turns during pre-takeoff taxi) but do not provide information regarding the flight-to-flight variability of ground manoeuvres(Reference Ladda and Struck2,Reference Buxbaum3) . In addition, to the authors’ knowledge, there are yet to be any data produced to support the characterisation of the variability in ground manoeuvre sequencing during the in-service operation of aircraft.
As a result of limited data regarding the variability in ground manoeuvre occurrence and sequencing, additional data must be generated to validate the assumptions currently required during the construction of landing gear load spectra(Reference Ladda and Struck2,Reference Buxbaum3,4) . In addition, existing assumptions must be validated and challenged to ensure that they are not over-conservative, resulting in a less optimum design. A challenge of potential load spectrum conservatism could support the design of more efficient landing gear components which are still safe and reliable in-service(Reference Hoole, Sartor and Cooper8).
Another element of landing gear fatigue design that is reliant on accurate characterisation of ground manoeuvre occurrence and sequence on a flight-by-flight basis is the use of ‘rainflow’ counting to extract the cyclic stress amplitudes applied to the landing gear(Reference Tao, Smith and Duff16). As rainflow counting extracts cyclic stresses based on the order in which they occur within a stress–time history(Reference Osgood17), the sequence of ground manoeuvres (and the resulting landing gear loads and stresses) must be representative of aircraft operation in-service to ensure accurate fatigue analysis results.
Finally, the authors’ wider research is focused on the development of probabilistic fatigue analysis methods and a reliability-based approach to safe-life fatigue design(Reference Hoole, Sartor, Booker, Cooper, Gogouvitis, Ghouali, Schmidt, Niepokolczycki and Komorowski18). Within such an approach, the variability in design parameters (e.g. materials, loading and dimensional data) are statistically characterised using probability distributions (e.g. Normal, Weibull, etc.)(Reference Hoole, Sartor, Booker, Cooper, Gogouvitis, Ghouali, Schmidt, Niepokolczycki and Komorowski18,Reference Ocampo, Millwater, Singh, Smith, Abali, Nuss, Reyer and Shiao19) . Therefore, the generation of data regarding the variability in ground manoeuvre occurrence and sequencing will enable such variability to be captured and characterised within the probabilistic approach. The inclusion of ground manoeuvre occurrence and sequencing variability will increase the accuracy of the estimation of landing gear component fatigue reliability from the methodology. Probabilistic approaches to fatigue design have been proposed as a potential route to developing more efficient landing gear components while increasing the confidence in the components’ retaining their structural integrity in-service(Reference Hoole, Sartor, Booker, Cooper, Gogouvitis, Ghouali, Schmidt, Niepokolczycki and Komorowski18).
Therefore, additional data regarding the variability in aircraft ground manoeuvre occurrence and sequencing are required to validate existing load spectra assumptions and improve the accuracy of existing fatigue design and analysis methods, along with supporting research into a novel probabilistic approach to landing gear fatigue design. As a result, this paper presents a methodology, based on tracking of in-service aircraft, that can be used to generate the required data regarding aircraft ground manoeuvre occurrence and sequencing variability.
1.2 ADS-B datasets and Flightradar24®
During the digital age of the aerospace industry, the availability of ‘real-time’ data from in-service aircraft has grown considerably(Reference Graham, Artim and Daverschot20,Reference Mangortey, Gilleron, Dard, Pinon and Marvis21) . Whilst in-service data were typically only available from specifically instrumented aircraft (e.g. the FAA statistical loads program(15)), recent advances have resulted in aircraft tracking data becoming available within the public domain. Automatic Dependent Surveillance-Broadcast (ADS-B) transponders provide ‘real-time’ information regarding a number of parameters of an aircraft in-service across a flight(Reference SchÄfer, Strohmeir, Lenders, Martinovic and Wilhelm22). The ADS-B transponder is interrogated by a ground-based receiver, and the ADS-B transponder broadcasts a wide range of data, including aircraft speed, altitude, heading and location(Reference SchÄfer, Strohmeir, Lenders, Martinovic and Wilhelm22).
Flightradar24® is an online service that performs tracking of aircraft based upon ADS-B transponder data(23). Flightradar24® provides coverage of civil aircraft fleets across the globe, and generates high-fidelity aircraft tracks across complete aircraft flights. An example ground track for a flight from Flightradar24® is shown in Fig. 2 (23).
It can be observed in Fig. 2 that the ground track has sufficient fidelity to identify the taxi route of the aircraft, including all taxiway turns. Typically, ground tracks are available from aircraft pushback to the takeoff roll and from the landing roll to the aircraft returning to the stand/gate. The ground tracks are generated from Comma-Separated Variable (.csv) files, which contain the aircraft position in latitude and longitude, heading, ground speed in knots (Kn) and calibrated altitude in feet (ft)(23). Within the .csv files, each data row represents a new ADS-B broadcast point, marked by a unique timestamp.
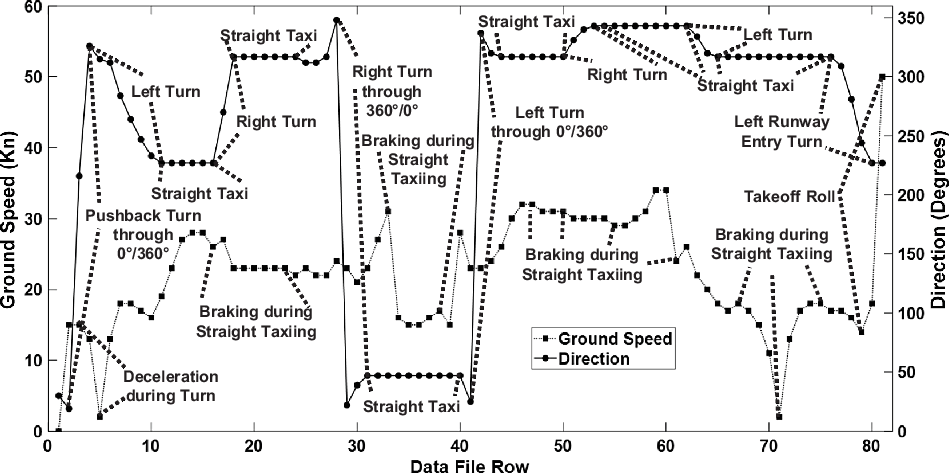
Figure 3 shows a time plot for how the aircraft heading (referred to as ‘direction’ in the .csv files) and speed change with respect to time (represented as each broadcast from the ADS-B transponder and each row within the .csv data file). It should be noted that the x-axis in Fig. 3 only represents the broadcast sequence and is not representative of the time between each ADS-B broadcast. Heading/direction and speed changes can be clearly observed in Fig. 3, and these represent the ground turns and braking applications performed by the aircraft.
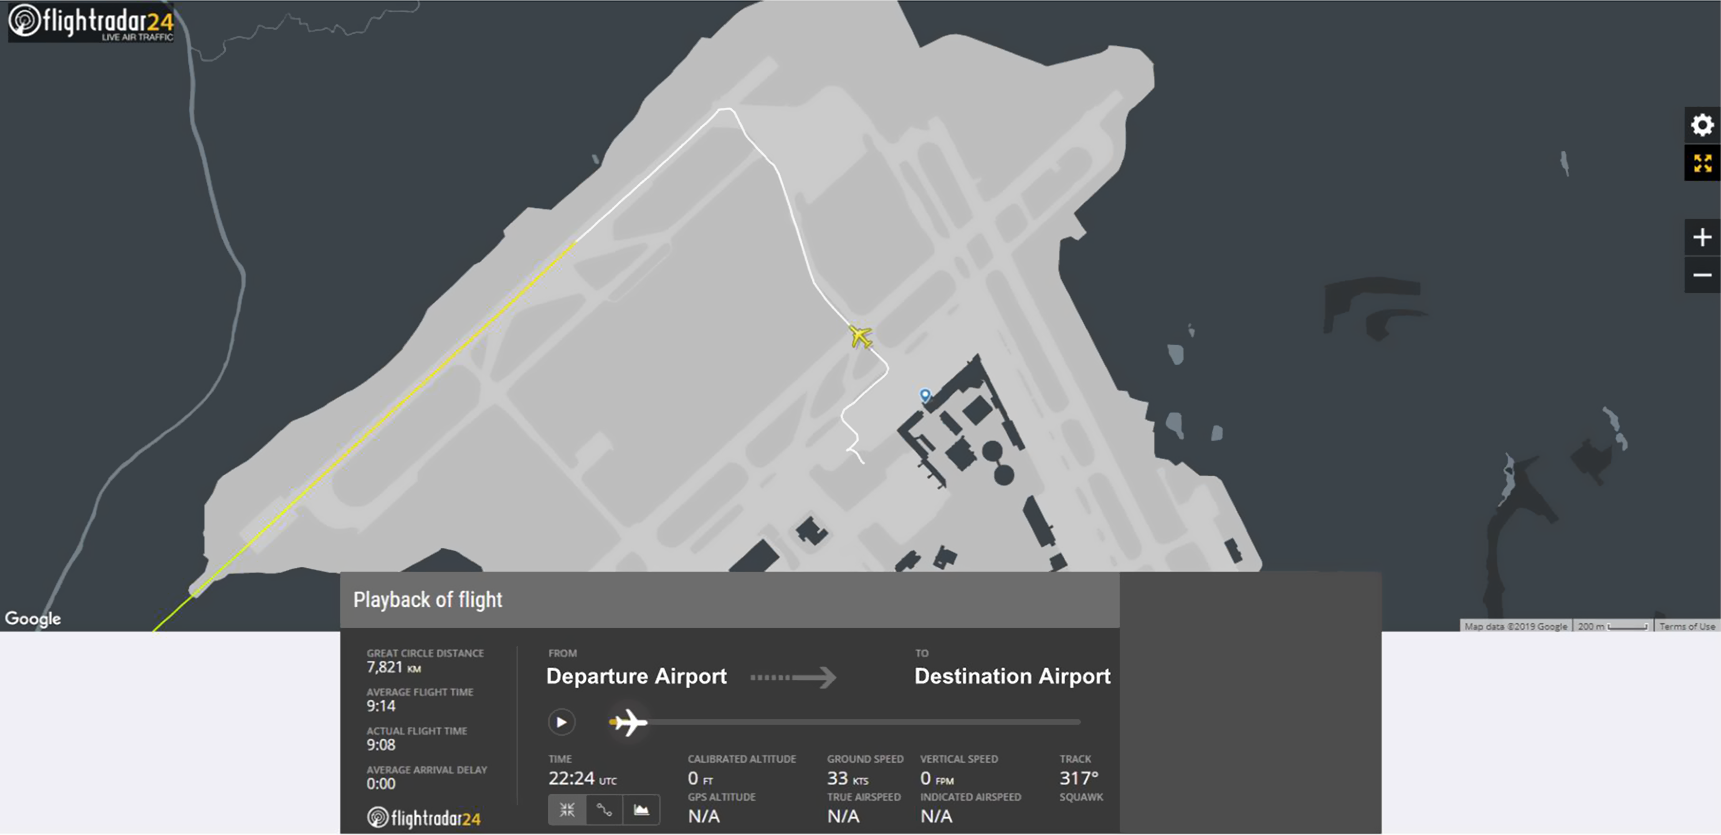
Figure 2. An example of a Flightradar24® ground track based on an ADS-B data file(23). Reproduced with kind permission from Flightradar24®.

Figure 3. A visualisation of the heading/direction and speed values from ADS-B broadcasts in an ADS-B data file from Flightradar24® (23). Dataset reproduced with kind permission from Flightradar24®.
As a result of the data contained within the Flightradar24® ADS-B .csv data files, it is proposed that the following information can be extracted for each flight defined by a Flightradar24® ADS-B .csv data file (as shown in Fig. 3):
-
• Number of turns for pre-takeoff and post-landing taxi phase
-
• Number of braking actions for pre-takeoff and post-landing taxi phase
-
• Direction of pushback from gate
-
• Direction of turn onto stand for arrival at stand/gate
-
• Runway entry direction and type
-
• Runway exit direction and type
A data collection study composed of multiple flights (from multiple Flightradar24® ADS-B .csv data files) could therefore be used to generate statistics that characterise the per-flight variability in the occurrence of specific ground manoeuvres. In addition, if the ground manoeuvre occurrences are extracted in the order in which they occur for each flight, sequencing variability can also be characterised by identifying the manoeuvres preceding and following specific manoeuvre types.
Previous work in the literature has used ADS-B datasets to optimise aircraft flight paths during the approach and landing phase(Reference RodrÍguez-DÍaz, Adenso-DÍaz and GonzÁlez-Torre24). Other applications of ADS-B datasets have considered the optimisation of aircraft taxi routes(Reference Weiszer, Chen and Stewart25,Reference Benlic, Brownlee and Burke26,Reference Brownlee, Weiszer, Chen, Ravizza, Woodward and Burke27,Reference Lange, Sieling and Gonzalez-Parra28) and departure sequencing at specific airports along with other elements of air traffic management(Reference Zhang, Liu, Hu and Zhu29,Reference Anderienko, Anderienko, Fuchs and Garcia30,Reference Alligier and Gianazza31) . Wider applications have included the inference of aircraft flight phases and characteristics from ADS-B data(Reference Sun, Ellerbroek and Hoekstra32,Reference Sun, Ellerbroek and Hoekstra33) , aircraft fleet management(Reference O’kelly34,Reference Ren and Li35) , along with the studying of aircraft emissions and noise(Reference Becco and Joyce36,Reference Sanchez-Perez, Sanchez-Fernandez, Shaout and Suarez-Guerra37,Reference Nowacki and Olenjniczak38) . ADS-B datasets have also been used to support investigations into aircraft accidents(Reference Yu39,Reference Olive and Bieber40) and to study meteorological conditions(Reference Stone41). ADS-B-driven approaches also facilitate potential routes for providing unmanned aircraft situational awareness(Reference McAree, Aitken and Veres42).
Sun et al. provide a comprehensive description of a series of algorithms which extract performance parameters from takeoff to landing for civil aircraft based upon ADS-B data(Reference Sun, Ellerbroek and Hoekstra43). As a result, the proposed utilisation of ADS-B datasets to identify ground manoeuvres being performed by aircraft aims to complement the previous work performed by Sun et al.(Reference Sun, Ellerbroek and Hoekstra43) with a view to characterising the variability in aircraft ground manoeuvre occurrence and sequencing. Therefore, this paper presents a novel application of ADS-B data for ground manoeuvre identification and characterisation. In addition, based upon the review of the literature, the proposed work also represents the first application of ADS-B data to support the design of aerospace structures, specifically the fatigue design of aircraft landing gear. An additional novel aspect of this paper is that it presents an approach for generating aircraft ground manoeuvre data without requiring the instrumentation of dedicated landing gear assemblies or aircraft. In a similar manner, the presented methodology does not require downloading and processing of aircraft flight recorder data. Consequently, the innovative adoption of ADS-B data to identify and characterise aircraft ground manoeuvres presented in this paper does not require interruption to aircraft operations (e.g. to fit sensors or download flight recorder data). The ‘remote’ nature of processing ADS-B data therefore greatly increases the ease of generating aircraft operational and ground manoeuvre data compared with the state of the art.
This paper therefore aims to demonstrate a data collection and processing methodology that can characterise the variability in aircraft ground manoeuvre occurrences and sequencing based on ADS-B data. This will be achieved by describing the algorithms developed to identify manoeuvres within ADS-B data files, along with a demonstration of the methodology based on a fleet of wide-body civil aircraft. Verification of the methodology will also be performed.
2.0 ALGORITHMS FOR ADS-B DATA COLLECTION AND PROCESSING
This section of the paper describes the algorithms required to evaluate the ADS-B data files. The purpose of the algorithms is to convert the broadcast points within the .csv file into a flight ‘strip’ which details the manoeuvres that occur within the pre-takeoff and post-landing taxi phases of the flight. This is achieved by defining algorithms that can identify ground manoeuvres based upon the heading/direction and speed changes as shown above in Fig. 3. The collection of flight strips for an aircraft fleet are then to be processed to generate statistics regarding the per-flight variability in manoeuvre occurrence and sequencing. The overall methodology is visualised in Fig. 4.

Figure 4. A visualisation of the proposed ADS-B data collection and processing methodology.
Raw ADS-B data require significant post-processing(Reference Sun, Ellerbroek and Hoekstra32) and can also be represented in a variety of formats. Flightradar24® provides ADS-B data files for individual flights in .csv format(23). The .csv format is preferable as it neatly segregates the various flight parameters listed above into easily accessible columns. This segregation greatly simplifies the processing of large batches of ADS-B files as .csv files can be easily read by a wide range of computer software packages. Consequently, .csv files are a convenient way of handling ADS-B data for individual aircraft flights.
2.1 Identification of pre-takeoff and post-landing taxi phases
The first step of the data collection process is to identify the pre-takeoff and post-landing taxi phases of the ADS-B data file. The pre-takeoff taxi phase is defined from the first broadcast row to the broadcast row which immediately precedes the first broadcast row within the data file that has a non-zero altitude (i.e. the aircraft has become airborne). The post-landing taxi phase is identified as the first broadcast row with a zero-altitude following the airborne rows of the data file to the last row of the data file.
2.2 Heading and speed change
The pre-takeoff and post-landing broadcast ADS-B data rows are then worked through row-by-row to identify whether the aircraft heading/direction and speed has changed with respect to the previous data row. Heading/direction changes, which are computed by comparing the aircraft heading of the current data row with the previous data row, are used to identify turns. Turns are characterised using the ‘compass’ visualised in Fig. 5, which enables the turn direction to be established using a range of conditional statements based upon the start and end values of the heading/direction change. It is assumed that the aircraft will take the shortest path around the compass, and this is considered an appropriate assumption due to typical airport geometries which result in individual turns usually being no greater than 180° (turns on airport taxiways are typically 45° or 90°). Following the application of the compass during row-by-row characterisation, an Identification (ID) code is applied to each row, either 11 (right turn), 12 (left turn) or 66 (straight taxi). Numeric ID codes, rather than strings or characters, are used to simplify the data processing.
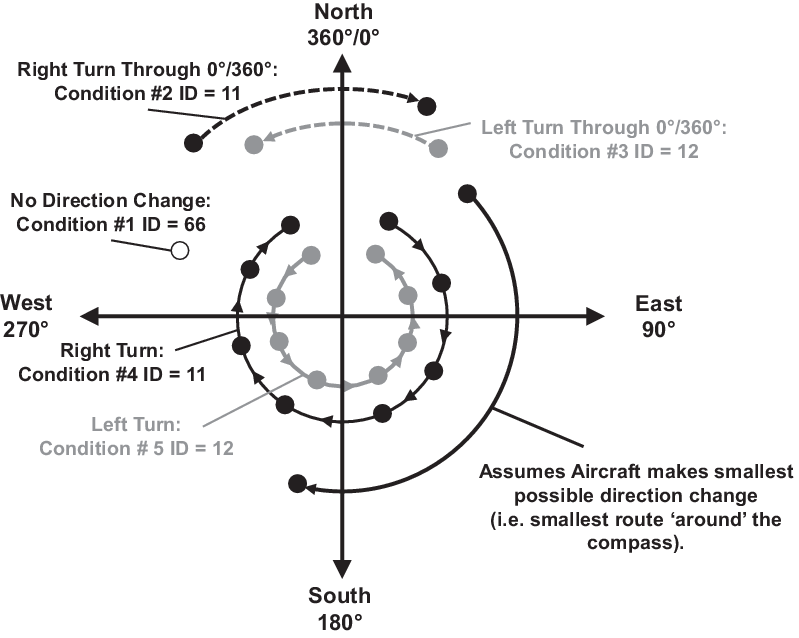
Figure 5. A visualisation of the compass used to characterise heading/direction changes in the ADS-B data file.
The row-by-row characterisation of the ADS-B data files also identifies the speed change between data rows. A deceleration is marked with the ID 42, whilst any increase in speed, or constant speed, is marked with ID 41. An example of a completed row-by-row characterisation is shown in Fig. 6 for a pre-takeoff taxi phase.
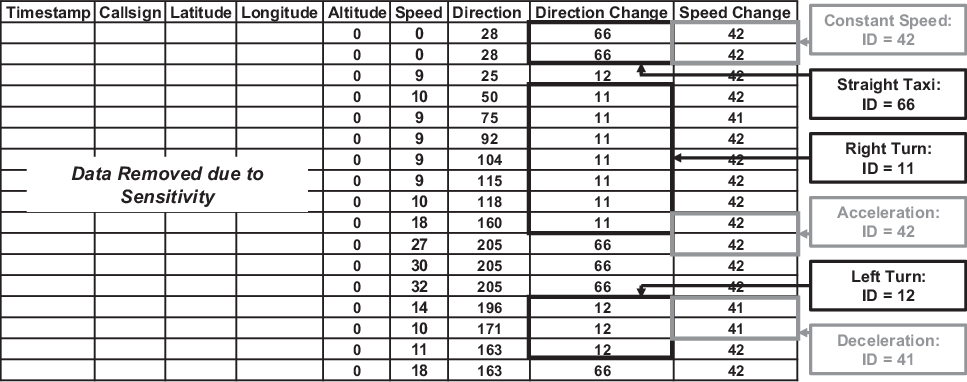
Figure 6. The process of characterising heading/direction and speed changes in the ADS-B data file sourced from Flightradar24®. Dataset reproduced with kind permission from Flightradar24®.
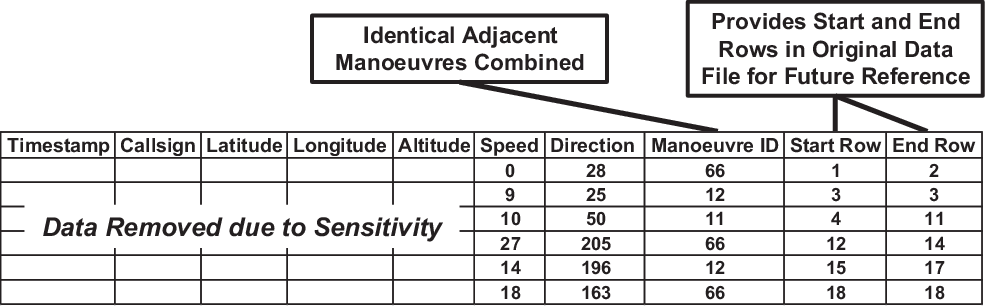
Due to the potential for multiple ADS-B broadcasts every second(23), it is expected that individual turning and braking manoeuvres could be split across several broadcasts and therefore data rows. As a result, the ADS-B data file is again worked through row-by-row and manoeuvres that are adjacent and identical are combined. It should be noted that braking manoeuvres are only combined during straight taxi manoeuvres, as the data within the ADS-B data file cannot identify whether decelerations during turns are as a result of braking or the turning manoeuvre itself. The combination of adjacent manoeuvres results in the manoeuvre sequence shown in Fig. 7.

Figure 7. The process of combining identical adjacent manoeuvres.
2.3 ADS-B data smoothing
During the development of the algorithms, it was observed that noise within the ADS-B data file could result in the identification of turns which were not performed when comparing the ADS-B data file with the Flightradar24® visual ground track. It was identified that the incorrect identification of manoeuvres was as a direct result of noise within the ADS-B data files.
The first source of noise was found to be as a result of small fluctuations of heading/direction value from row to row, typically of 1° to 2°. These small deviations in heading would be counted as a turn, whilst comparison with the Flightradar24® ground track would show that the aircraft was taxiing on a straight taxiway. Therefore, a minimum turn angle of 5° was defined as a threshold for identifying a turn manoeuvre, and this threshold successfully eliminated the false identification of manoeuvres from this source of ADS-B data noise.
Another source of noise was identified in ADS-B data files that showed the aircraft with zero speed but with a constantly changing heading/direction value (i.e. the aircraft was continually pivoting on the spot). Therefore, an additional algorithm was developed that would screen the ADS-B data files prior to row-by-row characterisation and remove elements of the ADS-B data files within which the aircraft heading changed while the aircraft speed was zero.
2.4 Characterisation of pushback entry, runway exit and turn onto stand
During ground manoeuvres, there are a series of ‘milestone’ manoeuvres that mark the transition of the aircraft from one ground taxi phase to the next(15). The first of these is the pushback of the aircraft from the gate/stand, which often involves the aircraft performing a turn in reverse. Prior to the takeoff roll, the aircraft typically enters the runway by performing a turn, and this turn marks the end of the pre-takeoff taxi phase. Following the touchdown and landing roll, the aircraft vacates the active runway, and this turn represents the start of the post-landing taxi phase. Finally, the aircraft typically vacates a taxiway to turn onto the arrival stand or gate, and this represents the final ground manoeuvre of the flight. This section of the paper presents the algorithms used to extract and characterise each of these milestone manoeuvres. The purpose of extracting these manoeuvres is that they typically have different loads applied to the landing gear than standard taxiway turns and braking (e.g. a reversed turn for the pushback and higher turn speeds for the runway exit)(Reference Ladda and Struck2,Reference Buxbaum3,15) .
2.4.1 Pushback
To identify the aircraft pushback, the aircraft must be observed to be travelling in reverse. As ADS-B data files only represent the magnitude of the aircraft ground speed, an alternative algorithm was required to identify whether the aircraft was undergoing pushback. To identify whether the aircraft was travelling in reverse, the latitude and longitude positions from the ADS-B data file could be used to compute the bearing in degrees (°) between two data rows. If this bearing was found to be greater than 90° different than the aircraft heading (i.e. the direction that the aircraft nose is pointing), it was assumed that the aircraft was travelling in a direction opposite to the aircraft nose and therefore pushback was occurring. In the current implementation of the algorithms, only the first manoeuvre in the pre-takeoff flight strip was assessed as to whether the pushback is occurring. This represents a current limitation of the pushback algorithm and is discussed in Section 7.1. Pushbacks are classified as ID 31 for a tail-right pushback or ID 32 for a tail-left pushback. The pushback identification algorithm is visualised in Fig. 8.
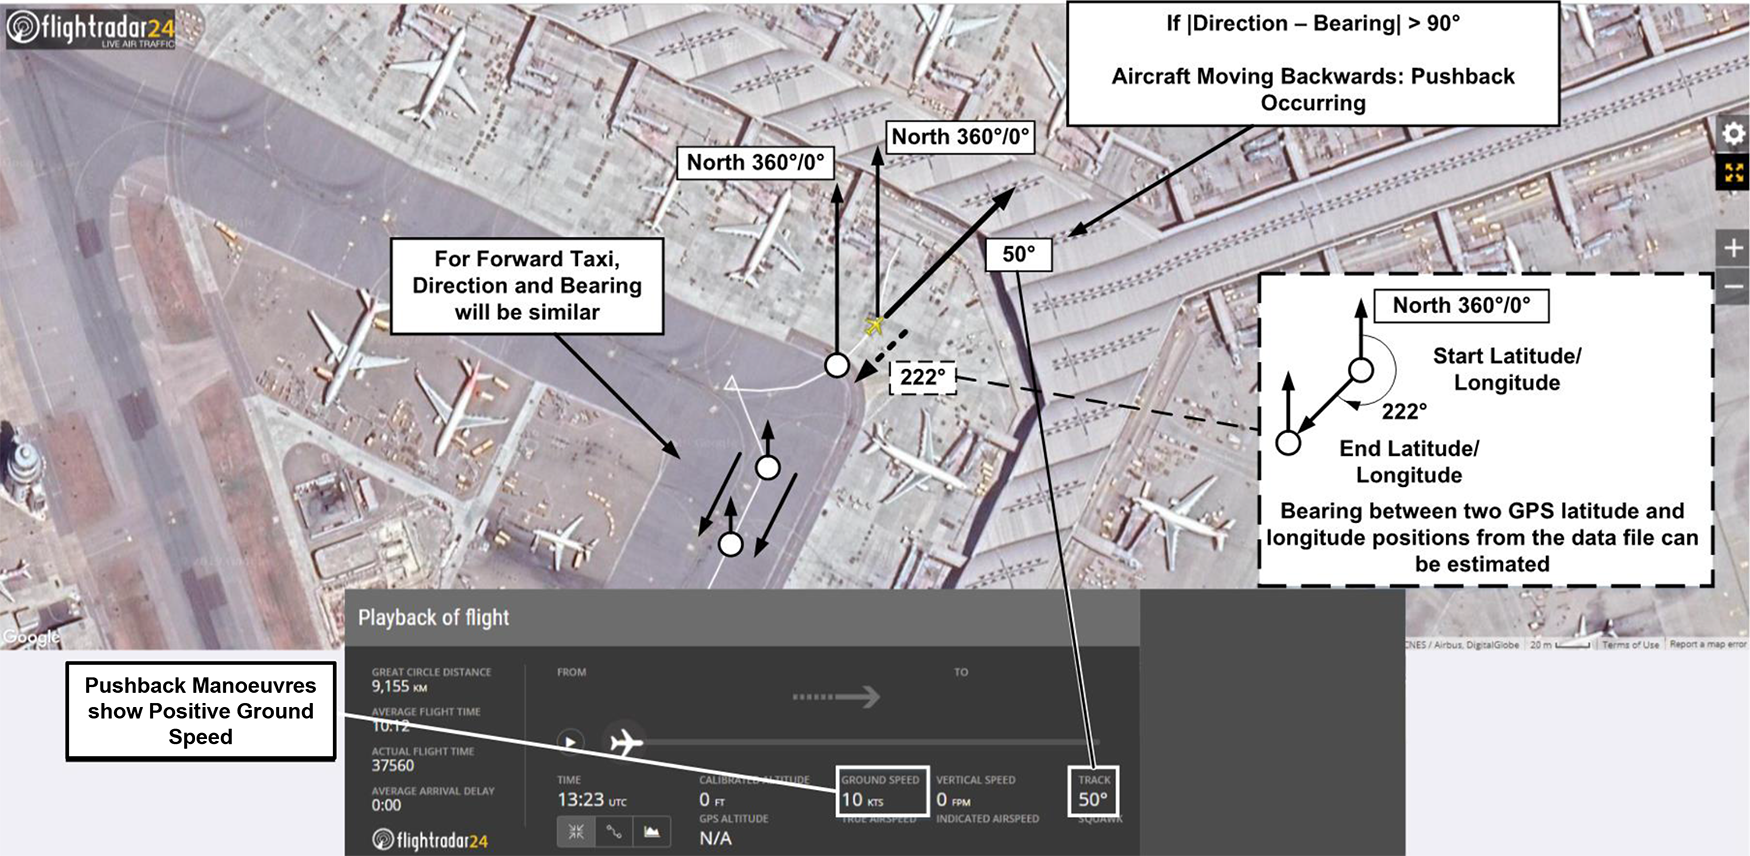
Figure 8. A visualisation of the algorithm used to identify aircraft pushback from ADS-B data files. Original ground track reproduced with kind permission from Flightradar24® (23).
2.4.2 Runway entry
Within the ADS-B data files, it was observed that the takeoff roll could be identified as a straight taxi manoeuvre (ID 66) with a high taxi speed (>50Kn). Therefore, for each pre-takeoff flight strip, the last observed turn prior to the takeoff roll could be identified, and this was assumed to be the runway entry turn. The turn direction could be identified from the ID number and would then be updated to either ID 511 for a right runway entry turn or ID 512 for a left entry. Runway entries are often ‘tight’ or pivoting turns and therefore induce different loads on landing gear compared with a standard taxiway turn(Reference Ladda and Struck2,Reference Buxbaum3) .
It should be noted that another type of runway entry is also possible for civil aircraft. A runway ‘backtrack’, which is often required at smaller airports, results in the aircraft entering the active runway and taxiing in the direction opposite to the intended takeoff direction. When arriving at the end of the runway, the aircraft then performs a tight 180° pivot turn to align with the takeoff direction. Such runway entries were identified by comparing the aircraft latitude and longitude with the known backtrack turn locations for the aircraft fleet within the data collection study (see Section 3.2). It was assumed that, if the aircraft passed within a 100m radius ‘catchment’ zone and demonstrated a 180° turn immediately prior to a takeoff roll, a backtrack runway entry was performed. The identification of backtrack turns is important due to the large torsional loads introduced into the landing gear during the 180° pivot turn(Reference Ladda and Struck2,Reference Buxbaum3) . The identification code ID 521 represents a right backtrack turn, and ID 522 represents a left backtrack turn, where the turn direction represents the direction of the tight 180° turn.
2.4.3 Runway exit
Within ADS-B data files, the landing roll is typically observed as a high-speed straight taxi manoeuvre at the start of the post-landing taxi phase. Therefore, it was assumed that the turn manoeuvre immediately following the landing roll is the runway exit manoeuvre.
Aircraft are able to vacate active runways using taxiways that are either perpendicular to, or are between 30° and 45° degrees from, the landing runway direction. The latter turn types are usually performed using Rapid Exit Taxiways (RETs), which permit the landing aircraft to vacate the active runway at a higher speed(Reference Khadilkar and Balakrishnan44). To identify whether an aircraft performed a high-speed runway exit using a RET, the aircraft speed at the start of the runway exit turn was identified. During the development of the algorithm, it was found that turn entry speeds greater than 30Kn were observed for aircraft using RETs, so this was set as the threshold for identifying whether a standard or high-speed runway exit was performed. The loads applied to landing gear are expected to be significantly different between standard and high-speed runway exits(15), so it is important to classify the runway exit type when constructing landing gear load spectra. The runway exit turn angle was found not to provide a reliable way of characterising runway exit types, as aircraft often perform an additional taxiway turn immediately after they have vacated the runway.
A backtrack runway exit can also be performed, whereby the aircraft continues the landing roll to the end of the runway, prior to performing a tight 180° turn and taxiing along the runway opposite to the landing direction, prior to vacating. This is identified in a similar manner to the backtrack runway entry in Section 2.4.2. The following ID codes were used to represent the runway exit type and direction in each flight strip:
-
• Standard exit: ID 711 (right), ID 712 (left)
-
• High-speed exit: ID 721 (right), ID 722 (left)
-
• Backtrack exit: ID 731 (right), ID 732 (left)
2.4.4 Turn onto stand
From reviewing ADS-B data files during the development of the algorithms and comparing them with Flightradar24® visual ground tracks, it was observed that aircraft would turn onto the arrival stand and either come to a complete stop or the data file would show a taxi speed lower that 15Kn at the end of the data file. Therefore, in the event that the final manoeuvre has a maximum speed lower than 15Kn, it was assumed that this was the aircraft taxiing onto the arrival stand/gate position. The direction of the turn onto stand manoeuvre was identified by the ID of the final turning manoeuvre within the flight strip. ID 81 represents a right turn onto stand, and ID 82 represents a left turn onto stand. The identification of the turn onto stand direction is required as, due to the congested nature of aircraft gates and ramp areas, the turn onto stand is typically a tight or pivoting turn, resulting in larger torsional loads on the landing gear.
2.5 Generation of ground manoeuvre occurrence and sequence statistics
Following the identification of the milestone manoeuvres, the completed flight strip can then be assembled. An example of a completed flight strip is shown in Fig. 9 and represents the ground manoeuvres that occur for a flight and the sequence in which they occur. The start row and end row shown in Fig. 9 represent the original data rows and ADS-B broadcasts in the original ADS-B data file.
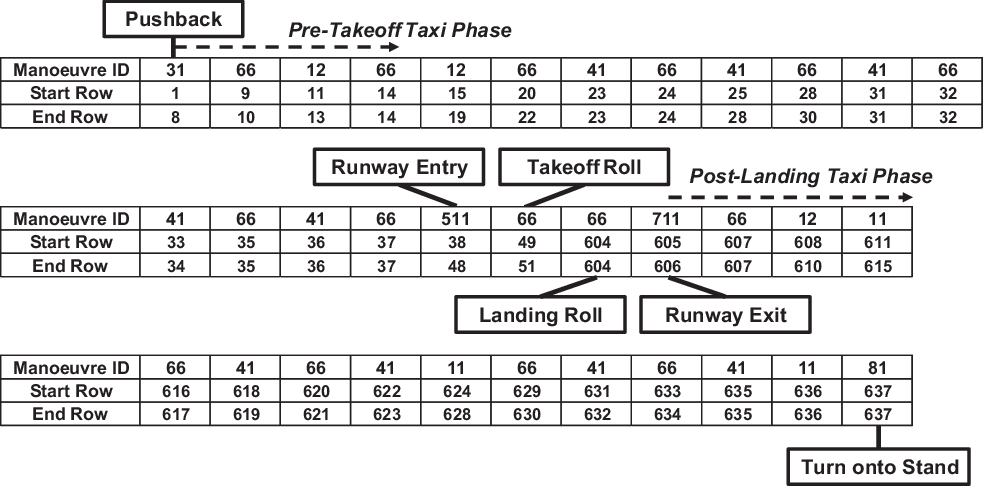
Figure 9. A flight strip constructed by applying the algorithms to the ADS-B data file.
For the flight shown by the flight strip in Fig. 9, the number of pre-takeoff and post-landing turn and braking manoeuvres can be counted. This process, when repeated for multiple flights, enables the identification of how the number of turn and braking manoeuvres varies on a per-flight basis across a fleet of aircraft. In addition, over the repeated flights, a ‘tally’ for each milestone manoeuvre type and turn direction can also be recorded.
Finally, the manoeuvre sequencing for each flight strip can be identified. For each type of manoeuvre, a tally is kept of the manoeuvre that immediately follows it (except for the runway entry and turn onto stand, for which it is the manoeuvre preceding these manoeuvres that is of interest). From the tally values, the proportional share of the manoeuvres either following or preceding a certain type of manoeuvre can be computed.
3.0 METHODOLOGY DEMONSTRATION
The remainder of this paper aims to demonstrate the utility of the algorithms described in Section 2, with a view to generating statistics regarding the variability in ground manoeuvre occurrence and sequencing for aircraft landing gear. Within this section, the implementation strategy for the methodology will be described, along with the example Flightradar24® ADS-B dataset used to demonstrate the methodology.
3.1 Implementation of methodology
The algorithms described in Section 2 were implemented within a MATLAB® environment, which read the ADS-B data files and applied the algorithms to produce a corresponding flight strip for each ADS-B data file. An additional MATLAB® script was then used to store the ‘tally’ values from each flight strip to produce the ground manoeuvre occurrence and sequence statistics.
3.2 Demonstration dataset
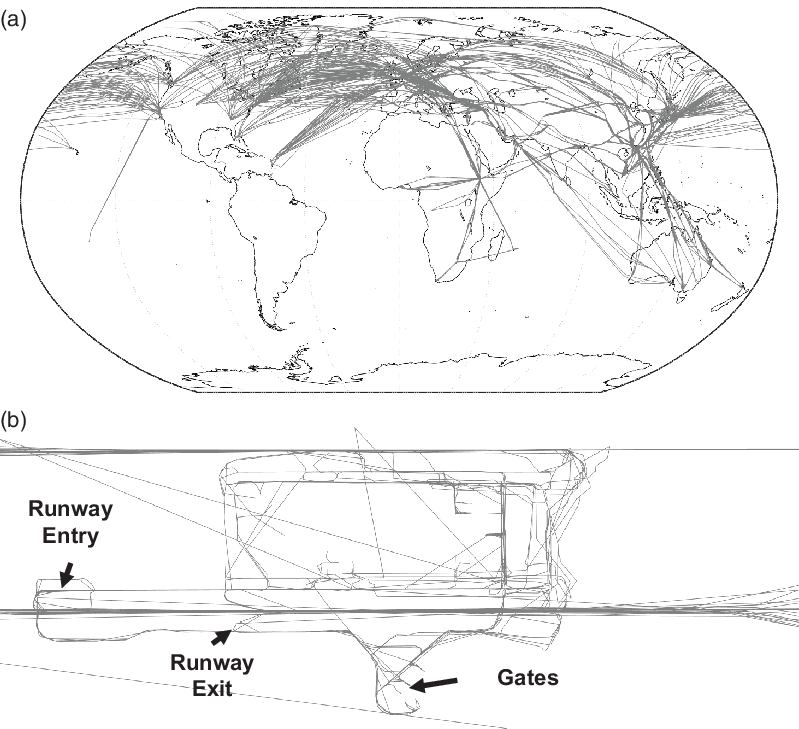
To demonstrate the data collection and processing methodology, a wide-body civil aircraft that is currently in production was selected. A wide-body civil aircraft was selected due to the availability of existing data on wide-body aircraft ground manoeuvres (albeit limited with respect to variability) from Ladda and Struck(Reference Ladda and Struck2) and the FAA statistical loads program(15). At the time of writing, the selected wide-body civil aircraft performs approximately 2,500 individual flights/sectors a week(23). The selected wide-body civil aircraft currently operates into and from both small and medium-sized airports, along with large international airports. The selected wide-body civil aircraft also operates globally across multiple operators, as highlighted by the route network shown in Fig. 10(a).

Figure 10. (a) The route network for the wide-body civil aircraft included in the demonstration dataset(23). (b) A demonstration of the fidelity of the ADS-B ground tracks, which trace out the key features of an airport geometry.
The route network for each operator of the wide-body civil aircraft was identified using Flightradar24® and the ADS-B coverage was evaluated at each departure and arrival airport within the route network(23). It was observed that limited reception was available at certain airports (especially at stand/gate locations). As this limited reception resulted in inaccurate ground tracks, these routes were omitted from the dataset. The aircraft utilisation on the remaining routes was then identified. If the wide-body civil aircraft was used on a given route five times in a week, five ADS-B data files for the route were randomly selected from across the period of a single year. Random sampling from across the period of a year was performed with the intention of capturing the aircraft fleet operating in different seasons, to ensure that the effect of environmental conditions and weather (e.g. rain and snow) on aircraft ground manoeuvres would be captured. The random sampling of flights in a manner that is proportional to the actual aircraft utilisation in-service was performed to produce ground manoeuvre statistics that would be representative of the entire wide-body civil aircraft fleet (i.e. all aircraft of a given type in-service, also known as the manufacturer’s fleet). In addition, random sampling across all operators in proportion to the weekly utilisation of the aircraft ensured that various taxiway and runway layouts and surface conditions were captured, whilst also accounting for differing operational practices that may exist across the globe. The random sampling of flights resulted in 1,265 Flightradar24® ADS-B data files being sourced from Flightradar24® (23) and the resulting routes are shown in Fig. 10(a).
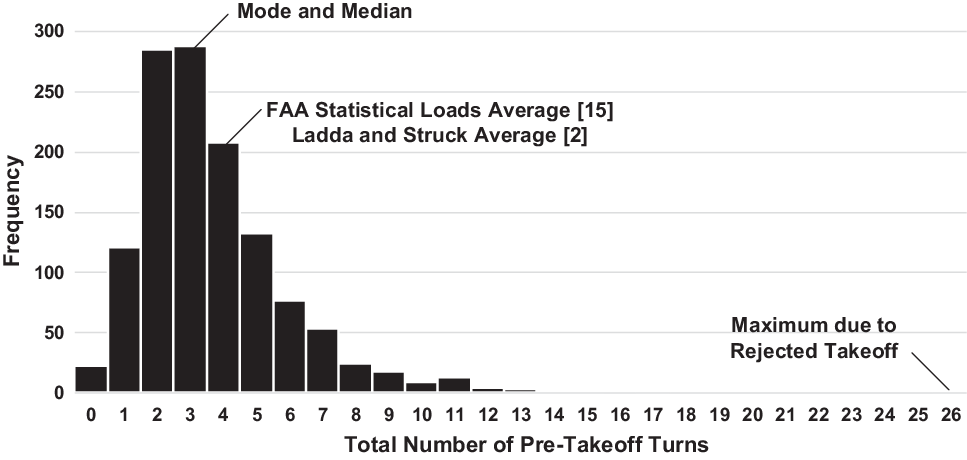
Figure 11. A histogram of the number of pre-takeoff turns for the wide-body civil aircraft.
Figure 10(b) shows the ground tracks across the wide-body civil aircraft fleet at a single airport; the high fidelity of the Flightradar24® ADS-B data files can be observed as key elements of airport geometry can be identified. It should be noted that the randomly sampled ADS-B data files were manually checked to ensure high-fidelity ground tracks were available.
4.0 GROUND MANOEUVRE OCCURRENCE STATISTICS
Following the implementation of the algorithms for processing the ADS-B data and the assembly of the demonstration dataset, the data collection and processing methodology was applied to produce ground manoeuvre statistics for the wide-body civil aircraft. The results from applying the methodology to the 1,265 ADS-B data files were segregated into ground manoeuvre occurrence statistics and ground manoeuvre sequencing statistics. This section of the paper presents the results that can be used to characterise the ground manoeuvre occurrence variability of a fleet of wide-body civil aircraft.
4.1 Pre-takeoff taxi phase manoeuvres
Figure 11 shows the total number of pre-takeoff turns per flight and the frequency with which they were observed across the 1,265 flights of the demonstration dataset study. The mode number of pre-takeoff turns was found to be three pre-takeoff turns per flight, which shows good agreement with previous studies into wide-body aircraft ground manoeuvres, which suggest that four pre-takeoff turns per flight is typical(Reference Ladda and Struck2,15) . The minimum number of pre-takeoff turns was zero, representing a flight that entered the runway directly from pushback, which is possible when operating from smaller airport geometries. The maximum number of pre-takeoff turns was 26, and an investigation into this result highlighted that the aircraft had performed a Rejected TakeOff (RTO), which would be expected to result in additional turns. Figure 11 also shows that a significant number of flights have greater than five pre-takeoff turns, and these flights were found to be operating from large international airports with complex airport geometries.
It can be observed from Fig. 11 that the histogram of the number of pre-takeoff turns demonstrates positive or ‘right-tail’ skew. The presence of a skewed distribution results in the assumption made in previous studies of an ‘average’ number of turns per flight(Reference Ladda and Struck2) failing to accurately represent the underlying variability in the manoeuvre occurrence. The use of the average number of turns would require the assumption of a symmetric distribution, where every number of turning occurrences ‘above’ the average value is also represented ‘below’ the average value. As a result, the assumption of an average number of turns would fail to account for flights that will have a large number of turns when constructing landing gear load spectra for fatigue design.
The pre-takeoff turns across the flights of the demonstration dataset can also be decomposed into the number of pre-takeoff left and pre-takeoff right turns for each flight, as shown respectively in Fig. 12(a) and (b). The mode number of occurrences for both turn directions is one while the median is two, highlighting the positive skew in the histograms. Figure 12(c) shows that the share between left and right turns is approximately equal. Within existing landing gear fatigue design practice, it is typically assumed that the number of left and right turns across the load spectrum are equal(4), thus the occurrence results generated from the ADS-B data shown in Fig. 12(c) provide support and validation for this existing design assumption.
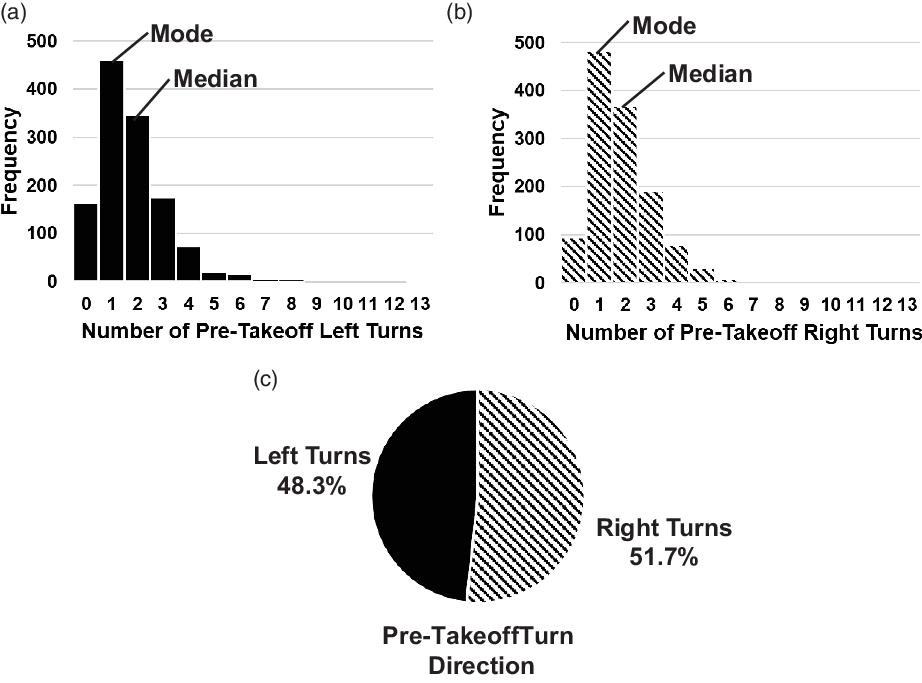
Figure 12. Pre-takeoff turn direction statistics for the wide-body civil aircraft: (a) histogram of number of pre-takeoff left turns, (b) histogram of number of pre-takeoff right turns and (c) proportional share between turn direction for pre-takeoff turns.
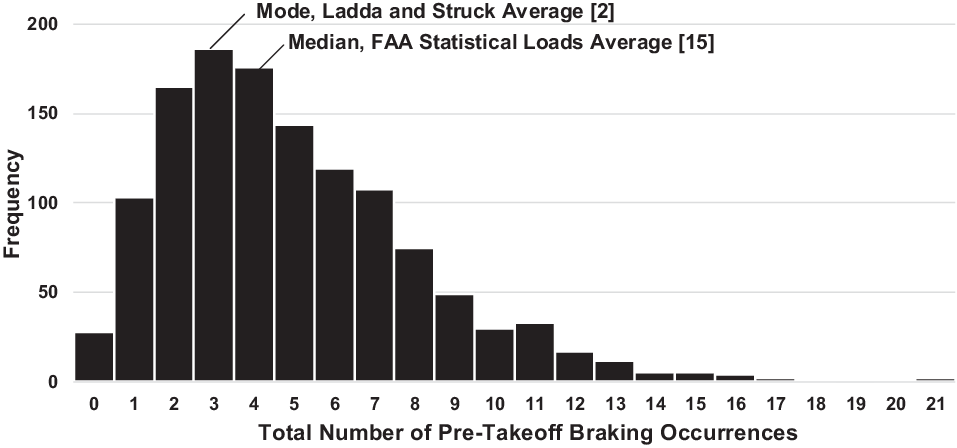
Figure 13 shows the total number of pre-takeoff braking applications per flight and the frequency with which they were observed across the 1,265 flights of the demonstration dataset study. The mode and median number of pre-takeoff braking applications were three and four, respectively, showing consistency with the previous studies into wide-body aircraft ground manoeuvres(Reference Ladda and Struck2,15) . The presence of the positive skew of the histogram in Fig. 13 also suggests that it is inappropriate to consider ‘average’ number of braking applications per flight, based upon the reasoning above, during the pre-takeoff taxi phase. As for the pre-takeoff turning manoeuvre occurrences, previous studies have assumed an average number of braking occurrences(Reference Ladda and Struck2), so it is possible that landing gear load spectra based upon this assumption would fail to account for flights in the upper tail of the pre-takeoff braking occurrences histogram.

Figure 13. Histogram of the number of pre-takeoff braking occurrences for the wide-body civil aircraft.
4.2 Post-landing taxi phase ground manoeuvres
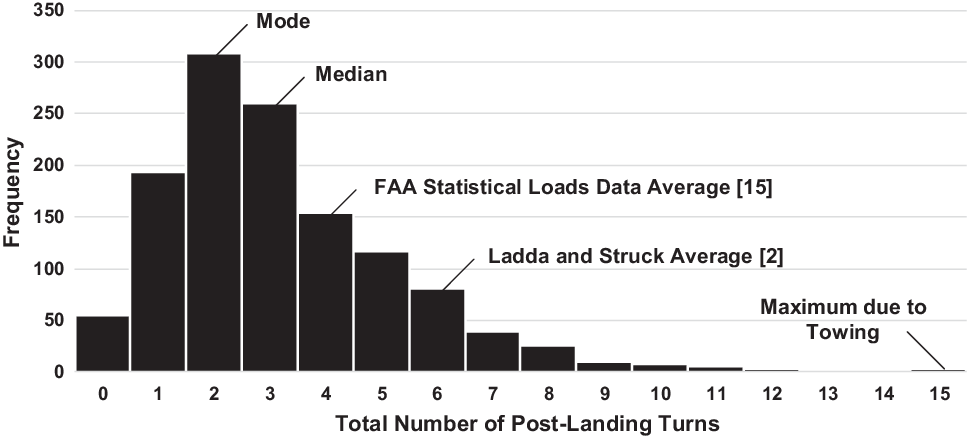
Figure 14 shows the total number of post-landing turns per flight and the frequency with which they were observed across the 1,265 flights of the demonstration dataset study. The mode and median number of turns post-landing were found to be two and three, respectively. Therefore, the mode number of turns post-landing was found to be smaller than the mode number of turns pre-takeoff. This is to be expected as the pre-takeoff taxi out to the runway will require the aircraft to taxi to the threshold at the end of the runway, rather than routing directly from where the aircraft vacates following landing, as aircraft do not use the full runway length on landing for every flight. The more direct taxi routing could potentially result in fewer turns being performed by the aircraft during the post-landing taxi phase, prior to turning onto the arrival stand.

Figure 14. Histogram of the number of post-landing turns for the wide-body civil aircraft.
Note that the mode number of post-landing turns is significantly lower than the six turns for a wide-body civil aircraft suggested by Ladda and Struck(Reference Ladda and Struck2). It is currently unclear why the wide-body aircraft within the ADS-B data files demonstrated lower post-landing turn occurrences. The minimum number of turns was found to be zero, corresponding to flights arriving at smaller airports where the aircraft taxies directly onto stand after exiting the runway. The maximum number of turns was found to be 15 as a result of the aircraft being towed from the arrival gate. Figure 14 also demonstrates positive skew in the number of turns post-landing, again contradicting the use of average ground manoeuvre occurrences within landing gear load spectra.
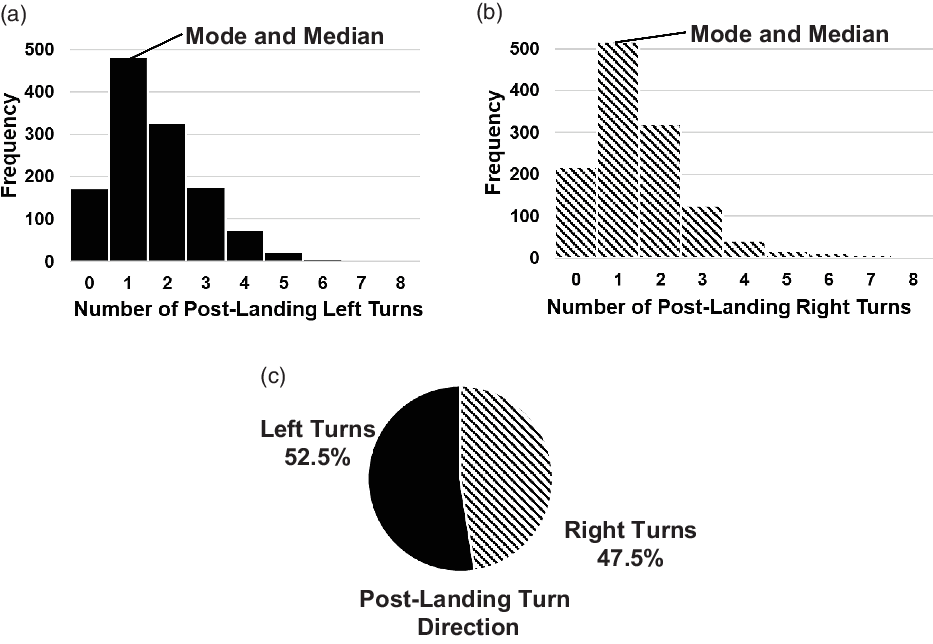
The post-landing turns can also be decomposed into the number of post-landing left and post-landing right turns for each flight, as shown respectively in Fig. 15(a) and (b). The mode and median number of occurrences for both turn directions are both one. Figure 15(c) shows that the share between post-landing left and right turn directions is approximately equal. The approximately equal share between post-landing left and right turn directions provides further validation of the assumption of equal share of turn direction currently used when constructing landing gear load spectra(4).

Figure 15. Post-landing turn direction statistics for the wide-body civil aircraft: (a) histogram of number of post-landing left turns, (b) histogram of number of post-landing right turns and (c) proportional share between turn direction for post-landing turns.
Figure 16 shows the variability in post-landing braking occurrence per flight across the 1,265 flights of the demonstration ADS-B dataset. Figure 16 demonstrates strong agreement with the pre-takeoff braking applications shown in Fig. 13, as for both pre-takeoff and post-landing phases, the mode and median values were three and four braking occurrences, respectively. These values also show good agreement with previous studies on wide-body aircraft ground manoeuvres, as shown in Fig. 16 (Reference Ladda and Struck2,15) . Once again, the histogram for the post-landing braking occurrences demonstrates positive skew, further suggesting that the assumption of average manoeuvre occurrences per flight is unsuitable for the wide-body civil aircraft.
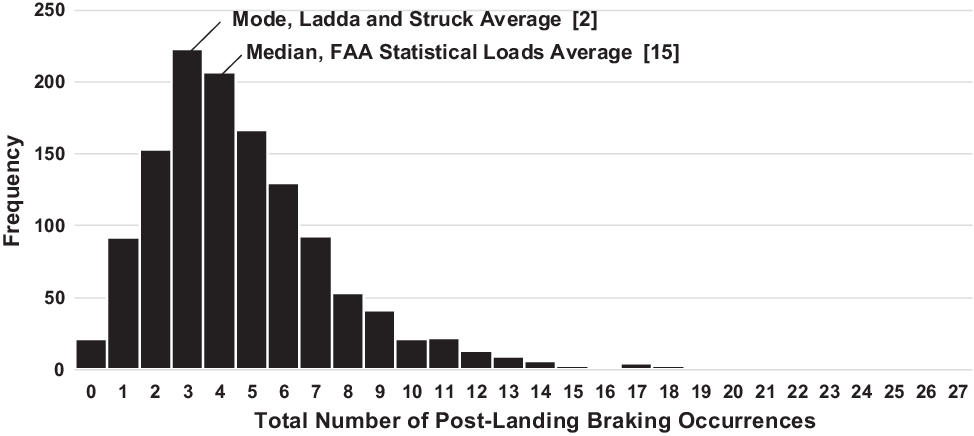
Figure 16. Histogram of the number of post-landing braking occurrences for the wide-body civil aircraft.
4.3 Correlation between turning and braking manoeuvres
Within the existing practice for constructing landing gear load spectra, it is typically assumed that, for every left turn that an aircraft performs, a right turn will also be performed within the same taxi phase, and vice versa(Reference Ladda and Struck2). This assumption therefore introduces a correlation which represents that, as the number of turns of a given direction increases for a taxi phase, the number of turns in the opposite direction should also increase.
To investigate whether the ADS-B data files for the wide-body civil aircraft support the assumption of a correlation between the occurrence of turn directions within a single taxi phase, the correlation between the occurrence of left and right turns for both pre-takeoff and post-landing was identified for the wide-body civil airliner.
Figure 17(a) shows a contour plot representing how the number of pre-takeoff right turns varies with the number of pre-takeoff left turns, where a lighter shade in the contour plot represents a more commonly observed combination of left and right turns from the ADS-B data files. From Fig. 17(a) it can be observed that the most common combination of turns was one left turn and one right turn during the pre-takeoff taxi phase. Figure 17(a) also highlights that there is a slight ‘stretch’ in the contour plot representing that, as the number of pre-takeoff left turns increases, so does the number of pre-takeoff right turns. This can be supported using the Pearson correlation coefficient(Reference Montgomery and Runger45), which for Fig. 17(a) is
 $\rho = 0.660$
, suggesting a moderate correlation (as correlations above
$\rho = 0.660$
, suggesting a moderate correlation (as correlations above
 $\rho = |0.8|$
are considered ‘strong’ and correlations below
$\rho = |0.8|$
are considered ‘strong’ and correlations below
 $\rho = |0.5|$
are considered ‘weak’(Reference Montgomery and Runger45)). Figure 17(b) shows the contour plot representing the correlation between the number of left and right turns during the post-landing taxi phase. Figure 17(b) demonstrates a similar relationship to the pre-takeoff taxi phase in Fig. 17(a), and this is supported by the correlation coefficient of
$\rho = |0.5|$
are considered ‘weak’(Reference Montgomery and Runger45)). Figure 17(b) shows the contour plot representing the correlation between the number of left and right turns during the post-landing taxi phase. Figure 17(b) demonstrates a similar relationship to the pre-takeoff taxi phase in Fig. 17(a), and this is supported by the correlation coefficient of
 $\rho = 0.619$
. As a result, it can be summarised that, regardless of taxi phase, the number of left and right turns are moderately correlated. This result supports the assumption currently made in existing design practice, of increasing occurrence of left turns for an increasing occurrence of right turns(4).
$\rho = 0.619$
. As a result, it can be summarised that, regardless of taxi phase, the number of left and right turns are moderately correlated. This result supports the assumption currently made in existing design practice, of increasing occurrence of left turns for an increasing occurrence of right turns(4).
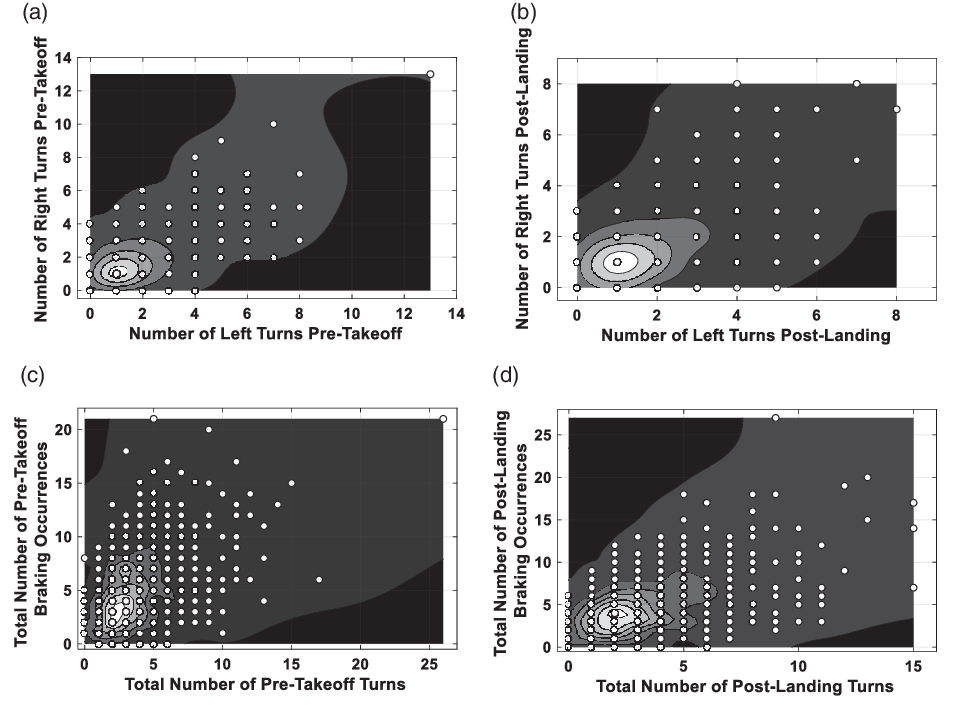
Figure 17. Contour plots highlighting the correlation between turning and braking manoeuvres: (a) correlation between pre-takeoff left and right turns, (b) correlation between post-landing left and right turns, (c) correlation between pre-takeoff turns and pre-takeoff braking occurrences and (d) correlation between post-landing turns and post-landing braking occurrences.
During the analysis of the results of the ADS-B data files, it was hypothesised that a correlation may also exist between the total number of turns and the number of braking occurrences within a taxi phase, as it would be expected that aircraft would decelerate prior to performing a turn. Therefore, the correlation between turning and braking occurrences for the pre-takeoff and post-landing taxi phases was investigated. Figure 17(c) shows a contour plot of the number of pre-takeoff braking occurrences compared with the total number of pre-takeoff turns. The contour plots highlight that the most commonly observed combination was two pre-takeoff turns with two pre-takeoff braking occurrences. Whilst the contour plot demonstrates a potential relationship of increasing number of braking occurrences for increasing number of turns, the correlation coefficient value of
 $\rho = 0.452$
suggests that only a weak correlation is present. Figure 17(d) shows the correlation between the number of post-landing braking occurrences and total number of post-landing turns. It can be observed from Fig. 17(d) that the most commonly observed combination was two turns and four braking occurrences during the post-landing phase. The correlation coefficient value of
$\rho = 0.452$
suggests that only a weak correlation is present. Figure 17(d) shows the correlation between the number of post-landing braking occurrences and total number of post-landing turns. It can be observed from Fig. 17(d) that the most commonly observed combination was two turns and four braking occurrences during the post-landing phase. The correlation coefficient value of
 $\rho = 0.503$
demonstrates again that only a weak correlation is to be expected between the number of braking manoeuvres and total number of turns. Therefore, while a moderate correlation is expected between left and right turn occurrences, only a weak correlation is observed for turning and braking occurrences, regardless of taxi phase.
$\rho = 0.503$
demonstrates again that only a weak correlation is to be expected between the number of braking manoeuvres and total number of turns. Therefore, while a moderate correlation is expected between left and right turn occurrences, only a weak correlation is observed for turning and braking occurrences, regardless of taxi phase.
4.4 Share of turns and braking across flight
To identify whether more turning or braking manoeuvres occur during the pre-takeoff or post-landing taxi phases, the total number of turning and braking occurrences were computed for both taxi phases. Figure 18(a) shows the share of pre-takeoff and post-landing turning manoeuvres across the 1,265 flights within the ADS-B dataset, revealing that 53.2% of turns were found to occur during the pre-takeoff phase while the remaining 46.8% of turns were performed post-landing. Figure 18(b) shows the share of braking manoeuvres across the pre-takeoff and post-landing phases. Figure 18(b) demonstrates that the share of braking occurrences is approximately equal across the pre-takeoff and post-landing phases. The approximately equal share of manoeuvre occurrences across the pre-takeoff and post-landing taxi phases contradicts assumptions that are made regarding general aircraft manoeuvres, that is, that different manoeuvre occurrences are observed pre-takeoff and post-landing(4).
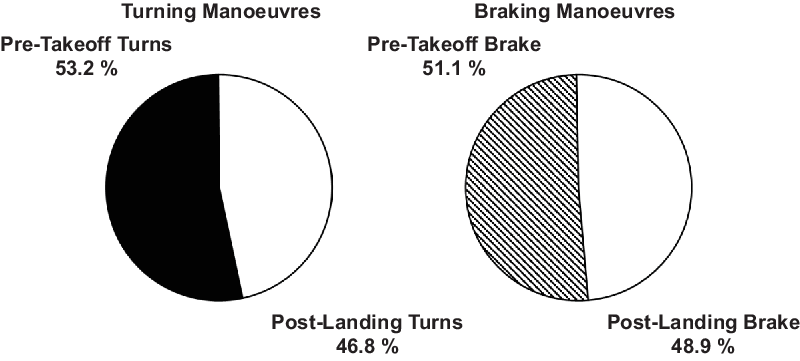
Figure 18. The proportional share of (a) turning manoeuvres and (b) braking occurrences across pre-takeoff and post-landing taxi phases for the wide-body civil aircraft.
4.5 Occurrence statistics of milestone manoeuvres
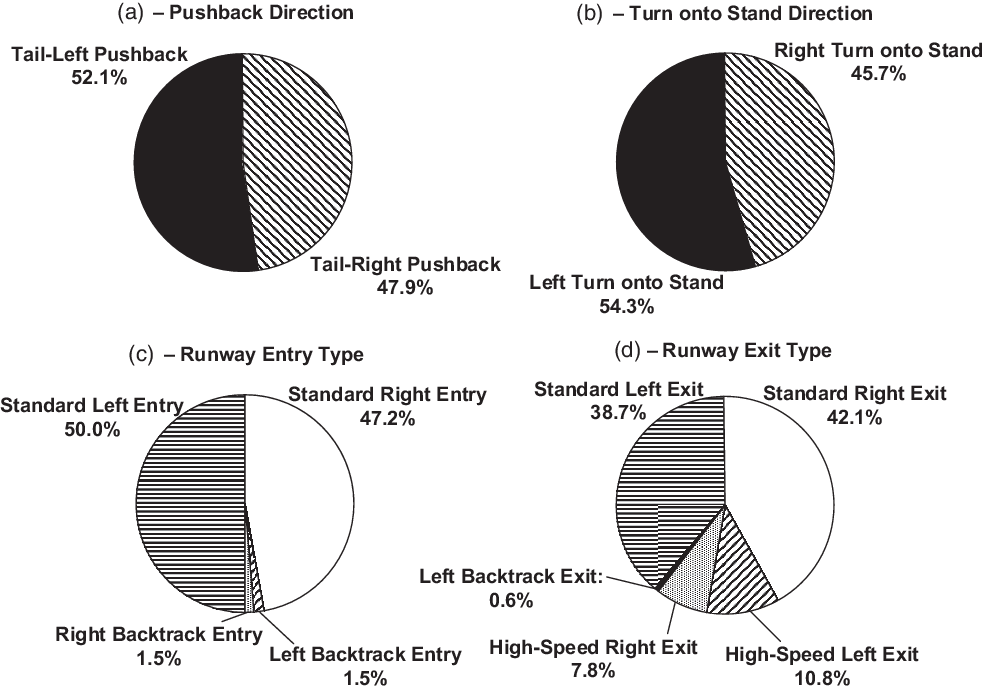
Following the characterisation of the variability in turning and braking manoeuvre occurrences, the proportional share of milestone manoeuvre types was identified for pushback, runway entry, runway exit and turn onto stand manoeuvres. Figure 19 shows the proportional share of manoeuvre types for each of the milestone manoeuvres.

Figure 19. Proportional share of milestone manoeuvres for the wide-body civil aircraft: (a) pushback direction, (b) turn onto stand direction, (c) runway entry type and direction and (d) runway exit type and direction.
Figure 19(a) shows that the direction of aircraft pushback is approximately equal, with 52.1% and 47.9% of pushback manoeuvres being tail-left and tail-right, respectively. The slight discrepancy in the equal share is expected to be as a result of the 283 flights which did not provide pushback data (22.4% of the dataset). Figure 19(b) presents the share of turn onto stand direction, with 54.3% of flights performing a left turn onto stand. In a similar manner to the pushback manoeuvre, it was expected that the share between left and right turn onto stand directions would be approximately equal, and the resulting discrepancy is expected to be as a result of the 16.3% of flights within the dataset which failed to provide information regarding the turn onto stand direction. Therefore, across the pushback and turn onto stand manoeuvres, the turn direction across the wide-body aircraft fleet is approximately equal.
Figure 19(c) shows the runway entry manoeuvre type, revealing that the vast majority (97.2%) of flights within the ADS-B dataset performed a standard runway entry, with the direction of the runway entry being approximately equally shared between left and right runway entries. The 2.8% of flights performing a backtrack runway entry shows good agreement with the wide-body aircraft route network at the time of writing, of which 3.3% of routes (based on their proportion of the weekly fleet utilisation) operate out of airports requiring a runway backtrack prior to takeoff(23). It can also be observed from Fig. 19(c) that the left and right turn directions have an approximately equal share of the runway backtrack entry manoeuvres.
Figure 19(d) shows the proportional share of the runway exit type and direction across the 1,265 flights in the ADS-B demonstration dataset, revealing that 80.8% of runway exit turns were found to be standard runway exits (i.e. low-speed turns), with left and right turn directions having an equal proportion. Runway exits using RETs (i.e. high-speed, <45° turns) were only observed for 18.5% of flights. This result may be as a consequence of the selected wide-body aircraft, which operates into a significant number of airports that do not have RETs(23). In addition, an aircraft may vacate using an RET, but at a slower speed than the runway exit algorithm of 30Kn, which would result in the identification of a standard runway exit. Only 0.6% of flights demonstrated a backtrack exit from the runway. Whilst 3.3% of the wide-body aircraft route network was observed to operate into airports which may require a runway backtrack, the aircraft were typically observed to vacate the runway at an earlier taxiway, removing the need to perform a runway backtrack. It can be observed from Fig. 19(d) that the turn directions for both standard and high-speed runway exits are approximately equal in proportion across the wide-body aircraft fleet.
The results shown in Fig. 19 provide further support to the existing assumption that the direction of ground turning manoeuvres is equally shared between left and right turns(4). Therefore, it can be concluded that, regardless of taxi phase and turning manoeuvre type, an equal proportion of left and right turns is performed across the wide-body civil aircraft fleet.
5.0 GROUND MANOEUVRE SEQUENCING STATISTICS
This section of the paper presents the results and statistics from the identification of manoeuvre sequencing. Sequencing in this context refers to the order in which manoeuvres occur during each flight and can be characterised by identifying the proportional share of a given manoeuvre occurring after a specific manoeuvre. This was achieved by counting a ‘tally’ of manoeuvres either preceding or following a certain type of manoeuvre across the 1,265 flights in the ADS-B demonstration dataset. Note that, to the authors’ knowledge, there have been no previous studies into the sequencing of aircraft ground manoeuvres, so the results presented within this section are supported solely by the verification activities described in Section 6.
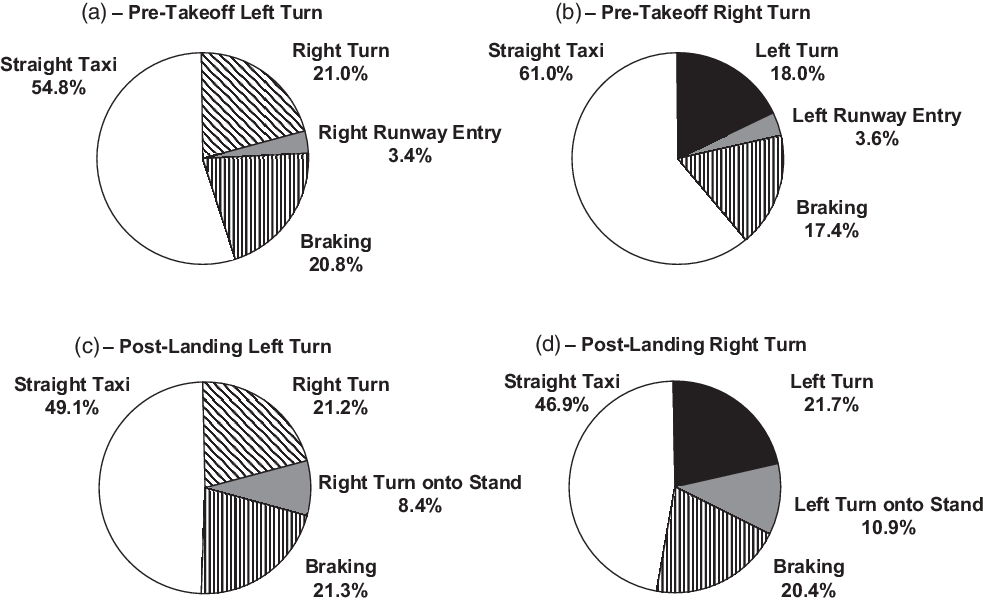
Figure 20. Proportional share of manoeuvres following turning manoeuvres for the wide-body civil aircraft: (a) manoeuvres following pre-takeoff left turn, (b) manoeuvres following pre-takeoff right turn, (c) manoeuvres following post-landing left turn and (d) manoeuvres following post-landing right turn.
Figure 20 shows the proportional share of manoeuvres occurring after pre-takeoff and post-landing turns across the flights within the dataset. Figure 20(a) and (b) show the ratio of manoeuvres following pre-takeoff left and right turns, respectively. It can be observed in Fig. 20(a) and (b) that the majority of pre-takeoff turns are followed by straight taxi, regardless of the turn direction. A similar observation can be made for post-landing turns from Fig. 20(c) and (d), where the greatest proportion of manoeuvres following a post-landing turn is straight taxi.
For all taxi phases and turn directions, Fig. 20 therefore shows that a turn in the opposite direction occurs in only approximately 20–30% of manoeuvres. A turn reversal (e.g. a left turn directly into right turn) would result in the side and torsional loads applied to the landing gear being fully reversed. However, Fig. 20, based upon the wide-body civil aircraft fleet, suggests that it is more common for landing gear to be returned to an ‘unloaded’ state (with respect to the torsional loads in the landing gear from turning) as the aircraft performs a straight taxi manoeuvre. It should be noted that this observation contradicts existing practice within the construction of landing gear load spectra, which assumes that turns in a given direction are immediately followed by a turn in the opposite direction (i.e. a turn reversal)(Reference Ladda and Struck2).
From further consideration of Fig. 20(a) and (b), it can be seen that the proportional share of following manoeuvres is similar for both left and right turns. The same observation can be made considering post-landing turns in Fig. 20(c) and (d). This suggests that the sequencing of manoeuvres after a turn is insensitive to the turn direction. However, when comparing the proportional share values across Fig. 20, it can be observed that the proportions for manoeuvres following turns does vary when comparing between pre-takeoff and post-landing phases. For example, comparing Fig. 20(a) and (b) with Fig. 20(c) and (d) shows that pre-takeoff turns are followed by a greater proportion of straight taxi manoeuvres compared with post-landing turns. Therefore, it can be suggested that manoeuvre sequencing after turns is sensitive to whether the turn is performed during the pre-takeoff or post-landing phase.
Figure 21 shows the manoeuvres following straight taxi and braking manoeuvres across both the pre-takeoff and post-landing phases. Figure 21(a) and (b) show the proportional share of manoeuvres following pre-takeoff and post-landing straight taxi manoeuvres, respectively. It should be observed from comparing Fig. 21(a) and (b) that the proportional share of manoeuvres are similar across the pre-takeoff and post-landing phases, and left and right turns are also approximately equal in proportion. This suggests that, for straight taxi manoeuvres, the sequencing of manoeuvres is insensitive to the taxi phase. On the other hand, Fig. 21(c) and (d) suggest for braking manoeuvres that the sequencing of manoeuvres is sensitive to taxi phase, as Fig. 21(d) shows that a greater proportion of braking manoeuvres are followed by turns, when comparing the post-landing phase with the pre-takeoff taxi phase.
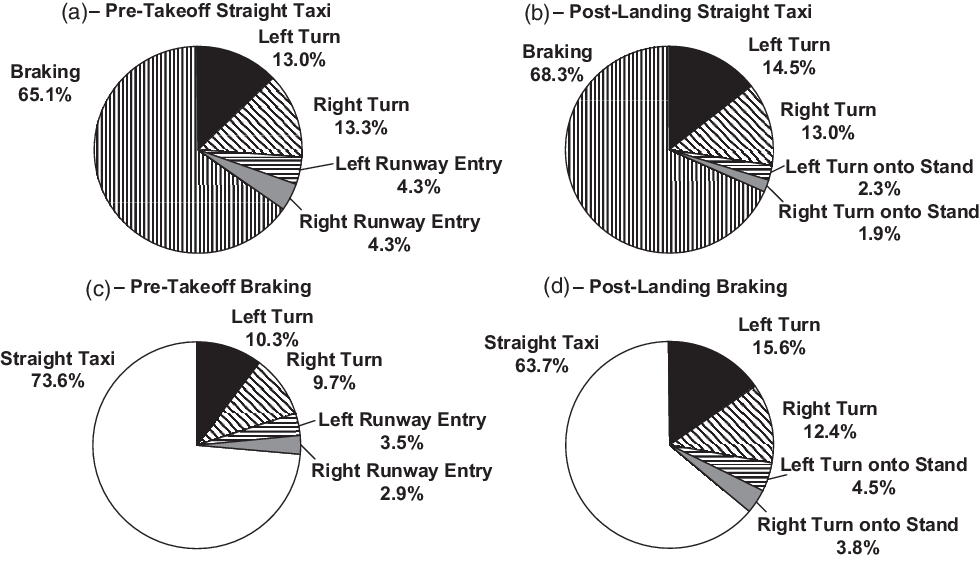
Figure 21. Proportional share of manoeuvres following straight taxi and braking manoeuvres for the wide-body civil aircraft: (a) manoeuvres following pre-takeoff straight taxi, (b) manoeuvres following post-landing straight taxi, (c) manoeuvres following pre-takeoff braking and (d) manoeuvres following post-landing braking.
From across Fig. 21, it can be seen that, regardless of taxi phase, the majority of manoeuvres following a straight taxi is a braking manoeuvre, and vice versa. This observation suggests that there are extended sequences of manoeuvres during which the aircraft continually changes from a straight taxi to a braking manoeuvre before accelerating back into a straight taxi manoeuvre. Flights demonstrating such a behaviour were identified, and through the use of the Flightradar24® user interface it was concluded that an aircraft alternating between straight taxi and braking was as a result of the aircraft ‘queuing’ behind other aircraft at key phases, such as prior to entering the runway. The occurrence of alternating straight taxi and braking sequences was found to be especially prevalent for flights departing and arriving at peak travel times.
6.0 VERIFICATION OF ALGORITHMS
To verify the algorithms described in Section 2, the flight strips generated using the algorithms could be validated by comparing the identified manoeuvres with the original ADS-B data files and Flightradar24® ground track for each flight. Thus, 10% of the dataset (130 flights) from the data collection study were randomly selected, and for each flight the following results were reviewed:
-
• Identification of the correct milestone manoeuvres, including turn directions
-
• Identification of the correct manoeuvre sequence, including both turns and braking for both pre-takeoff and post-landing taxi phases
Random sampling of the 130 verification flights was performed in a simple manner. Each ADS-B data file from the data collection study was assigned a unique numerical integer index from 1 to 1,265. A uniform integer random number generator was then used to randomly sample 130 integers without replacement. These 130 integers provided the ADS-B data file indices to select as the 130 verification flights. Validation of the milestone manoeuvres, turn direction and sequencing was performed using the Flightradar24® user interface(23), as shown in Fig. 22. The ability of Flightradar24® to map the data files directly onto satellite images of airports greatly aided this verification task(23). The correct turn and braking manoeuvre occurrence and sequencing could also be validated using a plot of heading/direction and speed changes of the ADS-B data file as highlighted in Fig. 22, by identifying direction and speed changes. The chronological order of the ADS-B data files provided the information required to validate the extracted manoeuvre sequences in the flight strip.
Table 1 presents the verification results, where ‘accuracy’ is defined as the generated flight strip agreeing with the Flightradar24® user interface and ADS-B data file plot. Table 1 shows that the algorithms were able to successfully identify the milestone manoeuvres for the majority of the verification data files. Reduced accuracy was observed for pushback and turn onto stand manoeuvres. The reduced accuracy for identifying pushback manoeuvres also resulted in lower accuracy for the sequencing of the pre-takeoff taxi sequence. The cause of this inaccuracy is discussed in Section 7.1. It should also be noted that the algorithms are currently only able to produce a completely correct flight strip in less than half of the verification flights. This inaccuracy suggests that, in their current form, the algorithms would be unsuitable for in-service monitoring of ground manoeuvres of a single aircraft. However, as the accuracy for identifying manoeuvre sequences and manoeuvre types across the fleet is significantly higher, ADS-B data files coupled with the algorithms presented in Section 2 are currently suitable for generating ground manoeuvre statistics for the wide-body civil aircraft fleet, as performed above in Section 3.
Table 1 Verification results for the algorithms
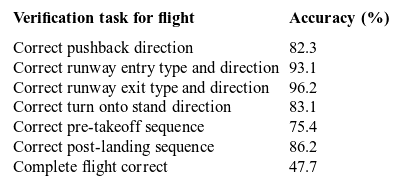
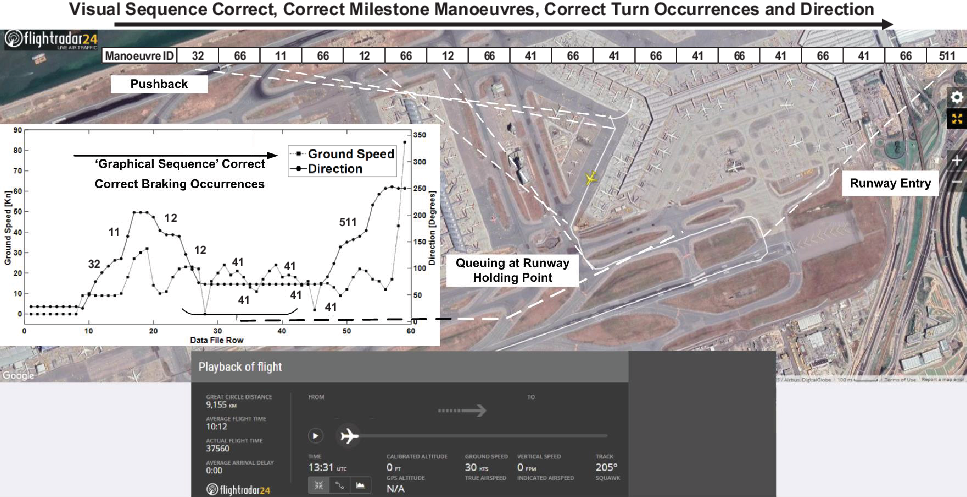
Figure 22. Visualisation of the algorithm verification process. Original ground track reproduced with kind permission from Flightradar24® (23).
Beyond the algorithm verification activities presented above, verification of the entire approach (i.e. the ADS-B data source and presented methodology) must be performed within future work. It is proposed that the existing approach for identifying manoeuvres from in-service load monitoring campaigns (as performed by the FAA statistical loads program(15)) could be employed to perform this verification. The corresponding ADS-B data files for each flight included in the loads monitoring campaign would be sourced and the ADS-B-derived manoeuvres could be validated using the manoeuvres identified from the loads monitoring data. Such a verification approach would permit the true accuracy of the ADS-B methodology to be assessed. Regarding the evolution of the methodology presented within this paper into a certification-level approach, an acceptable error within the ADS-B-derived manoeuvres should be defined through considering the accuracy requirements placed upon existing in-service load monitoring systems(15). It is important to highlight that the air traffic control sector is keenly pursuing satellite-based ADS-B approaches(Reference Garcia, Dolan and Hoag46), thus such work may provide a certification precedent for the adoption of ADS-B-derived data to support aerospace structural design qualification and in-service monitoring.
One of the most significant benefits of deriving manoeuvre statistics from ADS-B data sources is the ability to rapidly apply the methodology to new ADS-B datasets, compared with the historical approach of identifying manoeuvre occurrences from the in-service monitoring of a limited number of aircraft across a limited number of operators and routes(Reference Ladda and Struck2,Reference Buxbaum3,15) . Consequently, as part of further verification activities, it is recommended that a significantly larger ADS-B dataset of 10,000 flights (consistent with the FAA statistical loads program(15)) is sourced. The generation of a larger dataset will support the following future verification activities:
-
• A larger dataset will permit convergence studies to be performed, to identify the required ADS-B dataset size (i.e. number of flights) required to generate converged ground manoeuvre statistics.
-
• The flowchart shown in Fig. 1 implies that variability in loading magnitude, manoeuvre occurrence and manoeuvre sequencing are independent. However, a larger dataset coupled with the verification of the methodology using in-service loads monitoring will support an investigation into any correlations that may exist between the statistics for loading magnitude, manoeuvre occurrence and manoeuvre sequencing.
-
• A larger dataset will increase the likelihood of observing ‘abnormal’ operating conditions such as the RTO identified in Section 4.1. This in turn will permit the development of algorithms that automatically identify abnormal operating conditions, permitting statistics to be generated for such events, along with their inclusion into load spectra. The ability to apply the ADS-B methodology to flights with known abnormal events (e.g. a reported RTO) will greatly aid algorithm development.
-
• A larger ADS-B dataset will also support the identification of operational events which are not captured by ADS-B. For example, maintenance-related towing operations (e.g. towing to remote stands/hangars) can result in fatigue damage accumulation in landing gear(Reference Ladda and Struck2). Whilst towing operations were captured for a specific flight in Section 4.2, it is not currently clear whether towing operations are routinely captured by ADS-B data files.
In summary, once verified, the ADS-B methodology will be easily scaled up to accommodate datasets consisting of a greater number of flights across an entire manufactured aircraft fleet compared with historical studies which have been reliant on a limited number of aircraft. As a result, this paper represents the first step in exploiting ADS-B data sources for landing gear design, and this section has considered the future work required to implement the presented methodology as a practical design tool. The remainder of this paper will consider the extensibility of the methodology beyond the generation of ground manoeuvre statistics.
7.0 DISCUSSION
The implementation of the methodology in Section 3 has successfully demonstrated the utility of ADS-B data files for the generation of ground manoeuvre statistics for the fleet of a wide-body civil aircraft. The results extracted from the 1,265 ADS-B data files showed good agreement with regard to turning and braking manoeuvre occurrences when compared with previous studies for wide-body civil aircraft(Reference Ladda and Struck2). In addition, the statistics generated from the methodology have provided support for existing assumptions within the construction of landing gear load spectra, most notably that turn directions across all manoeuvre types are equally shared between left and right turns. The agreement between the results generated from the ADS-B data files and existing practice(Reference Ladda and Struck2,Reference Buxbaum3,4) further increases confidence in the methodology presented herein. It should be noted that this observation contradicts the specific findings from the FAA statistical loads program, which suggested that some aircraft types perform more turns in a given direction(4). However, the FAA statistical loads program generated data from aircraft operated by a single airline(4), and therefore, the turn direction results would be biased towards the specific routes and airports that the single operator uses. The disagreement between the results in this paper (for multiple operators) and the FAA program (for a single operator) highlights the importance in generating ground manoeuvre statistics for individual operators and comparing the statistics and results across different operators within future work. In addition, it is important to highlight that ADS-B-derived manoeuvre statistics can be continually updated to account for changing operational practices, whilst the current approach of in-service load monitoring of specific aircraft will only provide manoeuvre statistics that are representative of the monitored aircraft in a ‘snapshot’ of operational service.
The results generated by applying the data collection and processing methodology to ADS-B datasets also highlighted areas where existing assumptions made within the construction of landing gear load spectra need to be challenged. The use of ‘average’ manoeuvre occurrence values(Reference Ladda and Struck2) was shown to be unsuitable for the wide-body civil aircraft studied in this paper as a result of the positively skewed histograms for turning and braking occurrences generated from the ADS-B demonstration dataset. Likewise, the assumption of turn reversals (i.e. a left turn followed immediately by a right turn) currently made in landing gear load spectra(Reference Ladda and Struck2) should be challenged as the results from the ADS-B dataset suggest that turning manoeuvres are typically followed by a straight taxi manoeuvre. There is the potential for the current assumption of turn reversals to be conservative. This is due to the loads applied to the landing gear being fully reversed across the two turns, resulting in large stress amplitudes being calculated and increased fatigue damage accumulation compared with the case where the turning loads on the landing gear are removed as the aircraft continues to straight taxi.
The utilisation of ADS-B data to generate ground manoeuvre statistics for the fleet of a wide-body civil aircraft also permitted the generation of data which have not been available previously. For example, the results in Section V have demonstrated the importance of considering whether manoeuvres are occurring during the pre-takeoff or post-landing taxi phase as this was shown to have an impact on the sequencing of ground manoeuvres. Likewise, the observation of ‘queuing’ behaviour during which the ground manoeuvre sequence alternates between straight taxi and braking manoeuvres was demonstrated based on the sequencing results from the ADS-B data. Such observations are supported by other recent research work by Schultz et al., which also highlighted that operational impacts whilst aircraft are on the ground can be observed within ADS-B datasets(Reference Schultz, Olive, Rosenow, Fricke and Alam47). It is hoped that manoeuvre occurrence and sequencing statistics generated from ADS-B data files could be used to support future design programs along with providing guidance when determining the best practice for constructing landing gear load spectra for fatigue design and analysis(48).
With regard to the authors’ wider research work(Reference Hoole, Sartor, Booker, Cooper, Gogouvitis, Ghouali, Schmidt, Niepokolczycki and Komorowski18), the results from applying the data collection and processing methodology to the ADS-B data files have provided the required data and statistics to support a probabilistic approach to safe-life fatigue design. The results presented throughout Sections 4 and 5 provide the required characterisation of the variability in manoeuvre occurrence and sequencing such that it can be incorporated accurately into a probabilistic approach to the fatigue design of aircraft landing gear.
Therefore, the demonstration of the methodology in Section 3 has shown that ADS-B data have the ability to support current design efforts and practices through challenging the existing assumptions within the construction of landing gear load spectra, whilst also providing additional data to further guide existing methods and support the implementation of novel probabilistic fatigue design methods. It should also be noted that the methodology and algorithms presented within this paper are general in nature and could be applied to any aircraft fleet that produces ADS-B data files. It is proposed that future work should consider different aircraft types (e.g. short-haul narrow body, cargo, etc.) to identify whether there are significant differences in the ground manoeuvre statistics. In addition, a fleet could be divided into operator fleets (i.e. airlines) to provide a comparison of statistics across different operators of a single aircraft type, and this should be performed following the construction of the 10,000 flight ADS-B dataset described in Section 6. Further segregation of the ADS-B dataset could potentially be performed for various categories, including but not limited to different routes, airports, timeslots, seasonal and weather variations, and aircraft age. One of the significant challenges of exploiting a novel data source is defining the scope of the data collection, thus engagement with stakeholders (e.g. manufacturers, operators, regulatory bodies, etc.) should be performed to ensure that useful statistics and comparisons between different data categories are defined prior to data collection.
The ultimate extensibility of assessing ADS-B data with respect to ground manoeuvres is to support ‘real-time’ in-service tracking of individual aircraft to provide the manoeuvre data required to support health and usage monitoring of landing gear components(Reference Schmidt49). Future approaches could utilise ADS-B data to enable the exact ground manoeuvres performed by an aircraft to be used to estimate the fatigue damage accumulation within landing gear components(Reference Schmidt49). It is anticipated that, as the application of ‘Big-Data’ continues to grow within fatigue design and the wider aerospace sector(Reference Graham, Artim and Daverschot20), ADS-B data will provide a vital source of data to challenge previous design assumptions, support future design programs and implement in-service monitoring of landing gear components. Within the wider aerospace sector, it is pleasing to see that ADS-B datasets have already been exploited during the development of aircraft mission profiles to support the future design of commercial hybrid-electric aircraft by Jux et al.(Reference Jux, Foitzik and Doppelbauer50).
7.1 Current limitations of ADS-B data and methodology
On the basis of the verification results presented in Table 1, it is evident that there are potential sources of inaccuracy within the ground manoeuvre occurrence and sequencing statistics presented in Sections 4 and 5. A thorough investigation into both the characteristics of ADS-B data and the developed algorithms was performed to identify areas that could be improved in future work.
A number of limitations regarding ADS-B data will result in potential inaccuracy or ‘biasing’ of the statistics shown in Sections 4 and 5. Firstly, ADS-B coverage is not currently available at the time of writing for all routes and operators of the selected wide-body civil aircraft. The unavailable routes and operators will cause the results shown in Sections 4 and 5 to be biased towards the available routes, which could provide ground manoeuvre statistics that are not representative of the complete wide-body aircraft fleet. This is especially the case when major hubs of the aircraft operators currently do not have ADS-B receiver coverage. However, ADS-B receivers are being continually activated, thus it is expected that gaps in ADS-B coverage will reduce in the future.
As discussed in Section 2.3, data smoothing is required to remove ‘noise’ from the data files to prevent the false identification of manoeuvres from noise. From reviewing the verification data files, it was observed that 41.5% of the data files were noisy, which could have resulted in inaccurate sequence results. Noise in the datasets was typically observed at aircraft stand/gate locations or holding points for runways. Data files were also observed to occasionally contain ground tracks with ‘missing’ points where the aircraft rapidly transitions from one location to another. Concerning the verification data files, 45.4% of files were found to have missing points, potentially leading to incorrect identification of manoeuvres or sequencing. The presence of missing points from ADS-B transmissions required the manual selection of flights for the data collection study, potentially biasing the results shown in Sections 4 and 5 towards flights that had ground tracks with the highest quality reception. Note that a more thorough discussion on ADS-B data quality is presented by Verbraak et al. and Ali et al.(Reference Verbraak, Ellerbroek, Sun and Hoekstra51,Reference Ali, Schuster, Ochieng and Majundar52) .
One approach to overcome missing points within ADS-B datasets has been demonstrated by Brownlee et al.(Reference Brownlee, Weiszer, Chen, Ravizza, Woodward and Burke27). Within this work, airport geometries are represented as graphs consisting of nodes and edges(Reference Brownlee, Weiszer, Chen, Ravizza, Woodward and Burke27). If airport geometries could be represented within this manner for the complete route network, the missing points within the ADS-B dataset could be inferred by considering the possible aircraft taxi routes within the graph that represents the airport geometry. This would ultimately permit the vast majority of flights to be retained within the ADS-B dataset, permitting the quantification of the impact of neglecting ADS-B data files containing missing points on the ground manoeuvre statistics. An additional benefit of coupling ADS-B datasets with known airport geometries is the opportunity to ‘geo-tag’ aircraft using the ADS-B latitude and longitude data to generate statistics on the specific airports from which a given aircraft operates. A direct utility of geo-tagging aircraft regarding landing gear design relates to studies which have shown that the taxiway and runway surface quality can greatly affect the fatigue life of landing gear components(Reference Ladda and Struck2). Consequently, ADS-B position data coupled with an airport database consisting of known taxiway/runway surface qualities could be used to generate operational statistics regarding how often aircraft operate from airports with poor runway surfaces. Geo-tagging of aircraft would also facilitate an investigation into whether regional operational practices, which may vary across the globe, significantly impact aircraft and landing gear ground manoeuvres.
In extension to geo-tagging aircraft, it is proposed that ADS-B position data could also be coupled with real-time and historical meteorological data. Coupling these two data sources would permit the identified set of ground manoeuvres to be correlated with specific weather conditions (e.g. dry, rain, snow, wind direction and speed, etc.) to identify if environmental conditions and weather impact aircraft ground manoeuvres. Such information could therefore be used to better inform fatigue load spectra for aircraft that predominately operate in, for example, cold climates, where pre-flight de-icing may result in a larger number of ground manoeuvres being performed by aircraft during the winter season.
The algorithms described in Section 2 also contain limitations that may have introduced inaccuracy into the results shown in Sections 4 and 5 and provide an explanation for the accuracy results shown in Table 1. It was observed that the pushback algorithm was susceptible to either identifying the incorrect pushback direction or combining the pushback turns with turning manoeuvres that were performed immediately after pushback. As the pushback manoeuvre is the first manoeuvre to be identified and extracted for the pre-takeoff phase, the pushback characterisation error can be propagated throughout the pre-takeoff taxi phase, resulting in the reduced accuracy of 75.4% for correctly identifying the pre-takeoff manoeuvre sequence (Table 1). Future work being conducted by the authors aims to use further information from the latitude and longitude to identify whether the aircraft is pushing back or taxiing forwards for the complete pre-takeoff taxi phase. As discussed in Section 6, comparison of the ADS-B derived manoeuvres with those extracted from in-service loads monitoring campaigns could be used to quantify the increase in accuracy achieved through algorithm improvements.
The turn identification algorithm described in Section 2.2 was also found to provide inaccurate manoeuvre identification for turns of exactly 180° as the ‘compass’ approach does not provide the information required to identify the turn direction. The authors are also conducting future work based upon the ADS-B latitude and longitude information to better identify the turn direction in such instances. Regarding the further characterisation of turning manoeuvres, it is suggested that the rate at which the aircraft direction changes during a turning manoeuvre could be used to infer whether ‘tight’ or ‘pivoting’ turns are being performed, as these are typically performed at a slower rate of turn. Identification of small turn radii could also be used to further characterise pivot turning manoeuvres. The extension of the presented algorithms to account for the rate of heading or speed changes also provides a route to generating initial estimates of aircraft loads using ADS-B data.
7.2 Outlook for methodology ADS-B data-driven design
This paper has presented a methodology for generating aircraft ground manoeuvre statistics to support landing gear design, which is novel and innovative from a number of standpoints:
-
• The exploitation of ADS-B data to generate landing gear ground manoeuvre statistics
-
• The development of robust algorithms to identify and characterise aircraft ground manoeuvres
-
• The generation of aircraft ground manoeuvre statistics that have not been available from previous studies (e.g. ground manoeuvre sequencing)
-
• The definition of a ‘remote’ methodology that can identify and characterise aircraft ground manoeuvres that is not reliant on dedicated instrumented landing gear assemblies or the downloading and processing of flight recorder data, which represent the current state-of-the-art approaches
-
• The definition of a methodology that is insensitive to aircraft type and could be readily and rapidly applied to a larger aircraft fleet or different types of aircraft (e.g. short haul/narrow body)
Whilst the current paper has focused on the ADS-B data processing methodology and represents a first step in exploiting ADS-B data for landing gear design, it is important to note that it is the application of the methodology to generate ground manoeuvre statistics that will result in the greatest impact within landing gear design, due to the construction of more accurate fatigue load spectra. The development of more accurate fatigue load spectra could result in lower component weights, or components with longer in-service design lives, enhancing the efficiency of the landing gear assembly. As discussed extensively in Section 7, it is the intention that wider application of this methodology will inform the construction of landing gear fatigue load spectra, providing that all the limitations discussed in the previous section are addressed. The possibility of coupling ADS-B data to airport runway databases and meteorological conditions, along with segmenting ADS-B data across different aircraft types and operators, could open up new concepts and approaches in structural health monitoring. The ‘remote’ nature of ADS-B-based approaches means that aircraft operations do not need to be interrupted to instrument aircraft or download flight recorder data, potentially reducing the cost and complexity of implementing aircraft structural and system health monitoring in the future.
It is expected that these future developments will not be limited to aircraft landing gear and that ADS-B-derived data will be used to support many aspects of aircraft structural and system design, along with enhancing aircraft operations. The wide range of previous applications of ADS-B data were discussed previously in Section 1.2, and the most recent applications of ADS-B data have considered the estimation of aircraft emissions from ADS-B data sources(Reference Behere, Bhanpato, Puranik, Kirby and Mavris53,Reference Filippone, Parkes, Bojdo and Kelly54) . It is hoped that this paper has highlighted how ADS-B data can be used to support not just aircraft operations via structural health monitoring but also the design of future aircraft through better informed fatigue spectra and operational usage data.
8.0 CONCLUSIONS
This paper has presented the utilisation of ADS-B transponder data to generate data and statistics that characterise the variability in the occurrence and sequencing of ground manoeuvres for a wide-body civil aircraft. The justification for characterising the variability in ground manoeuvre occurrence and sequencing is to challenge the existing assumptions required in the construction of landing gear load spectra for fatigue design, along with providing the data required to support a probabilistic approach to the fatigue design of landing gear components.
A series of algorithms were constructed to process ADS-B data files and demonstrated on a series of data files sourced from FlightRadar24® (23). The collection of ADS-B data files was representative of 1,265 flights from a fleet of a wide-body civil aircraft. Based on the results of applying the algorithms to the ADS-B data files, the following conclusions were made:
-
• ADS-B data can be used to generate statistics regarding the manoeuvre occurrence and sequencing for a fleet of aircraft. This data can be utilised to evaluate existing design assumptions, to provide the data required for a probabilistic design approach and to support in-service monitoring of aircraft.
-
• For a wide-body aircraft, the mode number of pre-takeoff turns was found to be three per flight and the mode number of post-landing turns was found to be two per flight, in good agreement with previous studies based upon in-service loads monitoring of wide-body aircraft.
-
• Moderate correlation exists between the number of left turns and number of right turns for a wide-body aircraft during both the pre-takeoff and post-landing taxi phases.
-
• The proportional share of left and right turn directions across all turning manoeuvre types was found to be equal for a wide-body aircraft, which supports existing design assumptions made during the construction of landing gear load spectra.
-
• For a wide-body aircraft the distributions of turning and braking occurrences are positively skewed, suggesting that it is not appropriate to assume average number of manoeuvres per flight when constructing landing gear load spectra for fatigue design.
-
• It is important to distinguish between the pre-takeoff and post-landing taxi phases in the construction of landing gear load spectra in fatigue design due to the sensitivity of manoeuvre occurrence and sequencing statistics to the taxi phase.
-
• For a wide-body aircraft, braking manoeuvres are commonly followed by a straight taxi manoeuvre and vice versa, as a result of aircraft queueing at different taxi phases (e.g. at runway hold-short locations).
Regarding future work, a series of improvements that can be applied to the algorithms presented within this paper have been identified and should be implemented as a priority. In addition, ground manoeuvre occurrence and sequencing statistics should be identified for other aircraft types, such as short-haul narrow-body aircraft. Finally, the extensibility of the application of ADS-B to single-aircraft tracking and assessment, with a view to supporting ‘real-time’ health and usage monitoring, should be investigated. It is hoped that this paper has demonstrated the significant potential of using ADS-B data within aircraft structural design.
ACKNOWLEDGEMENTS
This paper presents work performed as part of the Aerospace Technology Institute (ATI) funded “Large Landing Gear of the Future” Project (grant no. 113077) in collaboration with Safran Landing Systems. The authors extend their personal thanks to Flightradar24® for providing permission to reproduce ADS-B data and screenshots within this paper.