NOMENCLATURE
- a
amplitude of piston (mm)
- b
half jet width evolution (mm)
- Cp, Cv
specific heat capacity at constant pressure, volume J/Kg.K
- d
orifice diameter (mm)
- D
cavity diameter (mm)
- Et
specific total energy (J/kg)
- f
frequency of piston (Hz)
- h
orifice height (mm)
- hs
specific static enthalpy (J/kg)
- H
cavity height (mm)
- Ht
specific total enthalpy (J/kg)
- k
turbulence kinetic energy (m2/s2)
- L0
stroke length of synthetic jet (mm)
 $\dot m(t)$
mass flux (kg/m × s2)
- Ma
Mach number (
 $ = {{{U_{{\rm{max}}}}} / {{U_{{\rm{Sound}}}}}}$)
- P
Reynolds averaged pressure (kg/m × s2)
- P
instantaneous pressure (kg/m × s2)
- R
specific gas constant (J/kg × K)
- Re
Reynolds number (
 $ = {U_0}d/\upsilon $)
- Sr
Strouhal number (=fd/U 0)
- St
Stokes number (
 $ = \sqrt {{{f{d^2}} / \upsilon }} $)
- t
time (s)
- T
time period of cycle (s)
- U(t)
instantaneous velocity at the piston inlet boundary m/s
- U max
maximum velocity (m/s)
- U0
average of instantaneous velocity m/s
- U Sound
speed of sound m/s
- X, Y,Z
direction of co-ordinate axes
- φ
phase angle of oscillation (°)
- μ
dynamic viscosity (kg/m × s)
- μt
turbulent eddy viscosity (kg/m × s)
- ν
kinematic viscosity (m2/s)
- λ
coefficient of second viscosity (=–2/3μ)
- ρ
density (kg/m3)
- ρu'iu'j
Reynolds stress (kg/m × s2)
- θ
temperature (K)
- ω
specific dissipation rate (1/s)
- over-bar
Reynolds averaged
- over-tilde
Favre averaged
- ′
fluctuations with respect to a Reynolds averaged
- ″
fluctuations with respect to a Favre averaged
- i, j, k
tensorial indices (unless otherwise stated)
Superscripts
Subscripts
1.0 INTRODUCTION
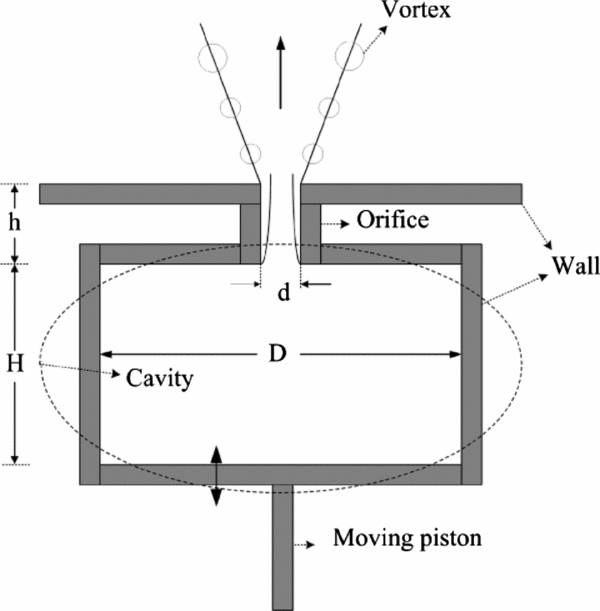
Synthetic jets are relatively new tools that have been considered by researchers in the recent two decades. The main objective of the synthetic jets is to generate a non-zero momentum flux with a zero net mass flux. They make use of the ambient fluid as the working fluid and they do not need a complex piping system(Reference Bazdidi-Tehrani, Jahromi, Karami and Javadi1). Therefore, synthetic jets are a good choice for the applications that have a limitation of space. This characteristic has resulted in versatile applications of synthetic jets comprising active flow control(Reference Wang, Ba and Feng2), vectoring(Reference Xia and Luo3), improvement of heat(Reference Vukasinovic and Glezer4) and mass transfer(Reference Tesa5), mixing enhancement(Reference Liu, Wang and Liu6) and increase of propulsion(Reference Polsenberg, Milano, Grazier, Fischer and Burdick7). A typical synthetic jet, as depicted in Fig. 1, consists of an oscillating actuator attached to a semi-closed cavity that has an orifice or slot. The actuator of a synthetic jet may be a mechanical piston(Reference Iuso, Di Cicca and Donelli8), a speaker(Reference Jin, Wang and Yang9), or a diaphragm(Reference Vukasinovic and Glezer4). The actuator provides an oscillatory flow by changing the volume of the cavity at a certain frequency. A working cycle of a typical synthetic jet is composed of two strokes: suction and blowing. During the blowing stroke, the volume of the cavity is decreased; fluid is compressed and pushed through the orifice toward an external domain, which generates a vortex dipole. The vortex dipole moves upwards by its self-inducing velocity, which is a characteristic of synthetic jets. In the suction stroke, the volume of the cavity is increased and the air flows through the orifice inside the cavity. The main condition for the formation of a synthetic jet flow is that a vortex dipole generated during the blowing stroke has a sufficient distance from the orifice so that it is not dragged into the cavity during the suction stroke. Vortex dipoles are generated in each cycle, and by repeating cycles, a sequence of vortices is produced that propagate away from the orifice.

Figure 1. A schematic of components for the generation of a synthetic jet.
Figure 2 shows the four steps of generation of a vortex dipole by a synthetic jet. Part (a) represents the suction stroke where the fluid is sucked into the cavity, thereby increasing the cavity volume. Part (b) is the start of the blowing stroke where a vortex dipole is generated. The end of blowing stroke is shown in part (c), where the vortex dipole is separated from the orifice. In part (d), the suction stroke is started again. The vortex dipole moves upward by a self-induced velocity and the fluid is sucked into the cavity from the medium. The vortex dipole can escape from the suction in the cavity so that the synthetic jet is formed up. Periodic vibration of the actuator results in a sequence of vortex rings.

Figure 2. The four steps of generation of a vortex dipole(Reference Polsenberg, Milano, Grazier, Fischer and Burdick7).
2.0 LITERATURE REVIEW
Since the appearance of synthetic jets, researchers have focused on its elementary concepts in experimental or numerical studies. In one of the first experimental investigations, the formation and evolution of the synthetic jet has been studied by Smith and Glezer(Reference Smith and Glezer10). They viewed the synthetic jet by using the Schlieren images via the use of a small tracer gas, and velocity fields have been acquired by the hot wire anemometry at different locations in space for phase-locked and long-time averaged signals. The criterion for formation of synthetic jets has been addressed by Holman et al(Reference Holman, Uttarkar, Mittal, Smith and Cattafesta11). They have calculated the criterion of formation of two-dimensional and axisymmetric synthetic jets based on the Strouhal number (or Reynolds and Stokes numbers), both numerically and experimentally. Smith and Swift(Reference Smith and Swift12) compared the flow field of continuous jets with synthetic jets in the uniform Reynolds number and large range of the dimensionless stroke length (![]() ${{{L_0}} / d}$). They concluded that the flow field of synthetic jets is similar to that for continuous jets in the far region with respect to the orifice. However, in the near field region, synthetic jets entrain more fluid than continuous jets because of the presence of a vortex. Therefore, synthetic jets are wider and have more volume flux. Yao et al(Reference Yao, Chen, Neuhart and Harris13) have presented a relatively comprehensive database for the CFD validation of synthetic jets.
${{{L_0}} / d}$). They concluded that the flow field of synthetic jets is similar to that for continuous jets in the far region with respect to the orifice. However, in the near field region, synthetic jets entrain more fluid than continuous jets because of the presence of a vortex. Therefore, synthetic jets are wider and have more volume flux. Yao et al(Reference Yao, Chen, Neuhart and Harris13) have presented a relatively comprehensive database for the CFD validation of synthetic jets.
In recent years, further experimental and numerical studies have been performed to better understand the behaviour and characteristics of a synthetic jet. Greco et al(Reference Greco, Ianiro, Tasarita and Cardone14) have experimentally investigated flow features in the near field of single and twin synthetic jets. The effect of jets interaction has been evaluated by changing the jet axis distances (1.1-, 3- and 5-nozzle diameters). They have concluded that twin circular synthetic jets at jet axis distances equal to 3 and 5 diameters show the same behaviour with respect to the single circular synthetic jets. But at jet axis distances equal to 1.1 diameters, a double vortex ring structure is visualised. This causes a different velocity distribution in the jet core, higher axial velocities and a lower jet width. Kordík et al(Reference Kordák, Broukov, Vít, Pavelka and Trávníek15) have proposed four different methods of calculating Reynolds number in synthetic jets. All four methods are based on simple measurement of the actuator electrical input and are applicable for loudspeaker-based actuators with air as the working fluid. The effect of synthetic jets on the icing process of a water droplet on a cold surface has been studied by Jin et al(Reference Jin, Wang and Yang9) experimentally. The results have shown that the synthetic jet has increased the temperature of the surface on the icing process period and prolonged the freezing time of the water droplet. Chila and Kaminski(Reference Chila and Kaminski16) have applied an automated adaptive remeshing methodology to a synthetic jet. They have done a series of two-dimensional, axisymmetric, time-dependent numerical analyses to conclude the boundary condition and turbulence model sensitivities as well as time and phase accuracy. Bazdidi-Tehrani and Jahromi(Reference Bazdidi-Tehrani and Jahromi17) have addressed the capabilities of the URANS approach, based on the first- and second-moment-closure turbulence models to simulate the flow field of a synthetic jet. They have reported that although the modified versions of the standard k − ε model show a better prediction accuracy, the second-moment-closure model with a quadratic nonlinear pressure strain approximation (SSG) displays more reasonable predictions. Ma et al(Reference Ma, Guo, Fan and Zhang18) have compared two different ways for the numerical simulation of the actuator of synthetic jets, namely, the velocity inlet boundary condition and the dynamic mesh method. They have concluded that despite the higher computational time for the dynamic mesh method, it can simulate the synthetic jet behaviour more accurately.
Since the advent of the synthetic jet, the effects of changes in the geometric and flow parameters on the behaviour of the synthetic jets, whether numerically or experimentally, have been considered by many workers. Shan and Wang(Reference Shan and Wang19) have considered experimentally the effect of two dimensionless parameters, the Reynolds number and dimensionless stroke length, on an axisymmetric synthetic jet flow field. They have investigated three different actuator frequencies of 0.5, 1 and 2Hz at corresponding Reynolds numbers of 315.5, 631 and 1262, respectively. They have declared that in the same stroke length and with increasing Reynolds numbers, the vortex dipole goes through the laminar-turbulent transition and tends to lose stability and gradually break down. They also have observed that the dimensionless stroke length strongly influences the formation of a synthetic jet. Xiong et al(Reference Xiong, Zhixun, Zhenbing and Lin20) have examined a novel approach to the optimal design of the synthetic jet geometry. The approach has optimised the combination of geometric parameters by selecting the strength of vortex pair as the evaluation indicator, coupled with orthogonal experiments and analysis of variance (AOV). In a fixed cavity diameter, the results indicated that the slot width is a more noticeable factor than the cavity height and the slot depth. Jain et al(Reference Jain, Puranik and Agrawal21) have numerically considered the effect of various parameters of cavity and orifice on the ensuing synthetic jet flow. The results have been confirmed by time, grid and domain independency studies and then validated against available experimental and numerical results. Their results showed that synthetic jets are more affected by changes in the geometric parameters of the orifice than those of the cavity. The most significant parameters are determined to be the orifice and cavity diameters and the orifice length. Also, they reported that the change in the cavity and orifice shapes can increase the value of maximum velocity, but this does not necessarily mean an increase in Reynolds number or mass flow rate. Nani and Smith(Reference Nani and Smith22) have experimentally investigated the efficiency of an axisymmetric synthetic jet actuator as a function of the radius of curvature of the inner edge of the orifice in a quiescent medium. They have concluded that momentum flux downstream of the jet exit is largely independent of the orifice inner lip radius and considerable power can be saved by rounding the inner lip. Bazdidi-Tehrani et al(Reference Bazdidi-Tehrani, Hatami and Abouata23) have considered the flow fields ensuing from confined and unconfined synthetic jets. In order to understand the effects of the simulation of the actuator on the results, they have simulated it via the dynamic mesh method in two ways, namely, moving-piston and moving-diaphragm boundaries. It has been observed that those two moving boundaries have no significant difference. Also, they concluded that confined and unconfined synthetic jets have a dissimilar form of vortex ring. Utturkar et al(Reference Utturkar, Mittal, Rampunggoon and Cattafesta24) have numerically studied the sensitivity of synthetic jets to the design of the cavity. They have concluded that wide-ranging changes in the design of cavity have a relatively limited effect on the jet exit flow.
In the majority of papers available in the literature, it has been assumed that the flow is incompressible. In those few that have not applied this assumption, attention to the effects of compressibility is often neglected. For instance, Batikh et al(Reference Batikh, Caen, Colin, Baldas, Kourta and Boisson25), due to the significance of density fluctuations, have considered a compressibility assumption (ideal gas) for a flow with a Mach number of less than 0.15 to examine the turbulence of flow. Cain et al(Reference Cain, Karl, Donovan and Smith26) have used an ideal gas assumption for the simulation of a near-sonic synthetic jet. In an analytical investigation, Tang and Zhong(Reference Tang and Zhong27) have examined two mathematical models: the static compressible model (SC model) and the dynamic incompressible model (DI model). The magnitude of peak jet velocity at the circular orifice exit has been computed for those models at different conditions and then compared with the numerical simulation. Also, Moran et al(Reference Moran, Peter, Muller, Bernal, Parviz and Najafi28) have simulated a 10:1 scale acoustic resonator that is basically an irregularly shaped synthetic jet employing CFD. They have studied both incompressible and compressible models and have declared that the simulation can predict the resonant frequency. Rana et al(Reference Rana, Thornber and Drikakis29) have studied the injection of circular jet of hydrogen inside a scramjet engine using compressible Implicit LES and ideal gas assumptions. The purpose of their study is to understand the flow physics, hydrogen jet penetration and air and fuel mixing inside a combustor, which is vital at the design stage. They have investigated various flow features such as Mach number, velocity, pressure distribution, temperature, turbulence kinetic energy, Reynolds stresses and the effect of counter-rotating vortices on mixing. A compressible gas assumption has been applied to the simulation of a 3D synthetic jet by Ding et al(Reference Ding, Liu and Su30). They have studied the relationships between output peak velocity and geometry parameters based on the Helmholtz frequency and have given the optimum values of the orifice height and diameter. Although in many simulations the Mach number is lower than the value beyond which the compressibility effects become significant, a stroke to the fluid due to the vibration of a diaphragm or motion of a piston may cause the compressible behaviour to appear in the cavity. Also, the large pressure variation inside the cavity and near the orifice makes the compressibility effects of great importance. As all those effects are related to the actuator and occur in the cavity domain, proper simulation of these components is necessary.
Despite the fact that the compressible synthetic jets have been addressed much less than the incompressible ones, a detailed comparison between these two cases has rarely been performed and there is not enough work reported on the compressibility effects regarding the synthetic jets. The present paper first investigates the differences between the simulations of compressible and incompressible synthetic jets based on both time mean and instantaneous data. Second, due to the importance of an accurate simulation of the actuator of synthetic jets, especially in the compressible case, two prevalent ways of simulating the actuator, (namely, the mass flow inlet boundary condition [velocity inlet in the incompressible case] and the dynamic mesh method) are implemented and then compared for both compressible and incompressible cases. Third, some key flow and geometric parameters encompassing Reynolds numbers and cavity height that influence the compressible synthetic jet flow field are investigated.
3.0 COMPUTATIONAL DETAILS
3.1 Governing equations
In the solution of turbulent flow fields, the variables are usually divided into a mean part and a fluctuating part. The mean can be defined in two ways: (1) Reynolds averaged, or (2) Favre averaged. In the solution of the compressible flows, the use of Reynolds averaging requires correlations involving density fluctuations, which makes the modelling of these correlations quite difficult. In order to overcome this, a combination of Reynolds and mass-weighted Favre averaging is used. The advantage of this is that the governing equations bear a closer resemblance to their incompressible counterparts(Reference Shyy and Krishnamurty31).
The equations representing conservation of mass, momentum and energy in their averaged form are given below, where density and pressure are Reynolds averaged, while Favre averaging is employed to define the mean of velocity components and temperature.
 $$\begin{equation}
\begin{array}{*{20}{c}}
{\rho = \bar \rho + \rho '}\\
{{u_i} = {{\tilde U}_i} + {{u''_i}}}\\
{\theta = \tilde \theta + \theta ''}\\
{p = P + p'},
\end{array}
\end{equation}$$
$$\begin{equation}
\begin{array}{*{20}{c}}
{\rho = \bar \rho + \rho '}\\
{{u_i} = {{\tilde U}_i} + {{u''_i}}}\\
{\theta = \tilde \theta + \theta ''}\\
{p = P + p'},
\end{array}
\end{equation}$$where ρ, ui, θ and p are the instantaneous density, velocity, temperature and pressure, respectively. P is the Reynolds averaged pressure.
The exact forms of the governing equations for an unsteady, compressible and turbulent synthetic jet are expressed as follows:
 $$\begin{equation}
\frac{{\partial (\bar \rho {{\tilde U}_j})}}{{\partial t}} + \frac{\partial }{{\partial {x_j}}}(\bar \rho {\tilde U_i}{\tilde U_j}) = - \frac{{\partial P}}{{\partial {x_i}}} + \frac{\partial }{{\partial {x_j}}}\left[ {{\Sigma _{ij}} + {{\bar \sigma ''_{ij}}} - \overline {\rho {{u''_i}}{{u''_j}}} } \right]
\end{equation}$$
 $$\begin{equation}
\frac{{\partial \left( {\bar \rho {{\tilde E}_t}} \right)}}{{\partial t}} + \frac{\partial }{{\partial {x_j}}}(\bar \rho {\tilde U_j}{\tilde H_t}) = \frac{\partial }{{\partial {x_j}}}\left[ \begin{array}{l} {{\tilde U}_j}({\Sigma _{ij}} + {{\bar \sigma ''_{ij}}} - \overline {\rho {{u''_i}}{{u''_j}}} ) + {{\bar u''_i}}{\Sigma _{ij}} + \overline {{{u''_i}}{{\sigma ''_{ij}}}} - {{\tilde q}_j}\\ \quad \quad \quad \quad \quad - {{\bar q''_j}} - \overline {\rho {{u''_j}}{{h''_s}}} - \overline {\rho {{u''_j}}(\frac{1}{2}{{u''_i}}{{u''_i}}} ) \end{array} \right],
\end{equation}$$
$$\begin{equation}
\frac{{\partial \left( {\bar \rho {{\tilde E}_t}} \right)}}{{\partial t}} + \frac{\partial }{{\partial {x_j}}}(\bar \rho {\tilde U_j}{\tilde H_t}) = \frac{\partial }{{\partial {x_j}}}\left[ \begin{array}{l} {{\tilde U}_j}({\Sigma _{ij}} + {{\bar \sigma ''_{ij}}} - \overline {\rho {{u''_i}}{{u''_j}}} ) + {{\bar u''_i}}{\Sigma _{ij}} + \overline {{{u''_i}}{{\sigma ''_{ij}}}} - {{\tilde q}_j}\\ \quad \quad \quad \quad \quad - {{\bar q''_j}} - \overline {\rho {{u''_j}}{{h''_s}}} - \overline {\rho {{u''_j}}(\frac{1}{2}{{u''_i}}{{u''_i}}} ) \end{array} \right],
\end{equation}$$where,
For more details concerning the above governing equations, refer to Ref Reference Shyy and Krishnamurty31.
3.2 Turbulence modelling
In the present study, the SST/k − ω model, a modified version of the k − ω turbulence model developed by Menter(Reference Menter32) is employed to simulate the flow turbulence. This model includes a cross-diffusion term in the ω equation. The net effect of this term causes ω to diffuse from the turbulent region to a non-turbulent region, which does not happen with the k − ω model. Thus, the free stream value of ω has no influence on the solution. The SST/k − ω model also has a blending function that makes the cross-diffusion term equal to zero close to solid boundaries. The blending function causes all of the model's closure coefficients to assume the values in k − ω model near solid boundaries, and to asymptotically approach values similar to those used with the k − ε model for free shear flows. As a result, the SST/k − ω model behaves very much like the k − ω turbulence model for the wall-bounded flow and is nearly identical to the k − ε turbulence model for free shear flows. The turbulence kinetic energy, k, and the specific dissipation rate, ω, are represented by Equations (7) and (8), respectively.
 $$\begin{equation}
\frac{\partial }{{\partial t}}(\bar \rho k) + \frac{\partial }{{\partial {x_j}}}(\bar \rho {\tilde U_j}k) = \frac{\partial }{{\partial {x_i}}}\left[ {(\mu + {\sigma _k}{\mu _T})\frac{{\partial k}}{{\partial {x_j}}}} \right] + {P_k} - \rho {C_\mu }\omega k - {\bar u''_i}\frac{{\partial P}}{{\partial {x_i}}} + \overline {p'\frac{{\partial {{u''_i}}}}{{\partial {x_i}}}}
\end{equation}$$
$$\begin{equation}
\frac{\partial }{{\partial t}}(\bar \rho k) + \frac{\partial }{{\partial {x_j}}}(\bar \rho {\tilde U_j}k) = \frac{\partial }{{\partial {x_i}}}\left[ {(\mu + {\sigma _k}{\mu _T})\frac{{\partial k}}{{\partial {x_j}}}} \right] + {P_k} - \rho {C_\mu }\omega k - {\bar u''_i}\frac{{\partial P}}{{\partial {x_i}}} + \overline {p'\frac{{\partial {{u''_i}}}}{{\partial {x_i}}}}
\end{equation}$$The SST/k − ω turbulence model is further discussed in Refs Reference Shyy and Krishnamurty31 and Reference Menter32.
3.3 Non-dimensional parameters
The stroke length is the distance that a fluid particle travels during the blowing stroke and it is expressed as:
 $$\begin{equation}
{L_0} = \int\limits_0^{{T / 2}} {U(t){\rm d}t} ,
\end{equation}$$
$$\begin{equation}
{L_0} = \int\limits_0^{{T / 2}} {U(t){\rm d}t} ,
\end{equation}$$where T and U(t) are the period of cycle and instantaneous velocity, successively. The instantaneous velocity as a sinusoidal function is defined as:
Hence, L 0 is calculated as:
 $$\begin{equation}
{L_0} = \int\limits_0^{{T / 2}} {U(t)dt} = \int\limits_0^{{T / 2}} {{U_{{\rm{max}}}}{\rm{sin}}\left( {\frac{{2\pi }}{T}t} \right)dt = } \frac{{ - T}}{{2\pi }}{U_{{\rm{max}}}}({\rm{cos}}\pi - {\rm{cos}}0) = \frac{{T{U_{{\rm{max}}}}}}{\pi }
\end{equation}$$
$$\begin{equation}
{L_0} = \int\limits_0^{{T / 2}} {U(t)dt} = \int\limits_0^{{T / 2}} {{U_{{\rm{max}}}}{\rm{sin}}\left( {\frac{{2\pi }}{T}t} \right)dt = } \frac{{ - T}}{{2\pi }}{U_{{\rm{max}}}}({\rm{cos}}\pi - {\rm{cos}}0) = \frac{{T{U_{{\rm{max}}}}}}{\pi }
\end{equation}$$The stroke length is usually made dimensionless by using orifice diameter and it is one of the most important flow parameters in the analysis of a synthetic jet.
The Reynolds number is the most important non-dimensional flow parameter regarding synthetic jets, which is defined as:
where d is the orifice diameter and ![]() $\upsilon $ is the kinematic viscosity of fluid. U 0 is the average of instantaneous velocity of orifice during the blowing stroke and it is defined on the basis of the stroke length by Equation (13):
$\upsilon $ is the kinematic viscosity of fluid. U 0 is the average of instantaneous velocity of orifice during the blowing stroke and it is defined on the basis of the stroke length by Equation (13):
Therefore, the relationship between U 0 and U max is:
Another significant parameter in the analysis of a synthetic jet is the Strouhal number representing the unsteady behaviour of the synthetic jet flow.
Besides, the Stokes number is a multiplication of the Reynolds number and Strouhal number, which is defined as:
For high-Reynolds-number synthetic jets, the Mach number is also introduced to represent the ratio of maximum velocity of working fluid to local velocity of sound.
3.4 Compressibility and properties
The working fluid is considered to be air, and to investigate the compressibility effect, an ideal gas assumption is made so that the pressure, density and temperature are related as:
where P, ρ, R and θ are pressure, density, specific gas constant and temperature, respectively. The ideal gas assumption is employed for the prediction of the density fluctuations in the compressible case. On the contrary, in the incompressible case, the density of the working fluid is considered to be constant. It is equal to the density of air at standard atmospheric conditions (i.e. θ = 298 (K) and P = Patm). In addition, it is assumed that the fluid is calorically perfect so that the specific heat coefficients are constant, and thus:
where Cv and Cp represent specific heat coefficients for constant volume and constant pressure, successively.
3.5 Geometry and boundary conditions
The synthetic jet actuator employed in the present study was selected according to the experimental setup of Iuso et al(Reference Iuso, Di Cicca and Donelli8). The actuator consists of the engine of an aircraft model driven by a stepper electrical motor. Their test case consisted of a cylindrical cavity made of Plexiglas and a cap with an orifice. At the bottom of the cavity, there was a reciprocating piston with a 30.3Hz frequency that provided an unsteady motion. The amplitude of oscillation was fixed and equal to 16.5mm. The diameter of the circular orifice was 2mm, the cavity's inner diameter was 19.7mm, and its height was 50mm.
The measurements were carried out using a single-sensor hot wire probe, the position of which was changed by means of a mechanical carriage moved remotely by two stepper motors allowing streamwise and transversal positioning in the flow field of the synthetic jet(Reference Iuso, Di Cicca and Donelli8). They also declared that the investigation in the very near field was not very reliable for various reasons. The length of the sensor was not the most suitable for a good spatial resolution of the flow field. Moreover, the presence of the probe in a small flow field size introduced the effects of interference that consistently modified the velocity field. Furthermore, very near the orifice, a reverse flow took place during the suction phase and the hot wire sensor was not able to measure the reverse flow. The negative velocity values in the positive range were rectified by the sensor.
Figure 3 illustrates the computational geometry and boundary conditions specified in the present work. The actuator of synthetic jet (piston) is simulated in two ways: (1) as a mass flow inlet (velocity inlet in the incompressible case) boundary condition and (2) using a moving boundary (dynamic mesh method) to simulate the motion of the piston more accurately.

Figure 3. Geometry and boundary conditions of synthetic jet.
A reciprocating piston moves with respect to time as:
where a and fare amplitude and frequency of motion of piston, successively. By deriving this equation with respect to time, the velocity of the piston can be calculated.
It can be seen that the velocity is only dependent on time and not location. It means that all the points in the inlet boundary have the same velocity.
For simulation of the piston, the reciprocating piston is omitted and the sinusoidal function is used as an inlet boundary condition instead of the piston. For incompressible cases, a velocity inlet boundary condition is considered as in Equation (22). In the compressible case, a mass flow inlet boundary condition is considered as:
where ρ is the density of fluid. Secondly, the reciprocating piston is simulated by utilising the dynamic mesh method. In this case, the inlet boundary is considered as a moving wall which oscillates with respect to time as in Equation (22).
Although both of the mass flow (or velocity) inlet boundary condition and dynamic mesh method can simulate the actuator of a synthetic jet in the numerical simulations, they perform differently. The velocity inlet boundary condition is a simple way to simulate the actuator of a synthetic jet. However, it cannot be an accurate boundary condition. Whilst the dynamic mesh method simulates the actuator more realistically and performs better than the mass flow (or velocity) inlet, it requires more computational time because of updating the new grid(Reference Ma, Guo, Fan and Zhang18).
In the present work, the dynamic layering method(Reference Ma, Guo, Fan and Zhang18) is used to update the new grid at any time step. This method allows specifying an ideal layer height at each moving boundary. The layer of cells adjacent to the moving boundary is split or merged with the layer of cells next to it based on the minimum height (h min) of the cells that are adjacent to the moving boundary. In the simulation, the criterion for splitting the cells is h min ⩾ (1 + as)h ideal and for merging the cells, it is h min ⩽ ach ideal, where h min is the minimum cell height, h ideal is the ideal cell height, as is the layer split factor, and ac is the layer collapse factor.
The computational domain of Fig. 3 has two symmetry surfaces so that only a quarter of the domain is considered and the results are generalised for the entire domain. All the quantities across a symmetry boundary condition are considered to be of zero flux.
Also, all the walls are adiabatic and a no-slip condition is applied to all of them. In addition, the pressure outlet boundary condition is specified to the outlet boundary. Hence, the reversed flow occurrence is considered.
3.6 Initial conditions
Initial conditions are an important issue in a numerical simulation. Selecting a set of unrealistic initial conditions can cause a divergence in the solution or an increase in the computational time of a simulation. Usually, there are two ways of applying initial conditions(Reference Panaras and Drikakis33): (i) a ‘Uniform-Unsteady Condition’ (UUC) that initialises the flow variables to a uniform flow field based on the free stream conditions and applies the unsteady flow solver from the beginning of the simulation and (ii) a ‘Steady Feeding-Unsteady’ (SFU) condition that is based on an approximate steady-state solution obtained by applying the steady solver. Naturally, both of these procedures should lead to the same results. However, in some cases, it has been discovered that the direct application of the UUC procedure leads to erroneous results. On the contrary, application of the SFU procedure (i.e. application of an initially steady solver) gives physically feasible results, as compared with the experiment(Reference Panaras and Drikakis33).
In the present paper, the SFU procedure is employed, meaning that the entire domain is solved first by a steady simulation. The initial conditions for the steady simulation are listed in Table 1.
Table 1 The initial condition values for the steady simulation

It is clear that in the steady simulation, there is no moving boundary or velocity inlet. Hence, a fixed value of velocity (dependent on Re) is assigned to the actuator. After reaching a convergence status, the steady solution is fed to start the unsteady simulation. To apply the unsteady simulation, a first-order implicit scheme is selected for discretising the time. A fixed time-stepping scheme equal to 4.85 × 10− 5 providing a convergent solution within 15-20 iterations in each time step is used. The steady result is now defined as the new initial conditions for the unsteady simulation and the unsteady simulation is then started. Now, the moving boundary condition (or velocity inlet) is utilised for the actuator. To ensure that the results are not affected by the initial conditions, the instantaneous velocity is monitored and recorded at some points in the domain and the problem is solved for several cycles. After reaching periodicity at all the monitored points, the iteration is stopped.
3.7 Numerical scheme
The governing equations for the incompressible case are solved based on the constant properties assumption. However, for the compressible case, this is achieved under the assumptions of ideal gas and constant properties. For this purpose, the finite volume approach(Reference Versteeg and Malalasekera34) based on the first-order implicit time discretisation and the second-order upwind scheme are employed to discretise and to solve the governing equations, respectively. Furthermore, the pressure equation is discretised by the standard scheme and the Pressure Implicit with Splitting of Operator (PISO) algorithm is employed for the coupling of continuity and momentum equations. For both cases, the momentum, turbulence kinetic energy, and specific dissipation-rate equations are discretised by a second-order upwind scheme. For the discretisation of the energy equation in the compressible case, the same scheme is also utilised.
The coupling algorithm in the present simulations is the pressure-based solver. The pressure-based solver employs an algorithm that belongs to a general class of methods called projection methods. The projection method introduced by Chorin(Reference Chorin35) is an efficient way for solving the incompressible Navier-Stokes equations. One of the most important advantages of this method is that the computations of the velocity and pressure fields are decoupled. Also, the constraint of mass conservation (continuity) of the velocity field is achieved by solving a pressure (or pressure correction) equation. The pressure equation is derived from the continuity and momentum equations in such a way that the velocity field, corrected by the pressure, satisfies the continuity. Since the governing equations are non-linear and coupled with one another, the solution process involves iterations wherein the entire set of governing equations is solved repeatedly until the solutions converge. There are two pressure-based solver algorithms, segregated algorithm and coupled algorithm. The segregated algorithm is presently used as the coupling algorithm. For further information, the readers are referred to Refs Reference Sachin, Vinay and N. Sreenivasulu36 and Reference Tamamidis, Zhang and Assanis37.
4.0 RESULTS AND DISCUSSION
4.1 Validation
In this section, the sensitivity of results to the mesh, time step and domain size is evaluated. In other words, the main purpose is to determine whether the present simulations are independent of the mesh, time step and domain sizes. To achieve this goal, the results are obtained for the incompressible case and the velocity inlet boundary condition where the Reynolds number is set to 10,000.
4.1.1 Mesh study
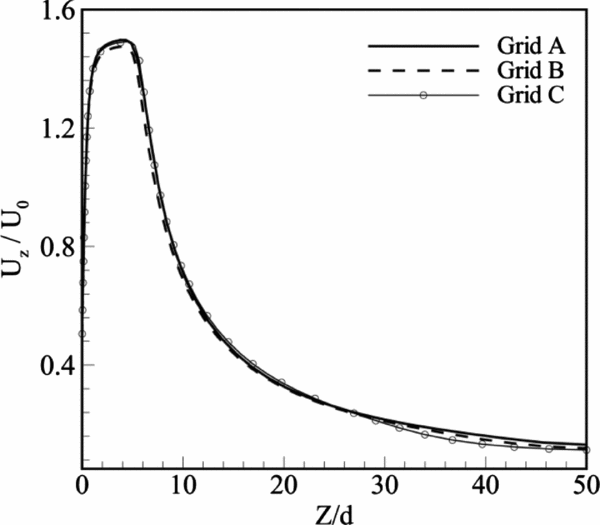
Three mesh sizes of 200,000, 400,000 and 800,000, named as Grid A, Grid B and Grid C (coarse, medium and fine meshes consecutively), are employed for the evaluation of results independency from the domain mesh size. Variation of the dimensionless time mean velocity in the Z direction (axial direction) at the centreline for Grids A to C is depicted in Fig. 4. The time mean velocity has been calculated based on the average of value of the instantaneous velocity at each point over one cycle. Comparative observation of the results demonstrates that Grid C is good enough for the computations throughout the present study.

Figure 4. Variation of the time mean velocity in the Z direction for different grid sizes.
It should be noted that the mesh density is not considered to be uniform due to the fact that extreme gradients of pressure and velocity near the orifice and inside the cavity require an intense mesh density in these regions. On the contrary, in the outer regions, by moving away from the orifice, the density of mesh is decreased due to the reduction of pressure gradient in all the three directions.
4.1.2 Time study
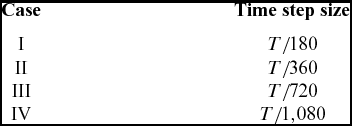
Setting an appropriate time step size is quite important in an unsteady problem. The time step size should be such that the full behaviour of the synthetic jet flow is recorded during a cycle. Four different time steps are used to ensure that the time step size does not affect the results. These time steps are shown in Table 2.
Table 2 Various time steps
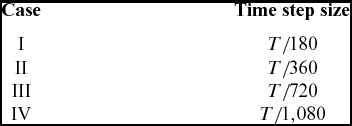
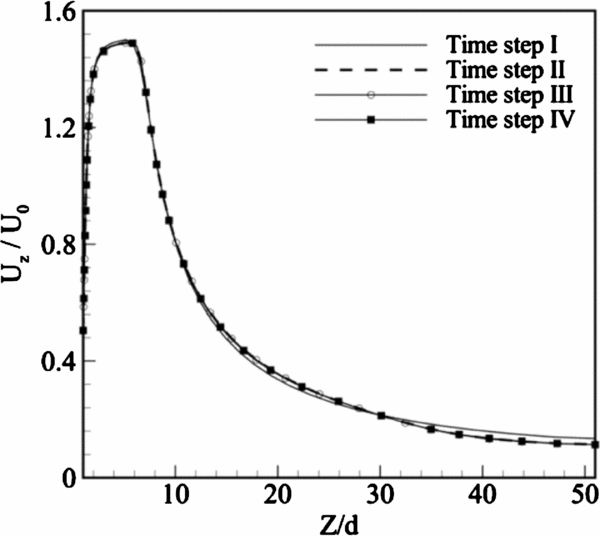
The time mean Z-velocity distributions at the centreline for the four time steps are represented in Fig. 5. It can be seen that the difference between the results is negligible. Hence, the time step III is chosen hereafter.

Figure 5. Variation of the time mean Z-velocity for various time steps.
4.1.3 Domain study
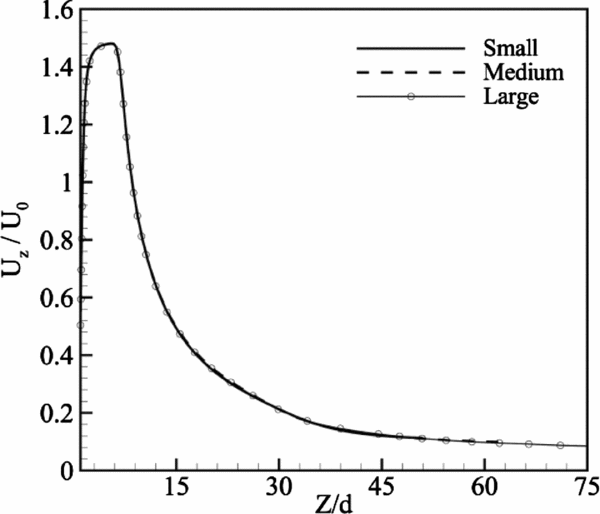
In the study of injection of a synthetic jet in a quiescent medium, an unbounded medium is the actual medium that should be simulated. However, simulating an unbounded medium is not possible. Therefore, a pressure outlet boundary condition must be introduced that is positioned at a sufficiently far distance from the orifice. An appropriate distance from orifice makes the fluid near the pressure outlet boundary have negligible velocity so that its pressure is almost equal to the ambient pressure. To ensure that the pressure outlet boundary condition does not affect the results, three different domain sizes of 50d × 50d × 50d, 62.5d × 62.5d × 62.5d and 75d × 75d × 75d named as small, medium and large domains, respectively, are employed. The distributions of the time mean Z-velocity along the centreline for various domain sizes are displayed in Fig. 6. It is observed that the difference between the results is not significant and hence the small domain size is regarded as the appropriate choice throughout the present investigation. Although the results concerning these three domains show a bit of inconsistency in the far field region, similarity in the studied region of the current investigation (Z/d ⩽ 50) is distinct.

Figure 6. Distributions of the time mean Z-velocity for different domain sizes.
Also, three different cases designated as low, mid and high are employed for the evaluation of the sensitivity of the results to the value of residuals. The details of these cases are presented in Table 3. This evaluation is carried out based on the present fine mesh (i.e. Grid C), time step III (i.e. T/720) and small domain size (i.e. 50d × 50d × 50d).
Table 3 Different residual values

The differences between the computed results for mid and high cases are negligible. Thus, the mid case is presently chosen as the converge criterion of the equations.
4.2 Compressibility effects
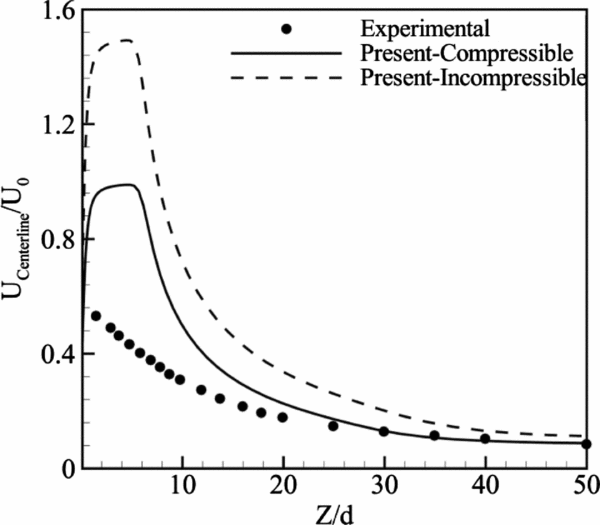
In the present section, the effects of compressibility on the synthetic jet flow field and the influence of varying the Reynolds number (Re) are considered. The instantaneous and time-mean data are studied. Profiles of the normalised time mean velocity comprising the present incompressible case, compressible case simulations and the existing experimental data of Iuso et al(Reference Iuso, Di Cicca and Donelli8) at the centreline are represented in Fig. 7. Although a seeming difference exists between these two cases and the experiment, particularly near the orifice (Z/d ⩽ 10) due to the mentioned weakness of the hot wire measurement (see Section 3.5), the present simulations capture well the experiment far from the orifice (Z/d ⩾ 20). In addition, the compressible case model illustrates more accurate results than the incompressible one, not only far from the orifice but also near the orifice where dramatic over-estimation is significant for both the present simulations. Although a stroke to the working fluid even at a low Mach number (i.e. Ma < 0.3) can cause a compressible behaviour in the flow, the higher accuracy of the compressible case can be demonstrated in light of the fact that the present Reynolds number (Re = 10,000) provides Ma > 0.3, indicating that the compressibility impact should definitely be considered. Also, the relatively large pressure variation inside the cavity and near the orifice makes the compressibility effect of great importance. Therefore, the compressible case is a distinctly more accurate model and it is used for the simulation of the synthetic jet flow fields.

Figure 7. Comparisons of present time mean Z-velocity profiles with experiment(Reference Iuso, Di Cicca and Donelli8) along centreline.
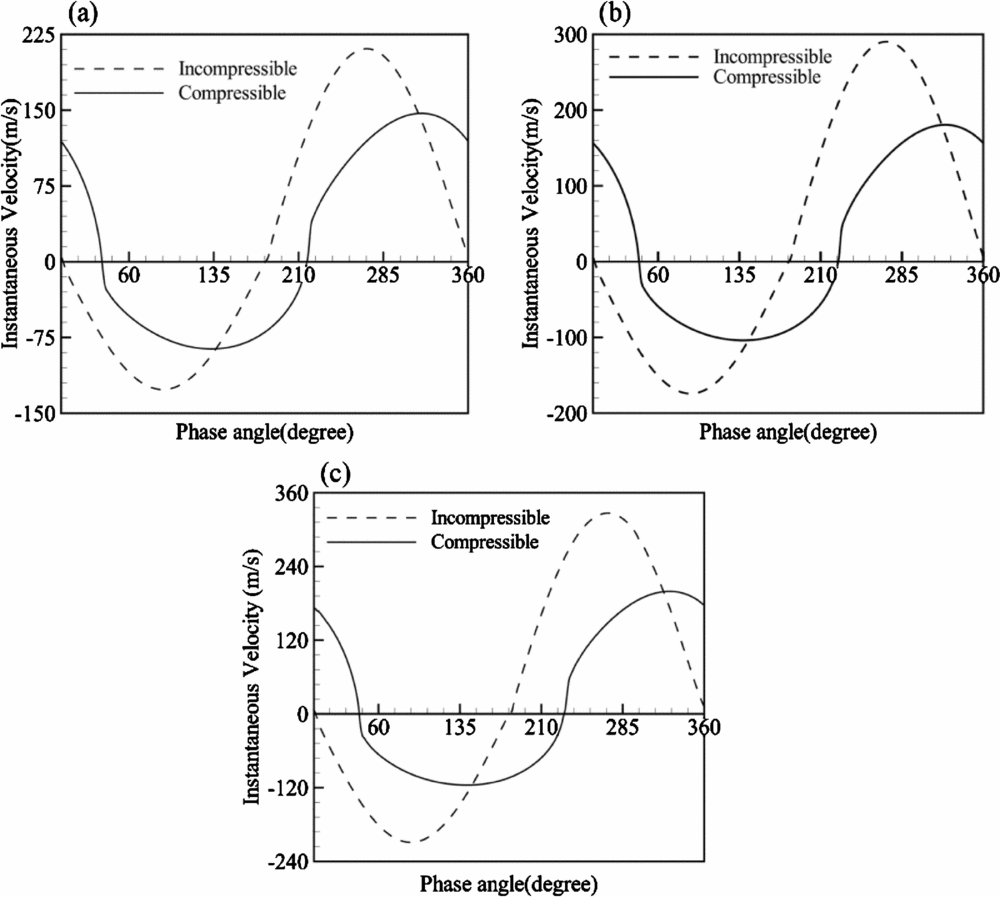
Figure 8 compares the instantaneous velocity profiles of the compressible and incompressible cases during one cycle of operation at ![]() ${{{Z}} / {{d}}}{\rm{ = 0}}{\rm{.05}}$ just above the orifice and for three different Re. The values of Reynolds numbers are such that the corresponding Mach number is greater than 0.3. Hence, based on Fig. 7, the occurrence of compressibility takes place at all three Re. When the suction stroke begins, the phase angle is considered to be zero (φ = 0). It is clear that for both cases, the maximum velocity magnitude in the blowing stroke is more than in the suction stroke. Also, the peak values of the velocity magnitude for the compressible case are less than those of the incompressible case during both the suction and blowing strokes. This lower maximum value for the compressible case is as a result of the destruction of the kinetic energy due to compression of the air molecules. In the case of the incompressible simulation, the kinetic energy is directly transported to each molecule without any need to compress the air molecules. Moreover, this transport of energy in the compressible case leads to a time delay, which causes the compressible case's delay in the phase angle with respect to the incompressible case at all Re. This delay is not constant for all Re and it enhances with an increase in Re where the delays for Re of 10,000, 8,430 and 6,130 are 42, 41 and 36 degrees, respectively.
${{{Z}} / {{d}}}{\rm{ = 0}}{\rm{.05}}$ just above the orifice and for three different Re. The values of Reynolds numbers are such that the corresponding Mach number is greater than 0.3. Hence, based on Fig. 7, the occurrence of compressibility takes place at all three Re. When the suction stroke begins, the phase angle is considered to be zero (φ = 0). It is clear that for both cases, the maximum velocity magnitude in the blowing stroke is more than in the suction stroke. Also, the peak values of the velocity magnitude for the compressible case are less than those of the incompressible case during both the suction and blowing strokes. This lower maximum value for the compressible case is as a result of the destruction of the kinetic energy due to compression of the air molecules. In the case of the incompressible simulation, the kinetic energy is directly transported to each molecule without any need to compress the air molecules. Moreover, this transport of energy in the compressible case leads to a time delay, which causes the compressible case's delay in the phase angle with respect to the incompressible case at all Re. This delay is not constant for all Re and it enhances with an increase in Re where the delays for Re of 10,000, 8,430 and 6,130 are 42, 41 and 36 degrees, respectively.

Figure 8. Instantaneous velocity for compressible and incompressible cases at (a) Re = 6,130, (b) Re = 8,430 and (c) Re = 10,000 (![]() ${{{Z}} / {{d}}} = 0.05$).
${{{Z}} / {{d}}} = 0.05$).
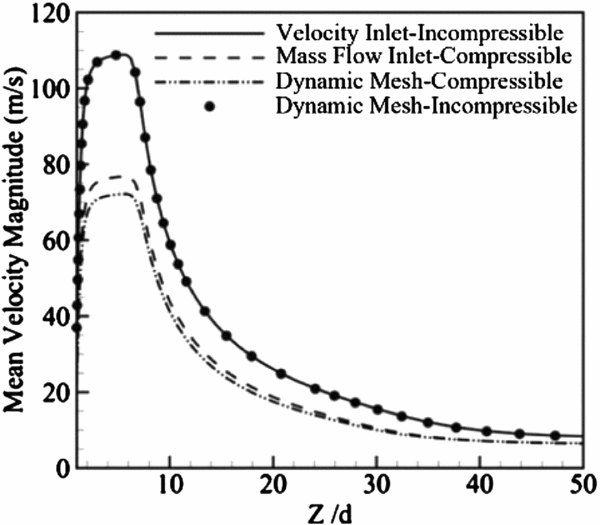
Figure 9 displays the time mean velocity magnitude profiles at the centreline for both the compressible and incompressible cases considering the role of the velocity inlet (or mass flow inlet) boundary condition and dynamic mesh method regarding the actuator. Both the velocity inlet and dynamic mesh profiles relating to the incompressible case display a negligible deviation, meaning that these two types of boundary conditions could be employed interchangeably for the incompressible case. Nonetheless, for the compressible case there is a noticeable difference between the two types of boundary conditions at smaller Z/d. The largest and average deviations between these two boundary conditions are 6.4% and 6.1%, respectively. This deviation of 6.1% can be explained by two things. First, it is relative to the temperature changes in the cavity. As an illustration, when applying an ideal gas assumption for the compressible case, injection of fluid in the medium in the blowing stroke causes a change in the pressure and temperature. Consequently, in the suction stroke, the fluid whose temperature has now been changed enters the cavity and the cycle continues again. The dynamic mesh method is capable of finely simulating the piston motion as the actuator of a synthetic jet. Nevertheless, the inlet boundary conditions (mass flow and velocity) cannot simulate the fluid suction headed towards the cavity. Therefore, the temperature of the cavity is constant and causes dissimilarity between the results. Second, it is relative to the application of an incorrect density to the inlet boundary condition. Thus, for the compressible case, the mass flow inlet boundary condition should be applied instead, as a multiplication of the density and the sinusoidal velocity function. Since the temperature within the cavity is indeterminate and variant, the mass flow inlet boundary condition cannot be defined accurately, leading to this difference in the results seen in Fig. 9.

Figure 9. Time mean velocity magnitude for compressible and incompressible cases concerning different boundary conditions.
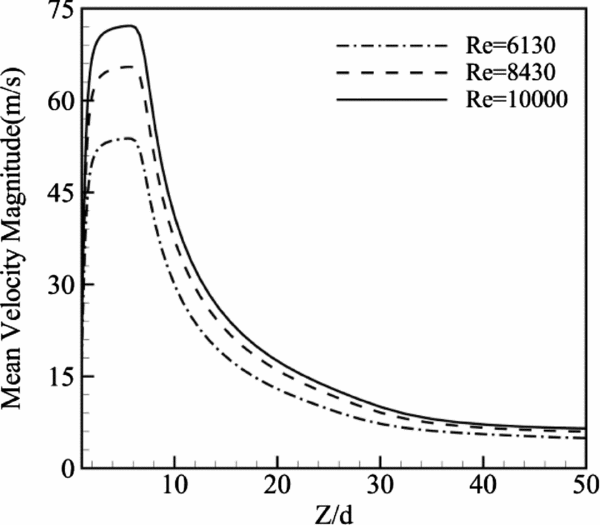
To investigate the influence of the Reynolds number on the compressible case simulations, the time mean velocity magnitude profiles at the centreline for three different Re are depicted in Fig. 10. The results imply that the peak of velocity magnitude where the blowing effect is larger than the suction effect rises as Re is increased. However, the position of the velocity peak is nearly the same for all Re.

Figure 10. Time mean velocity magnitude for different Reynolds numbers.
4.3 Synthetic jet behaviour
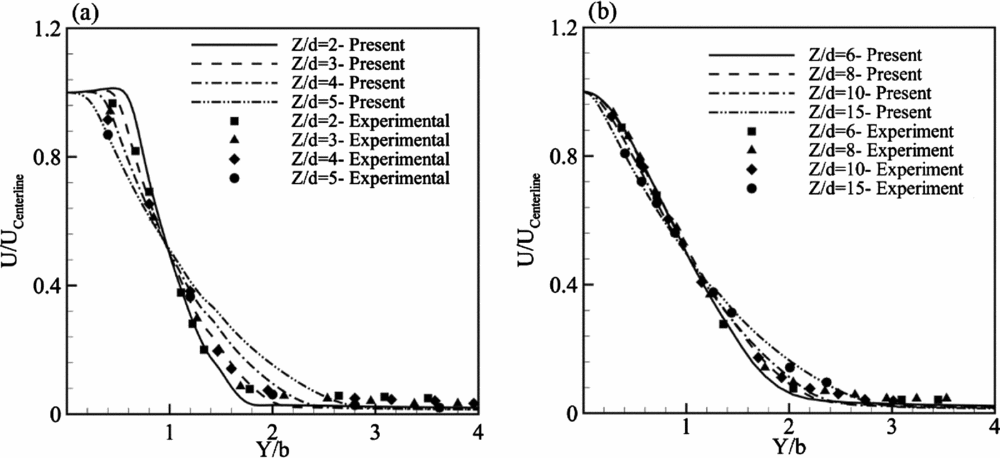
Characteristics and behaviour of a synthetic jet as well as the similarities and differences between a synthetic jet and steady jet are considered in this section. The variations of the time mean velocity magnitude profiles with the dimensionless y-axis (Y/b) against the available experimental data of Iuso et al(Reference Iuso, Di Cicca and Donelli8) at a fixed Re of 10,000 for both the near and far fields are illustrated in Fig. 11. The near field (![]() $ \approx {Z / d} \le 5$) is the region where at least a negative value in instantaneous velocity component due to the suction of the fluid occurs in each cycle (see Fig. 13). The mean velocity magnitude and the y-axis are normalised by the centreline velocity and the position b, successively(Reference Iuso, Di Cicca and Donelli8). b is the position where the velocity magnitude is equal to 0.5Ucl (Reference Iuso, Di Cicca and Donelli8). The present results show a reasonably good agreement with the existing experimental data. Moreover, as the jet expands through the domain, its strength decreases while the affected area is increased. In other words, near the orifice, the mean velocity is higher than at the other regions. However, its value is immediately reduced away from the jet exit (with increase of
$ \approx {Z / d} \le 5$) is the region where at least a negative value in instantaneous velocity component due to the suction of the fluid occurs in each cycle (see Fig. 13). The mean velocity magnitude and the y-axis are normalised by the centreline velocity and the position b, successively(Reference Iuso, Di Cicca and Donelli8). b is the position where the velocity magnitude is equal to 0.5Ucl (Reference Iuso, Di Cicca and Donelli8). The present results show a reasonably good agreement with the existing experimental data. Moreover, as the jet expands through the domain, its strength decreases while the affected area is increased. In other words, near the orifice, the mean velocity is higher than at the other regions. However, its value is immediately reduced away from the jet exit (with increase of ![]() ${Z / d}$). Therefore, according to Fig. 11(a), the ultimate reduction in the mean velocity at
${Z / d}$). Therefore, according to Fig. 11(a), the ultimate reduction in the mean velocity at ![]() ${Z / d} = 2$ occurs at
${Z / d} = 2$ occurs at ![]() ${Y / b} \approx 1.8$, whereas at
${Y / b} \approx 1.8$, whereas at ![]() ${Z / d} = 5$, this reduction takes place at
${Z / d} = 5$, this reduction takes place at ![]() ${Y / b} \approx 2.8$. For the far field (Fig. 11(b)), the reduction is almost the same for all
${Y / b} \approx 2.8$. For the far field (Fig. 11(b)), the reduction is almost the same for all ![]() ${Z / d}$ and it takes place at
${Z / d}$ and it takes place at ![]() ${Y / b} \approx 3$.
${Y / b} \approx 3$.

Figure 11. Time mean velocity magnitude profiles at (a) near field region and (b) far field region: comparison with experiment(Reference Iuso, Di Cicca and Donelli8).
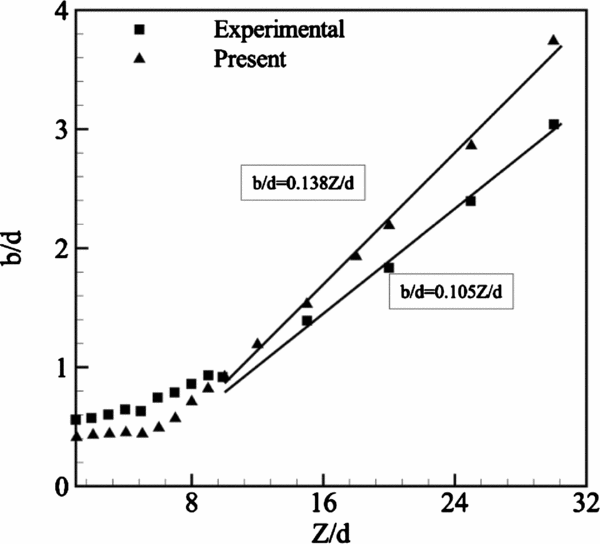
Figure 12 displays the half-jet-width evolution (b/d) along the centreline for the comparison of the present numerical and experimental(Reference Iuso, Di Cicca and Donelli8) results, as an indicator of the jet expansion in the domain. The half jet width is estimated by considering the conventional values of b in the Y direction at different distances of the normalised Z-axis, ![]() ${Z / d}$(Reference Iuso, Di Cicca and Donelli8). It is observed that the present simulations capture the available experimental data almost as well at both the near field and far field regions. Far enough from the orifice (
${Z / d}$(Reference Iuso, Di Cicca and Donelli8). It is observed that the present simulations capture the available experimental data almost as well at both the near field and far field regions. Far enough from the orifice (![]() ${Z / d} \ge 10$), the jet can be considered as a steady jet in which the jet expansion is linear. The steady jet slope can routinely be approximated by 0.1. The slope of the best fit (in the form of a straight line) for the experimental data is 0.105 whilst the present simulation demonstrates a steeper slope of nearly 0.138. However, the results are in fairly good agreement with the experiment and both predict the jet expansion similarly.
${Z / d} \ge 10$), the jet can be considered as a steady jet in which the jet expansion is linear. The steady jet slope can routinely be approximated by 0.1. The slope of the best fit (in the form of a straight line) for the experimental data is 0.105 whilst the present simulation demonstrates a steeper slope of nearly 0.138. However, the results are in fairly good agreement with the experiment and both predict the jet expansion similarly.

Figure 12. Synthetic jet half width evolution for comparison of present numerical and experimental(Reference Iuso, Di Cicca and Donelli8) results.
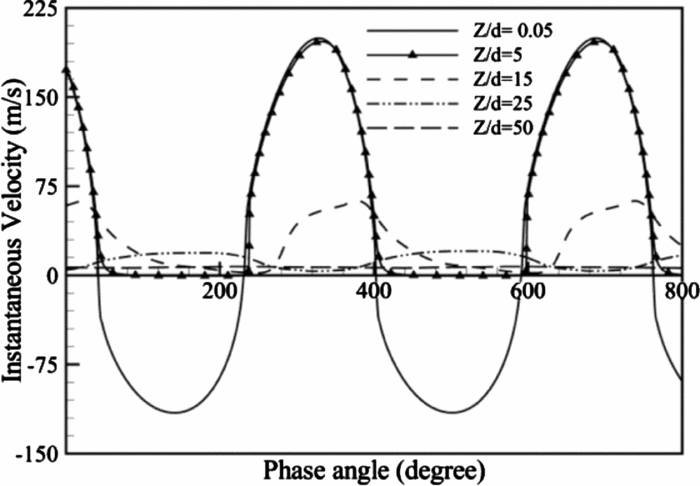
The instantaneous velocity profiles versus the phase angle of oscillation at five different points along the centreline are demonstrated in Fig. 13. The fluctuation of velocity at ![]() ${Z / d} = 0.05$ is between − 115.69m/s and 199.5m/s, signifying both the suction and blowing actions near the orifice. Also, the absolute peak of velocity during the blowing stroke is higher than that in the suction stroke. On the contrary, the effect of suction is almost diminished at
${Z / d} = 0.05$ is between − 115.69m/s and 199.5m/s, signifying both the suction and blowing actions near the orifice. Also, the absolute peak of velocity during the blowing stroke is higher than that in the suction stroke. On the contrary, the effect of suction is almost diminished at ![]() ${Z / d} = 5$ and the velocity always exhibits a positive value. However, the maximum velocity magnitude during the blowing stroke is not changed relative to
${Z / d} = 5$ and the velocity always exhibits a positive value. However, the maximum velocity magnitude during the blowing stroke is not changed relative to ![]() ${Z / d} = 0.05$. As the height of streamwise location increases the maximum value of velocity decreases while the minimum value remains constant (see locations
${Z / d} = 0.05$. As the height of streamwise location increases the maximum value of velocity decreases while the minimum value remains constant (see locations ![]() ${Z / d} = 15$ and
${Z / d} = 15$ and ![]() ${Z / d} = 25$). Although at
${Z / d} = 25$). Although at ![]() ${Z / d} = 15$ and
${Z / d} = 15$ and ![]() ${Z / d} = 25$ the minimum value of velocity is consistent, the maximum one is reduced. Finally, at the farthest point from the orifice (
${Z / d} = 25$ the minimum value of velocity is consistent, the maximum one is reduced. Finally, at the farthest point from the orifice (![]() ${Z / d} = 50$), the frequency effect is removed and the synthetic jet flow field is converted to a steady jet flow field. This reduction and zero tendency of the instantaneous velocity are as a result of kinetic energy dissipation.
${Z / d} = 50$), the frequency effect is removed and the synthetic jet flow field is converted to a steady jet flow field. This reduction and zero tendency of the instantaneous velocity are as a result of kinetic energy dissipation.

Figure 13. Instantaneous Z-velocity at different locations along centreline.
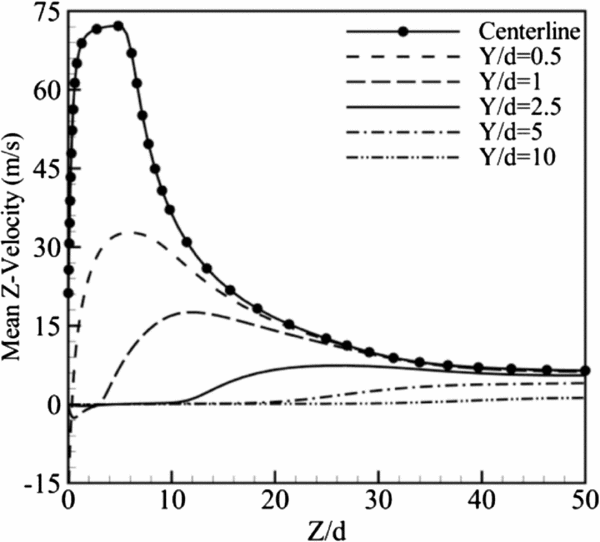
Figure 14 shows the distributions of time mean Z-velocity at the centreline and along parallel lines in the y-direction, in the Y/d range of 0.5–10. By getting further away from the centreline, the peak of the Z-velocity decreases and it shifts to larger ![]() ${Z / d}$. The existence of the velocity peak is related to the blowing and suction effects where the blowing strength is greater than the suction strength. In addition, except at the centreline, the suction in the cavity occurs in the rest lines and there are negative velocities at some points, which is one of the characteristics of the synthetic jets. Also, as displayed in Fig. 14, during the blowing stroke the maximum velocity takes place at the centre of the orifice, whilst in the suction stroke, the fluid enters the cavity from the sideways leading to the maximum velocity occurrence at the side edges of the orifice. The presence of negative velocities at the points next to the orifice indicates that the effect of suction is more than blowing in that region. The maximum negative Z-velocity is − 15m/s at Y/d = 0.5 where it can be considered as the region of the maximum velocity occurrence in the suction stroke.
${Z / d}$. The existence of the velocity peak is related to the blowing and suction effects where the blowing strength is greater than the suction strength. In addition, except at the centreline, the suction in the cavity occurs in the rest lines and there are negative velocities at some points, which is one of the characteristics of the synthetic jets. Also, as displayed in Fig. 14, during the blowing stroke the maximum velocity takes place at the centre of the orifice, whilst in the suction stroke, the fluid enters the cavity from the sideways leading to the maximum velocity occurrence at the side edges of the orifice. The presence of negative velocities at the points next to the orifice indicates that the effect of suction is more than blowing in that region. The maximum negative Z-velocity is − 15m/s at Y/d = 0.5 where it can be considered as the region of the maximum velocity occurrence in the suction stroke.

Figure 14. Time mean Z-velocity along parallel lines.
4.4 Geometric effects in the compressible case
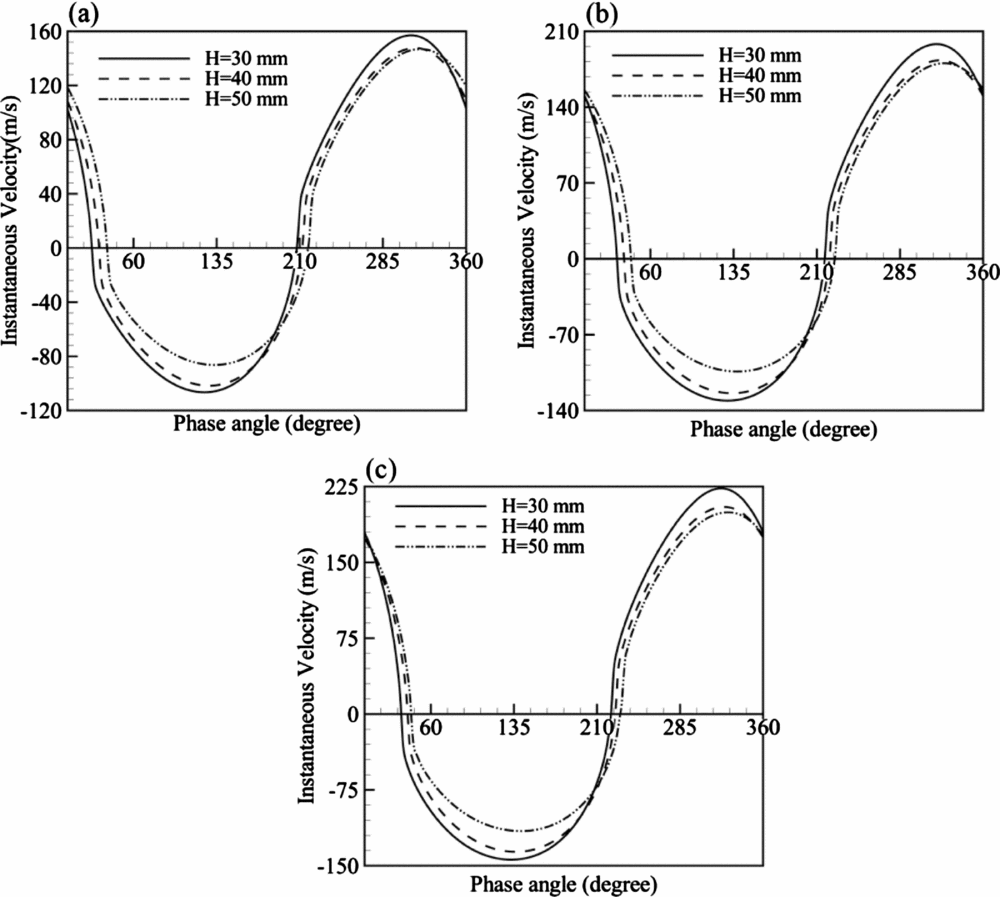
The instantaneous velocity profiles during one complete cycle of operation for three various cavity heights of H = 30-50mm and at three values of Re, at ![]() ${Z / d} = 0.05$ just above the orifice are represented in Fig. 15. Utturkar et al(Reference Utturkar, Mittal, Rampunggoon and Cattafesta24) have shown that for an incompressible regime, changing the cavity height does not significantly affect the synthetic jet flow field. Figure 15 shows that unlike an incompressible regime, the cavity height has a considerable influence on the synthetic jet flow field in a compressible regime (i.e. the present compressible case simulation). It is observed that by reducing H, the maximum velocity magnitude in both the suction and blowing strokes is increased at all the three Re. In addition, the delay in the phase is reduced by decreasing H. These effects are further illustrated by noting that in a shorter cavity, the transport of energy and hence the destruction of energy between the molecules is less than a longer cavity, leading to the greater maximum velocity magnitude and lesser delay in the phase angle of oscillation.
${Z / d} = 0.05$ just above the orifice are represented in Fig. 15. Utturkar et al(Reference Utturkar, Mittal, Rampunggoon and Cattafesta24) have shown that for an incompressible regime, changing the cavity height does not significantly affect the synthetic jet flow field. Figure 15 shows that unlike an incompressible regime, the cavity height has a considerable influence on the synthetic jet flow field in a compressible regime (i.e. the present compressible case simulation). It is observed that by reducing H, the maximum velocity magnitude in both the suction and blowing strokes is increased at all the three Re. In addition, the delay in the phase is reduced by decreasing H. These effects are further illustrated by noting that in a shorter cavity, the transport of energy and hence the destruction of energy between the molecules is less than a longer cavity, leading to the greater maximum velocity magnitude and lesser delay in the phase angle of oscillation.

Figure 15. Instantaneous velocity for different cavity heights at (a) Re = 6,130 (b) Re = 8,430 and (c) Re = 10,000 (![]() ${Z / d} = 0.05$).
${Z / d} = 0.05$).
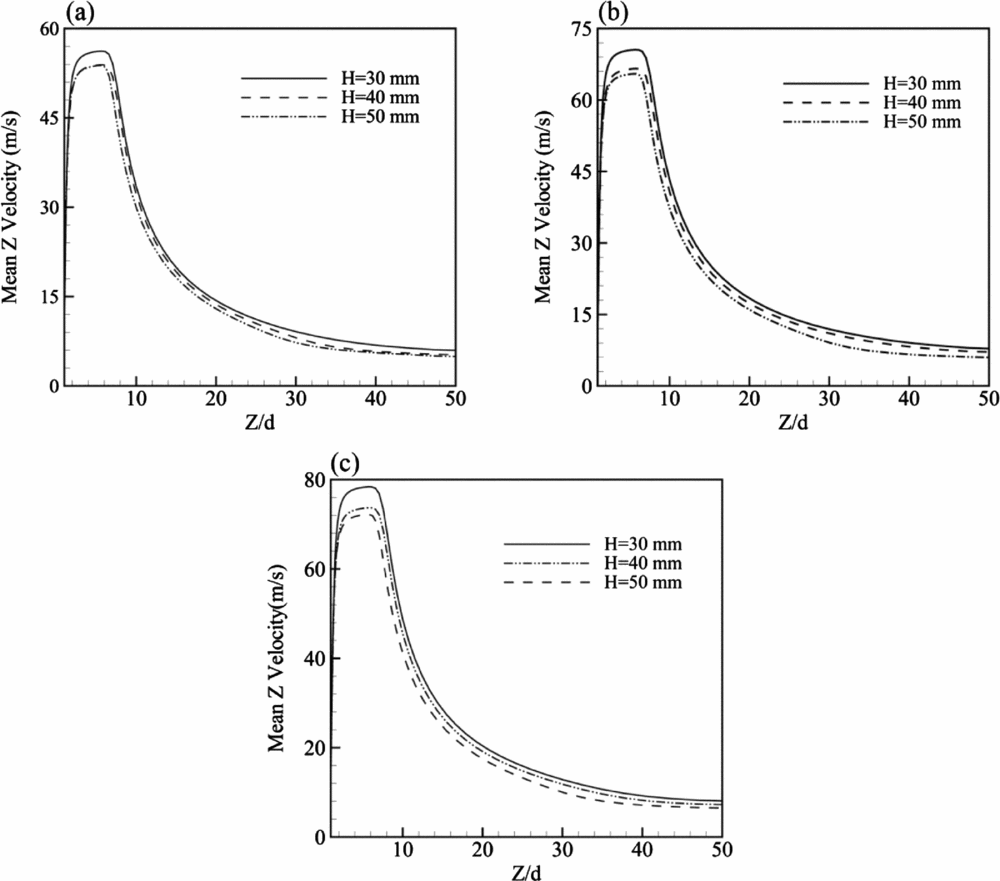
The time mean Z-velocity profiles for the three different values of H and at three Re along the centreline are shown in Fig. 16. The results are consistent with those of Fig. 15 and the significant effect of the cavity height on the present compressible case simulation results are pointed out. It is clear that although the peak of the mean velocity profile rises with a decrease in the cavity height, its position remains unchanged. Moreover, in the compressible case, unlike in the incompressible one, variation of H results in a change in the synthetic jet flow field.

Figure 16. Time mean Z-velocity at the centreline for different cavity heights (a) Re = 6,130 (b) Re = 8,430 and (c) Re = 10,000.
5.0 CONCLUSIONS
The present paper concentrates on a three-dimensional unsteady turbulent synthetic jet to evaluate two different ways of simulation of the actuator, namely, the mass flow inlet (velocity inlet in the incompressible case) and dynamic mesh method and also investigate important geometrical and flow parameters (i.e. cavity height and Reynolds number). The main conclusions are as follows:
1. The compressible case model offers more accurate results than the incompressible one, not only far from the orifice but also near the orifice where a dramatic over-estimation is significant for both the present simulations. Although a stroke to the working fluid even at a low Mach number can cause a compressible behaviour in the flow, the higher accuracy of the compressible case can be demonstrated in light of the fact that all present Reynolds numbers provide Ma > 0.3, indicating that the compressibility impact should definitely be considered. Also, the relatively large pressure variation inside the cavity and near the orifice makes the compressibility effect of great importance. Therefore, the compressible case is a distinctly more accurate model and it is used for the simulation of the synthetic jet flow fields.
2. The best fit (in the form of a straight line) of the half jet width for the experimental data is 0.105 whilst the present simulation demonstrates a steeper slope of nearly 0.138.
3. Both the velocity inlet boundary condition and dynamic mesh method profiles relating to the incompressible case display a negligible deviation, meaning that these two types of boundary conditions could be employed interchangeably for the incompressible case.
4. There is a noticeable difference between the two types of boundary conditions at smaller Z/d for the compressible case. The largest and the average deviations between these two boundary conditions are 6.4% and 6.1%, respectively.
5. The peak values of the velocity magnitude for the compressible case are less than those of the incompressible case during both the suction and blowing strokes.
6. The compressible case has a time delay in the phase angle with respect to the incompressible case at all Re. This delay is not constant at all Re and it increases with an increase in Re.
7. The peak of velocity magnitude where the blowing effect is larger than the suction effect rises as Re is increased. However, the position of the velocity peak is nearly the same for all Re.
8. By reducing the cavity height, the maximum velocity magnitude for both the suction and blowing strokes is increased at all the three Re. In addition, the delay in the phase is reduced by decreasing the cavity height.


