NOMENCLATURE
- EGT
-
Exhaust gas temperature
- UCAV
-
Unmanned Combat Aerial Vehicle
- GSP
-
Gas turbine Simulation Program
- UAV
-
Unmanned Aerial Vehicle
- PBF
-
powder bed fusion
1.0 INTRODUCTION
Aircraft survivability is recognised as a very important factor in modern aviation warfare. The aircraft survivability is divided into two types. One is the detectability of weapon systems; the other is the vulnerability that affects mission performance due to physical strikes after detection. Signals related to the detectability of aircraft includes infrared signals, radar waves, sound waves and visible light. Among these, stealth technology that reduces the detectability of infrared signals in aircraft weapon systems is important due to the development of infrared detection technology. The main elements that generate infrared signals in aircraft are high-temperature engines and nozzles, exhaust gas, heating parts by exhaust gases, surface heating by aerodynamic heating, surface radiation and sun reflection. In particular, the technology to reduce infrared signal is important for improving aircraft survivability, as the high-temperature, high-pressure exhaust gas emitted from the aircraft engine(Reference Baranwal and Mahulikar1,Reference Mahulikar, Sonawane and Rao2) .
Meanwhile, modern aircraft employ turbofan engines to increase engine power and reduce infrared signals, and turbofan engines are also used in most UCAVs that perform reconnaissance and attack missions(Reference Joo, Choi and Jo3). The turbofan engine reduces the infrared signal by mixing the high-temperature exhaust gas from the turbine with the relatively low-temperature bypass air and discharging it to the atmosphere, at this time the use of a lobed mixer with multiple protruding outlet shapes at regular intervals increases the mixing efficiency of the flow in a short mixing section. It can be used for infrared signal reduction by significantly reducing the exhaust gas temperature, and research on such aircraft infrared reduction techniques has been actively conducted around the world. Joo et al.(Reference Joo, Jo, Choi and Jo4) measured the infrared signal according to the bypass ratio for the cone nozzle without the lobed mixer using the same micro-turbojet engine and experimental technique as in this study and had an effect of reducing the infrared signal by up to 15.9% at the nozzle outlet. Decher et al.(Reference Decher5) studied infrared signal characteristics according to the bypass ratio of the turbofan and the aspect ratio of the nozzle. Rao(Reference Rao, Buijtenen and Mahulikar6) conducted a study on the plume infrared radiation of a turbofan engine according to the bypass ratio using a GSP. On the other hand, previous studies on lobed mixers have been limited to studies on aerodynamic characteristics such as noise reduction of aircraft, thrust and mixing efficiency of lobed mixers(Reference Khalid7,Reference Mengle and Dalton8) , but recently, studies on infrared signal characteristics of lobed mixers have been conducted. Zhi et al.(Reference Sheng, Liu, Yao and Xu9) comprehensively analysed the flow field structure and heat and mass transfer in the mixing section for two types of lobed mixers using numerical methods. Yong et al.(Reference Shan and Zhang10) performed a study to analyze the infrared signal characteristics, mixing efficiency, thrust, etc., according to the shape of the lobed mixer and the bypass ratio by a numerical analysis method and to verify them through experiments. Nam et al.(Reference Nam, Bae, Bea, Kim and Cho11) studied the effect of reducing the infrared signal of an UAV according to the shape change of a lobed mixer by a numerical method. However, most of the research on the lobed mixer is limited to analytical research, and therefore a close experimental study on the infrared signal characteristics of the lobed mixer is necessary. Since experiments using full-size aircraft engines are expensive and require large experimental facilities, micro-turbojet engines are often used in these studies(Reference Sircilli, Retief, Maglhaes, Ribeiro, Zanandrea, Brink, Nascimento and Dreyer12,Reference Shan, Zhang and Huang13) . This study is to examine the infrared signal characteristics of the lobed mixer through a mixture of micro-turbojet engines and external air. Therefore, the study does not fully simulate the operating conditions of the actual mixed flow turbofan engine. For high-bypass mixed-flow turbofan engines operating in subsonic regions, the nozzle has a pressure ratio of approximately 1.4. Low-bypass turbofan engines operating in the supersonic range, the nozzle have a pressure ratio of 2.5 or higher. However, in this study, compressed air outside the micro-turbojet engine is used as a bypass flow, and experiments are conducted in a flow range of 0.5 to 1.4 times the core flow rate. For this reason, the actual engine nozzle pressure ratio is not properly simulated, but the study is conducted by simulating the bypass flow rate only.
2.0 METHOD
2.1 Micro-turbojet engine and exhaust nozzle
The micro-turbojet engine used in the study is AMT’s Olympus HP Engine, which consists of a centrifugal compressor, a straight combustion chamber, and an axial turbine. The picture and specification of engine are shown in Fig. 1. The maximum thrust of the micro-turbojet engine is 230 N, the compression ratio is 3.8: 1, the maximum revolutions per minute is 108,500rpm, the maximum EGT is 750°C, and a mixture of kerosene and Mobil jet oil2 lubricant (4.5%) is used as the engine fuel. The initial start of the engine is made by an electric motor installed at the inlet, and when it reaches a certain revolutions per minute after starting, it is separated from the engine shaft. Engine operation and performance measurements are monitored and recorded in real time through software (TMC V2.1.5.9, AMT).
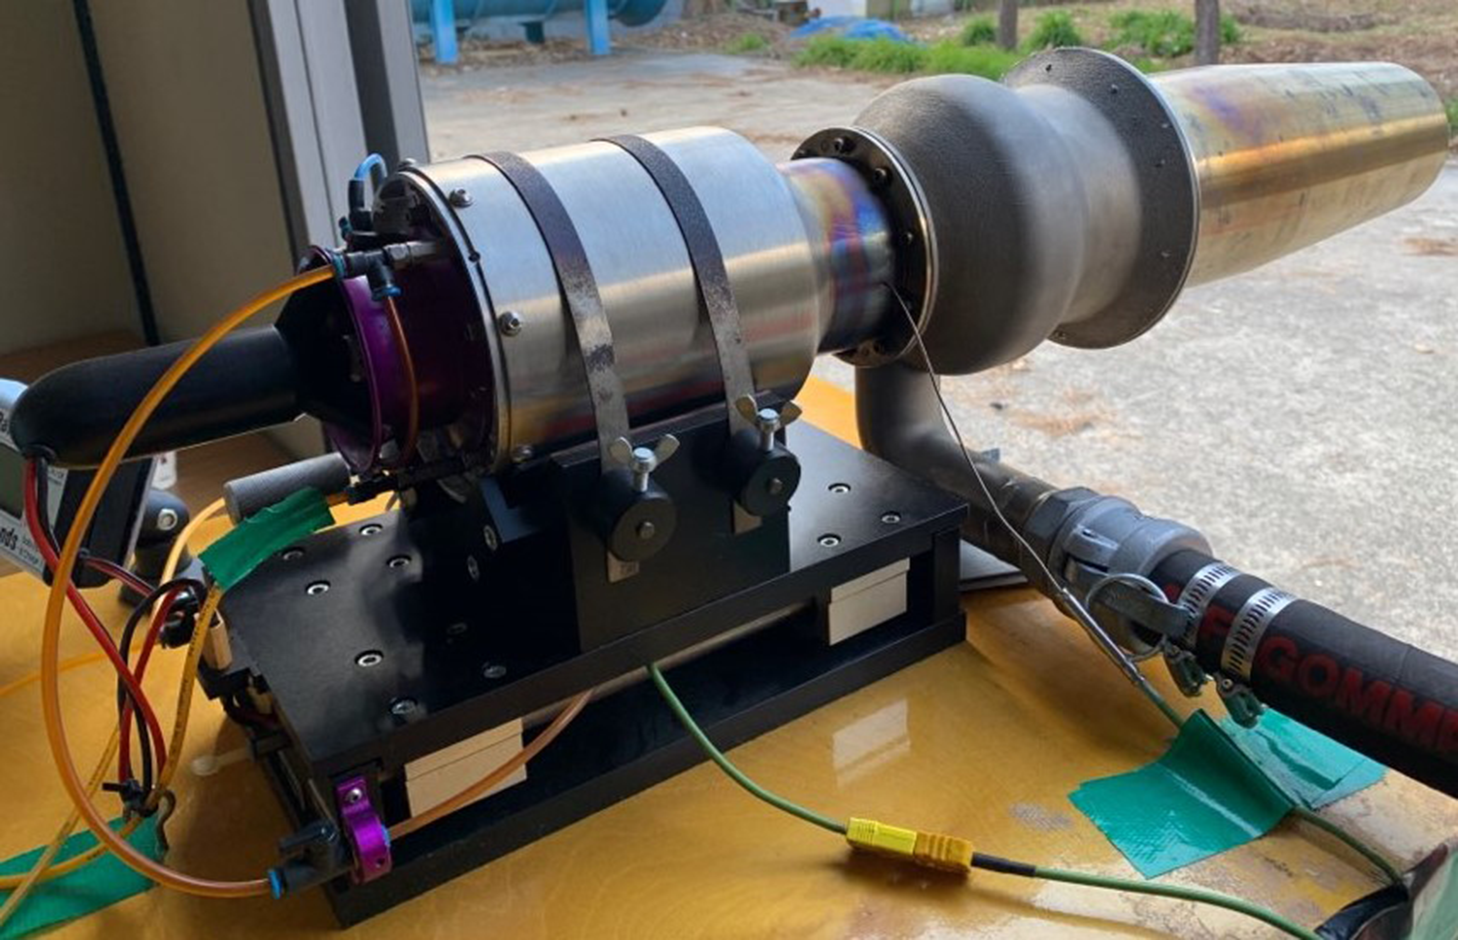
Figure 1. Olympus HP engine.
The lobed mixer used in the experiment is designed with reference to Barber et al.(Reference Barber, Paterson and Skebe14). Barber et al. designed several ideal lobes to be used in low-speed experimental equipment using the planar mixer geometry inverse analysis (PLANMIX) and then conducted analysis and experiments to predict the flow field characteristics at the lobe outlet. The design variable of the lobe is set to the height of the lobe, and the height and shape of the lobe are determined in consideration of the flow distribution at the specified strength at along the flat plate. The length of the lobe (
 ${L_m}$
) means the length from the inlet to the outlet of the lobe, and the height of the lobe
${L_m}$
) means the length from the inlet to the outlet of the lobe, and the height of the lobe
 $\left( h \right)$
is the protruding length of the lobe. Penetration
$\left( h \right)$
is the protruding length of the lobe. Penetration
 $\left( {Pe} \right)$
means the degree to which the core flow is projected onto the bypass flow and is calculated as Equation (1) as the ratio of the lobe height to the length of the mixer.
$\left( {Pe} \right)$
means the degree to which the core flow is projected onto the bypass flow and is calculated as Equation (1) as the ratio of the lobe height to the length of the mixer.
 \begin{equation}Pe = \frac{h}{{{L_m}}}\end{equation}
Barber et al. compare sinusoidal lobes with pressure and velocity in the same axial direction as flow for low penetration (Pe = 0.1) and high penetration (Pe = 0.4). As a result of the experiment, it is confirmed that when the flow passes the mixer, pressure increases in the crest and pressure decreases in the trough, and the larger the penetration value, the greater the pressure change. In addition, the skewing of the flow at the lobe exit section and the surface show that the high penetration is more active than the low penetration.
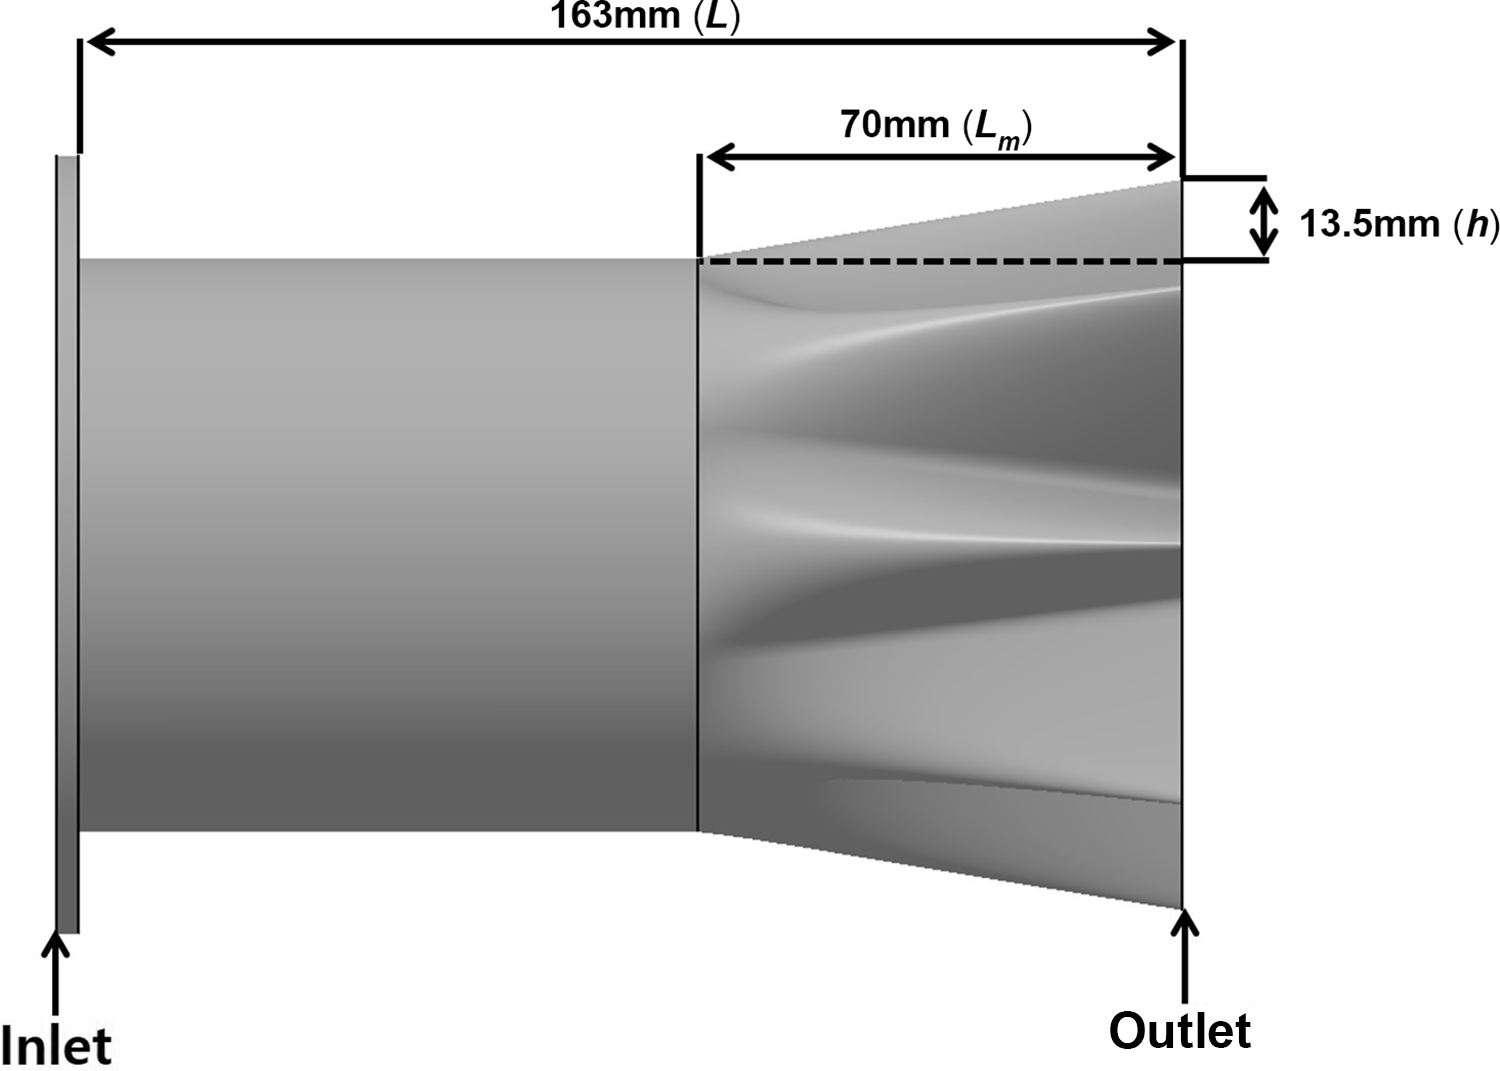
Based on the results of the study, the lobed mixer is designed to have the maximum penetration within the range that can be mounted on the micro-turbojet engine. Figure 2 and Table 1 show the side view and specifications of the lobed mixer. The lobed mixer was manufactured by the PBF method, and the applied material was a nickel-based super alloy (Inco 718). The total length of the exhaust nozzle is 163mm, of which the length of lobe
 $({L_m})$
is 70mm, the height of lobe
$({L_m})$
is 70mm, the height of lobe
 $\left( h \right)$
is 13.5mm and the penetration (
$\left( h \right)$
is 13.5mm and the penetration (
 $Pe)$
is about 0.2. The lobed mixer has an inlet area of about 5,400
$Pe)$
is about 0.2. The lobed mixer has an inlet area of about 5,400
 ${\rm{m}}{{\rm{m}}^2}$
and an outlet area of about 3,000
${\rm{m}}{{\rm{m}}^2}$
and an outlet area of about 3,000
 ${\rm{m}}{{\rm{m}}^2}$
. The lobed mixer inlet is applied with an area corresponding to the diameter of the turbine external casing. In addition, the outlet area of the lobed mixer is determined to be choked under the engine’s maximum operating conditions. The front view layout and picture of the lobed mixer are shown in Fig. 3. In Fig. 3(a), the outer diameter is 106mm, the inner diameter is 37.6mm and
${\rm{m}}{{\rm{m}}^2}$
. The lobed mixer inlet is applied with an area corresponding to the diameter of the turbine external casing. In addition, the outlet area of the lobed mixer is determined to be choked under the engine’s maximum operating conditions. The front view layout and picture of the lobed mixer are shown in Fig. 3. In Fig. 3(a), the outer diameter is 106mm, the inner diameter is 37.6mm and
 ${D_m}$
is the average diameter of the cross-sectional area at the end of the lobed mixer, which is 62mm. In Fig. 3(b), compressed air is supplied to an external duct fabricated with a lobed mixer to simulate the bypass flow in a micro-turbojet engine. Figure 4 shows the layout of the lobed mixer with the bypass nozzle and the lobed mixer picture. Compressed air supplied through the hose below the external duct of the lobed mixer is mixed with the hot core flow from the engine and discharged to the atmosphere. The nozzle length of the mixing section is 260mm. Inconel having strong durability against heat of exhaust gas is used. The exit diameter of the bypass nozzle (D) is 92mm and is shown in Fig. 3.
${D_m}$
is the average diameter of the cross-sectional area at the end of the lobed mixer, which is 62mm. In Fig. 3(b), compressed air is supplied to an external duct fabricated with a lobed mixer to simulate the bypass flow in a micro-turbojet engine. Figure 4 shows the layout of the lobed mixer with the bypass nozzle and the lobed mixer picture. Compressed air supplied through the hose below the external duct of the lobed mixer is mixed with the hot core flow from the engine and discharged to the atmosphere. The nozzle length of the mixing section is 260mm. Inconel having strong durability against heat of exhaust gas is used. The exit diameter of the bypass nozzle (D) is 92mm and is shown in Fig. 3.
Table 1 Lobed mixer specifications
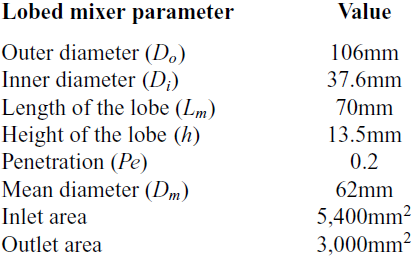

Figure 2. Side view of lobed mixer.
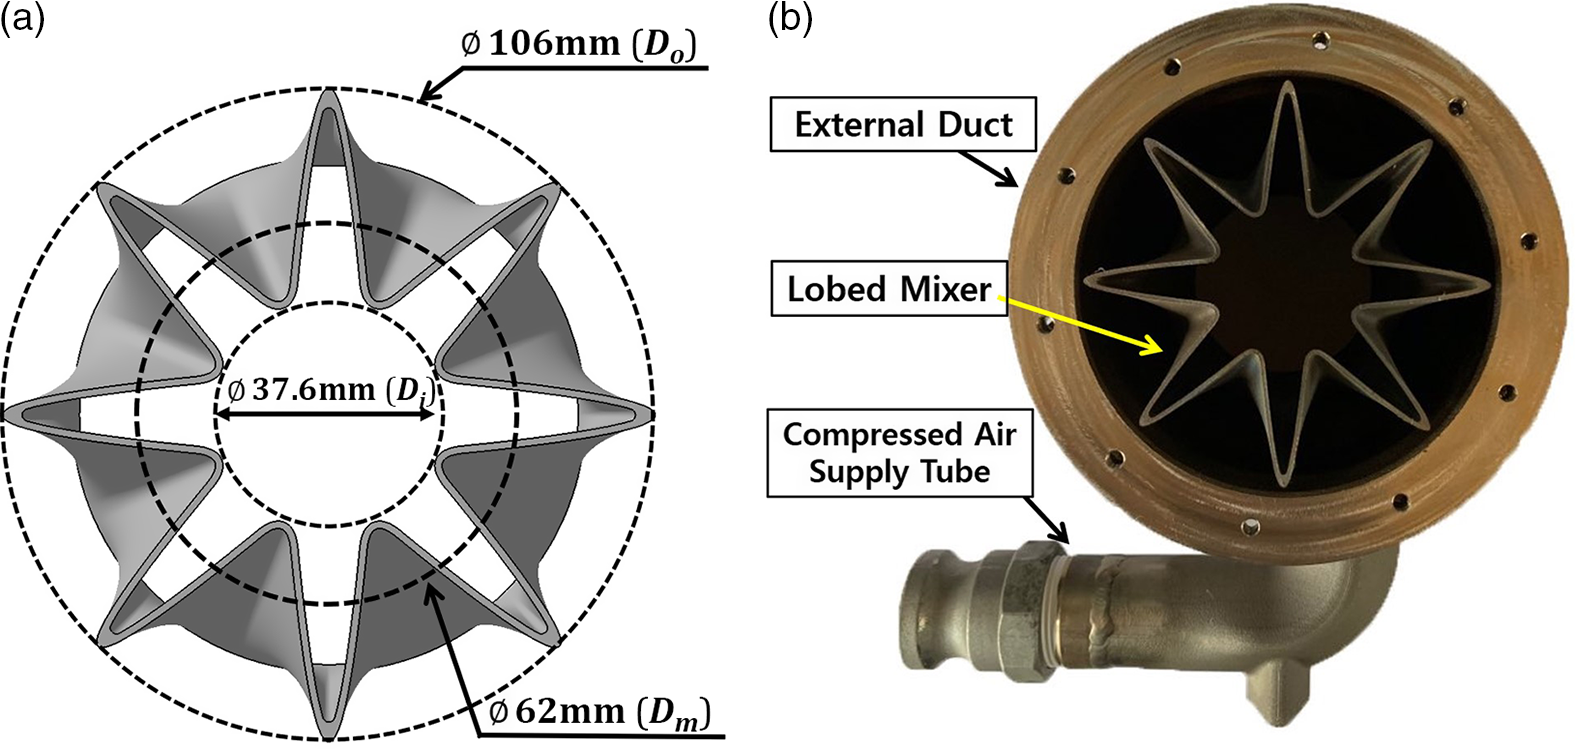
Figure 3. Layout of the lobed mixer (a) and front picture of the lobed mixer (b).
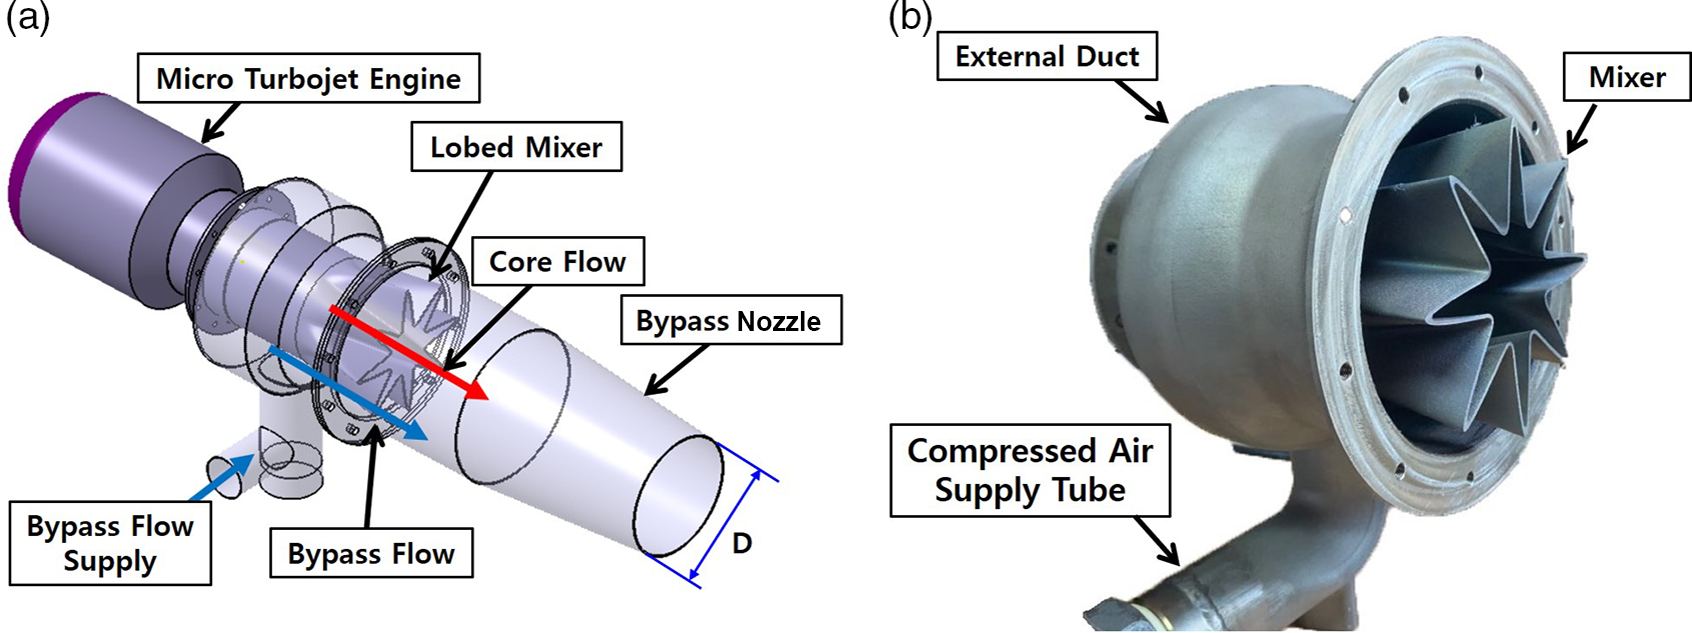
Figure 4. Micro-turbojet engine with lobed mixer (a) and side picture of lobed mixer (b).
2.2 Experiment method and equipment
The device is adjusted to control the high-pressure compressed air flow rate supplied to simulate the bypass flow to the micro-turbojet engine according to the bypass ratio. The compressed air supply system is shown in Fig. 5, and the layout of the system is shown in Fig. 6. Air compressed through the compressor is stored in the receiver tank and then supplied to the outer duct of the lobed mixer by applying a solenoid valve for 10 seconds when the engine reaches 43,000rpm. At this time, the flow of compressed air is regulated using a pressure reducing valve (DRE-F, YNV), and the mass flow rate is measured using a venturi tube flowmeter (GSAV-4000-S, Korea Flowmeter Industries), and the supply pressure is measured using a static pressure sensor (PSPHH0500PCPG, Sensys). The air supplied from the compressed air was set to simulate the bypass ratios of 0.5, 1.0 and 1.4. At bypass ratios of 0.5, 1.0 and 1.4, each air flow rates supplied from the compressor are 0.074, 0.149, and 0.208kg/s.
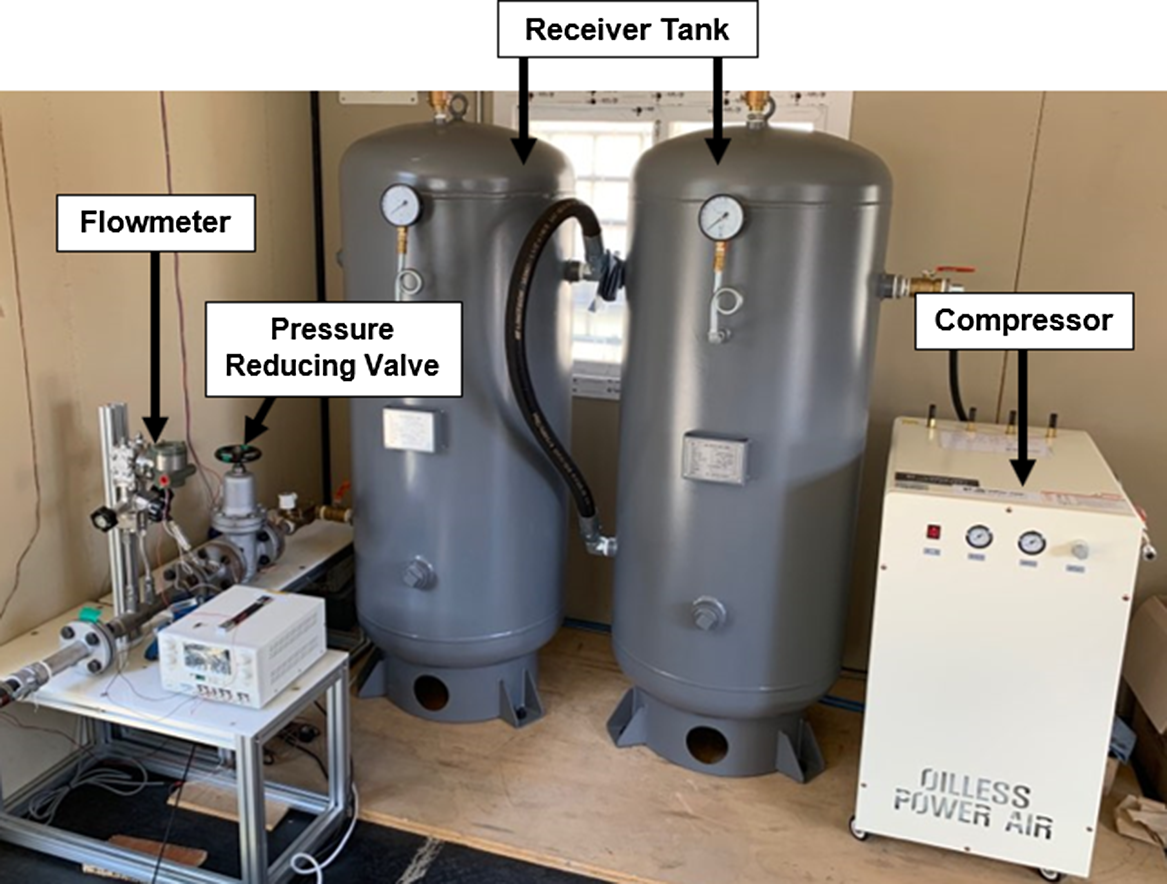
Figure 5. Compressed air supply system.
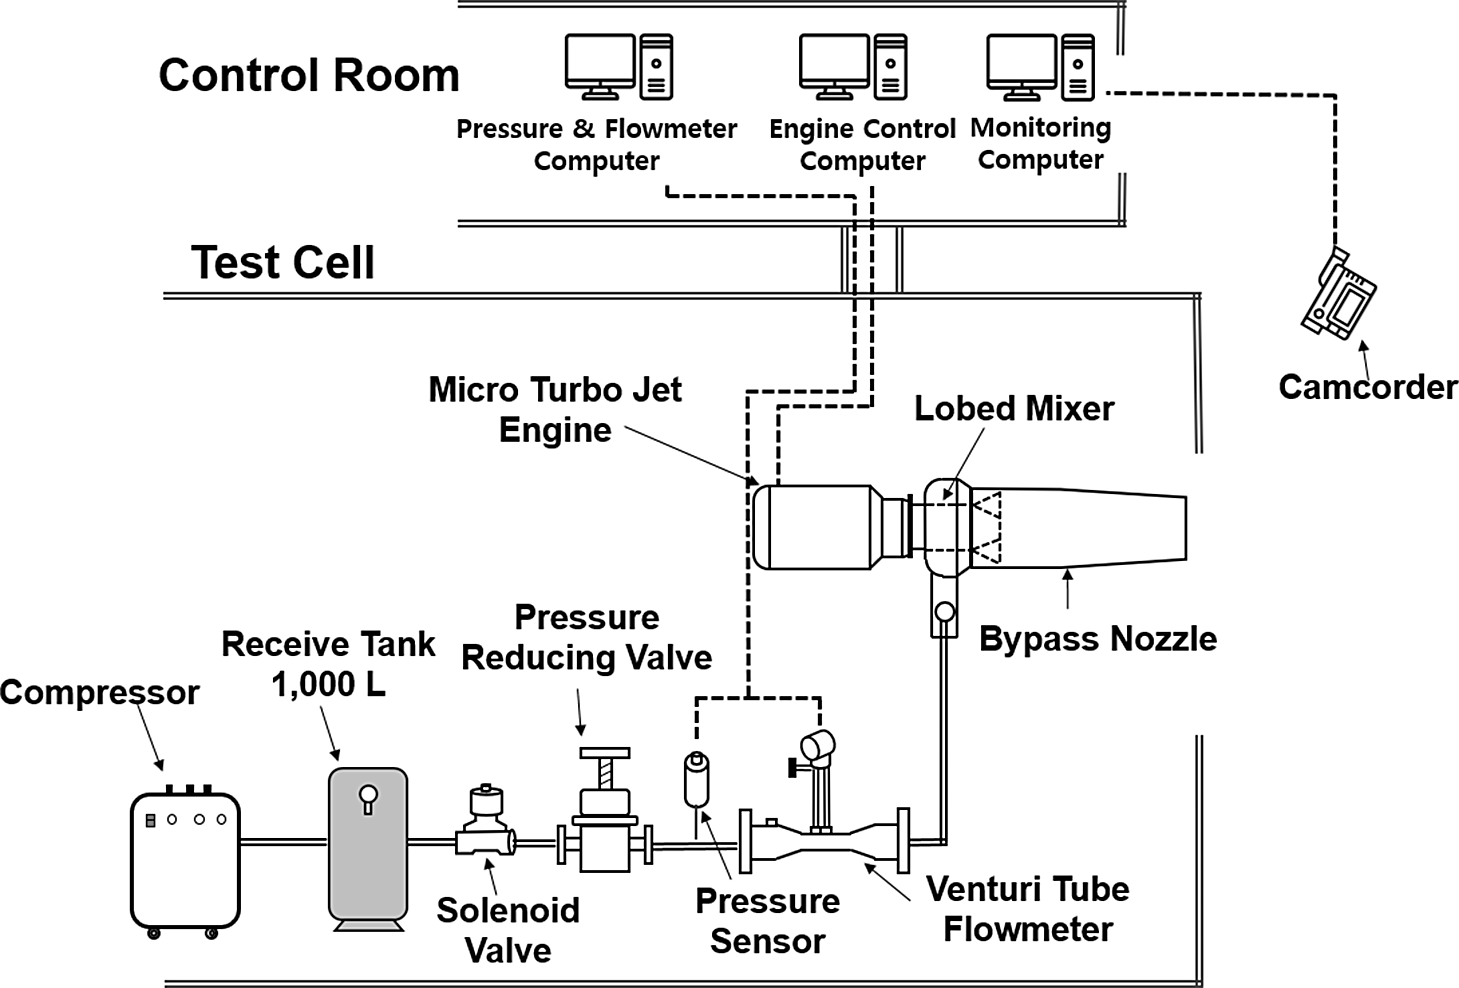
Figure 6. Layout of compressed air supply system.
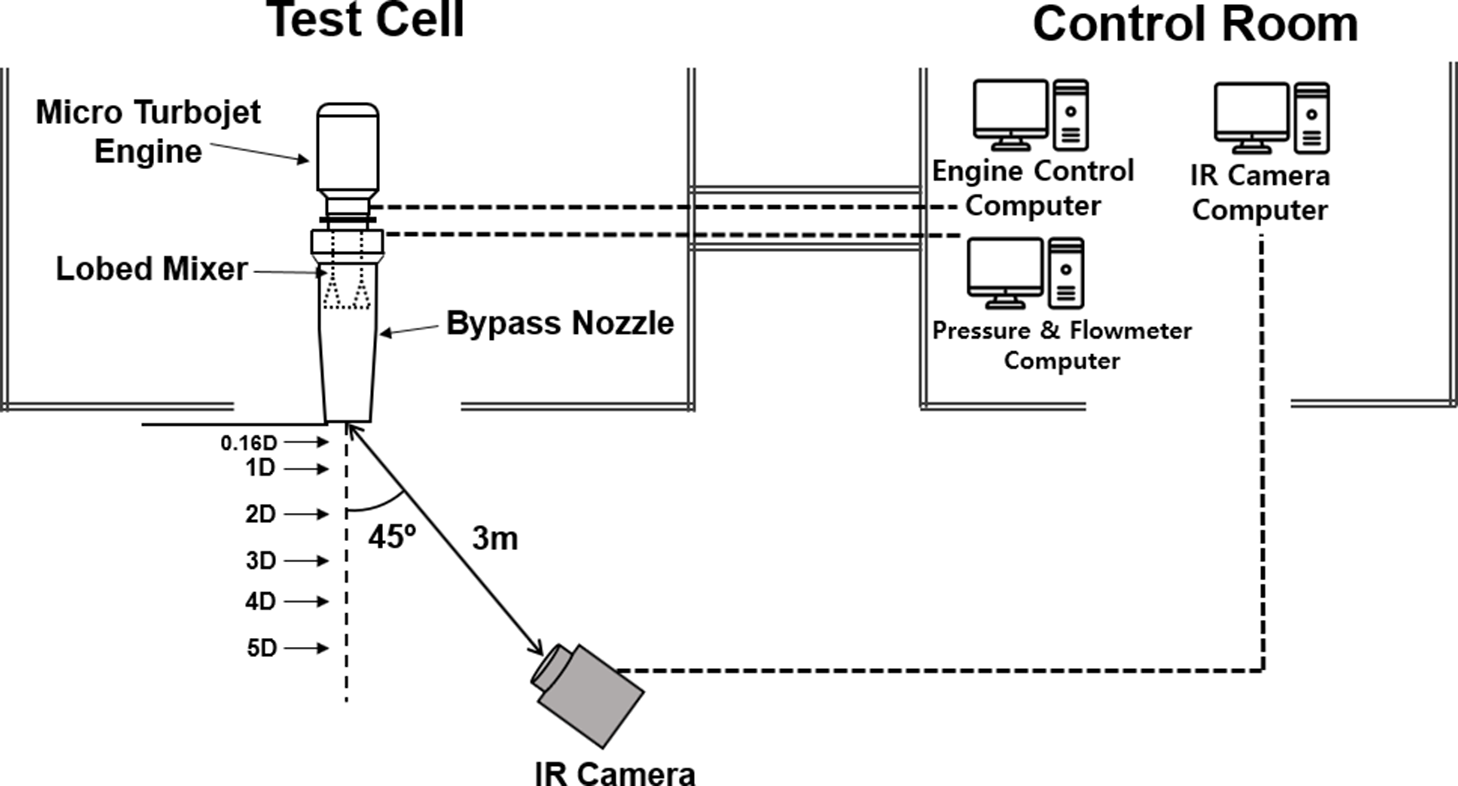
The infrared signal emitted from the engine is measured using an infrared thermography camera (Variocam hr head, JENOPTIK), and the layout of the infrared measurement system is presented in Fig. 7. The measuring temperature range of the device is −40 to 1,200°C, and the measuring wavelength range is 7.5 to 14
 ${\rm{\mu m}}$
. The infrared thermography camera is positioned 3
${\rm{\mu m}}$
. The infrared thermography camera is positioned 3
 ${\rm{m}}$
from the engine’s exhaust nozzle outlet at an angle of 45°, and the infrared signal of the exhaust gas is measured at positions 0.16D (15mm), 1D (92
${\rm{m}}$
from the engine’s exhaust nozzle outlet at an angle of 45°, and the infrared signal of the exhaust gas is measured at positions 0.16D (15mm), 1D (92
 ${\rm{mm}}$
), 2D (184mm), 3D (276mm), 4D (368mm) and 5D (460mm), respectively, from the exhaust nozzle outlet.
${\rm{mm}}$
), 2D (184mm), 3D (276mm), 4D (368mm) and 5D (460mm), respectively, from the exhaust nozzle outlet.

Figure 7. Layout of infrared measurement system.
The exhaust gas temperature of the engine is measured using an X–Y Traverse temperature measurement system. The X–Y Traverse temperature measurement system is composed of thermocouples, step motors, data recording devices and aluminum profiles. The layout and picture of X–Y Traverse temperature measurement system are shown in Figs. 8 and 9, respectively. X–Y Traverse is designed to measure up to 320mm by installing 16 thermocouples at 20mm intervals to measure a wide range of temperatures, and it can move up to 400mm in the X-axis direction and 700mm in the Y-axis direction. The temperature is measured in real time using the NI-cRio 9075 with LabVIEW software, and a PCI card and a UMI-7764 device is connected to a computer to implement the thermocouple position movement through a step motor driver. In the exhaust gas temperature measurement, when the engine is 43,000rpm, thermocouples are positioned at the rear of the nozzle outlet, and the exhaust gas temperature before and after the supply of compressed air is measured. The temperature of the exhaust gas is measured at positions 0.16D, 1D, 2D, 3D, 4D and 5D, respectively, from the exhaust nozzle outlet. Interference occurred between traverse and bypass nozzle when moving thermocouple to the correct nozzle outlet position. So the position 15mm (0.16D) away from the nozzle exit, which is the closest position to the nozzle exit, is set as the nozzle outlet position.
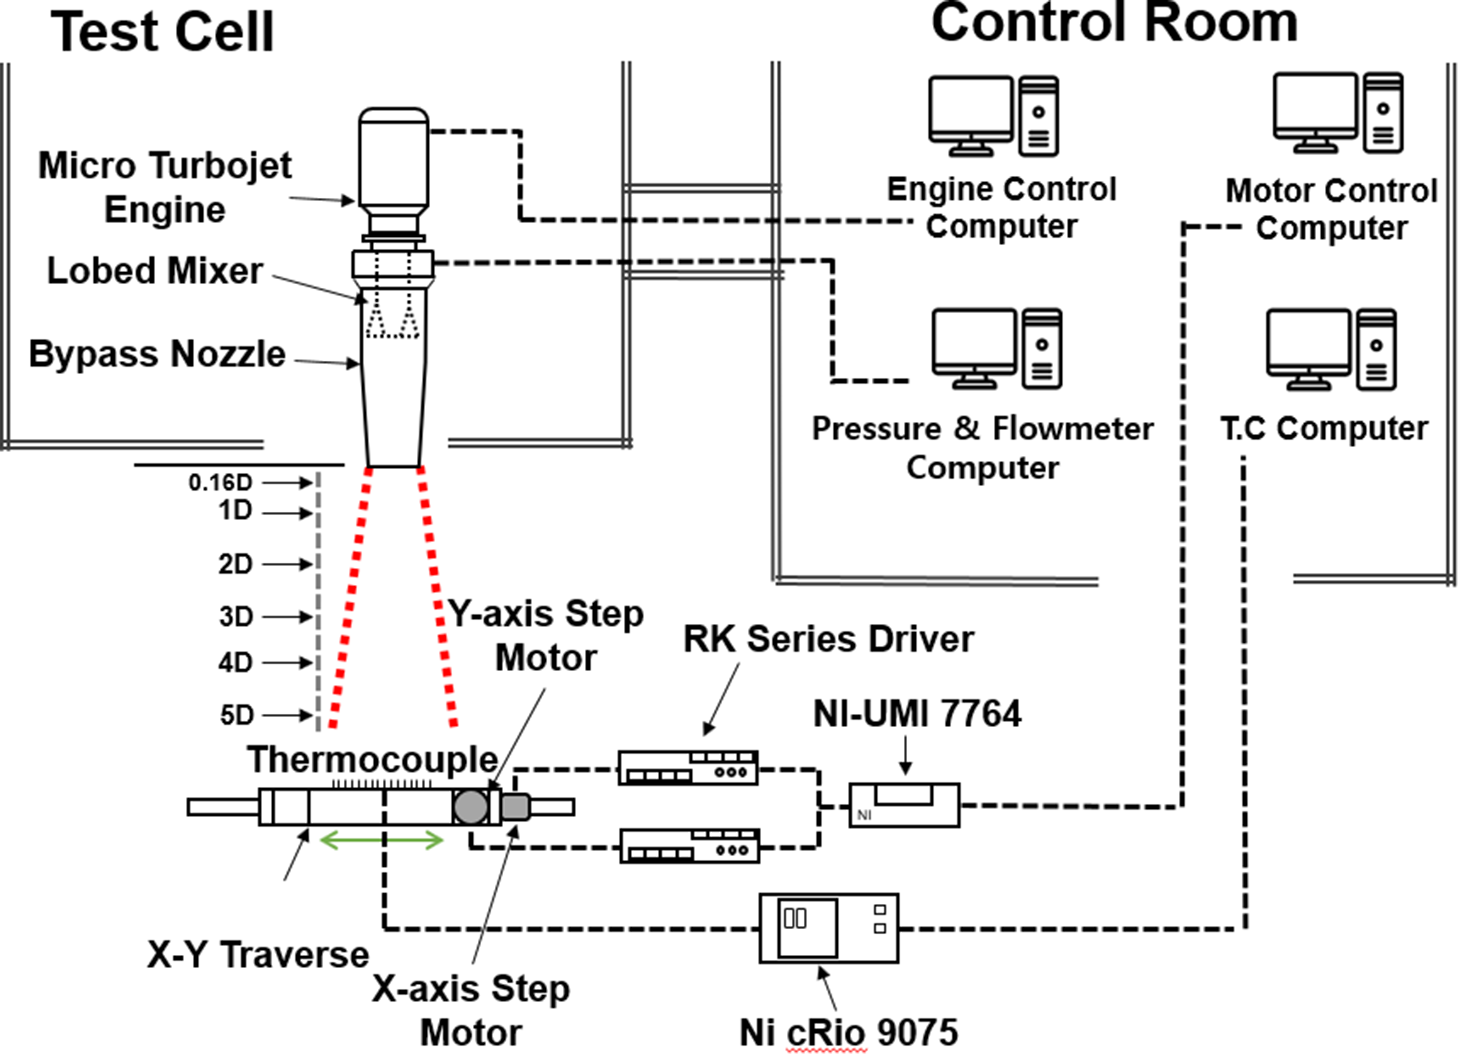
Figure 8. Layout of X–Y traverse temperature measurement system.
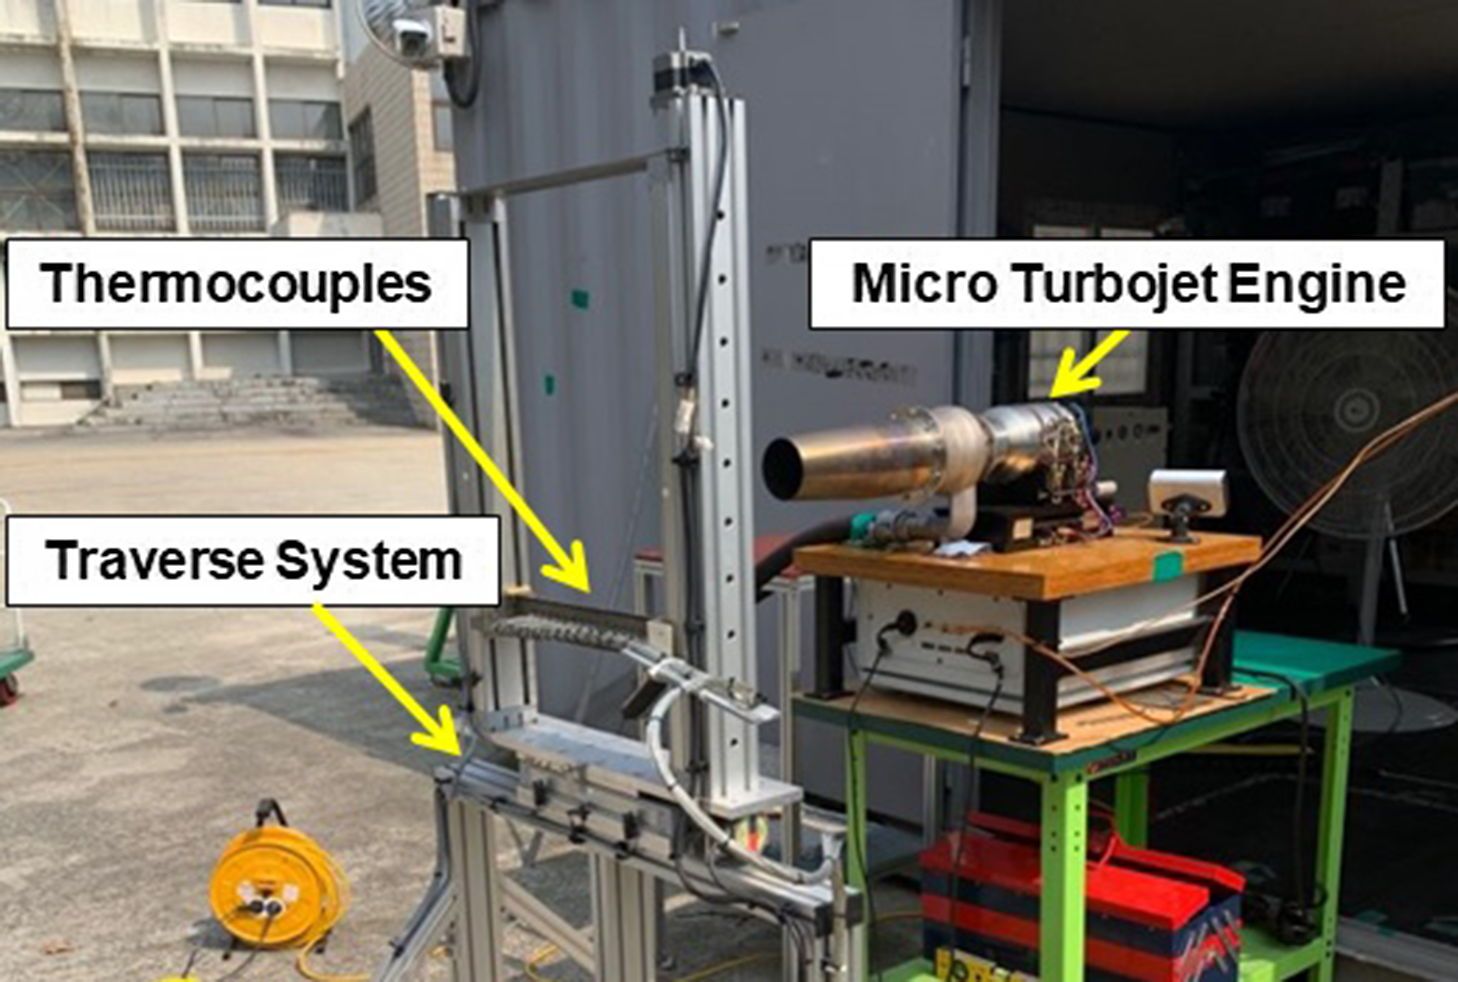
Figure 9. Picture of plume temperature measurement system.
Visualisation of engine exhaust flow is measured using a Schlieren visualisation system. Schlieren is a method of optically visualising heat, pressure, density distribution, etc., without any effect on the fluid by expressing the change in refractive index as a difference of contrast using light refraction in a transparent medium. The Schlieren visualisation system consists of two planar mirrors, a light source, a pinhole, and a Schlieren mirror. Pictures of a Schlieren visualisation system are shown in the Fig. 10. As a light source, an LED lamp of 10 W is used, the diameter of the schlieren mirror is 200mm, and the distance between the Schlieren mirrors is 6,000mm. Figure 11 show the layout of Schlieren visualisation system. In Fig. 11, the light from the light source is reflected through a flat mirror, reaches the Schlieren mirror, and is made of parallel light through the Schlieren mirror and passes through the test section. When the light is reflected from the Schlieren mirror and projected on the screen, the flow information can be imaged to see the flow field.
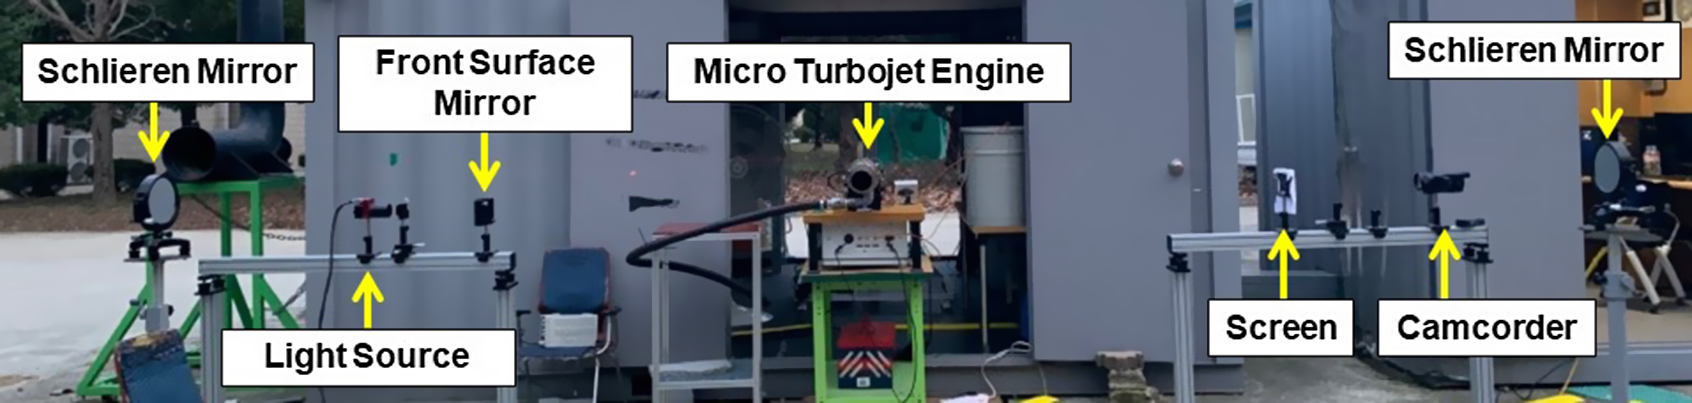
Figure 10. Picture of Schlieren visualisation system.
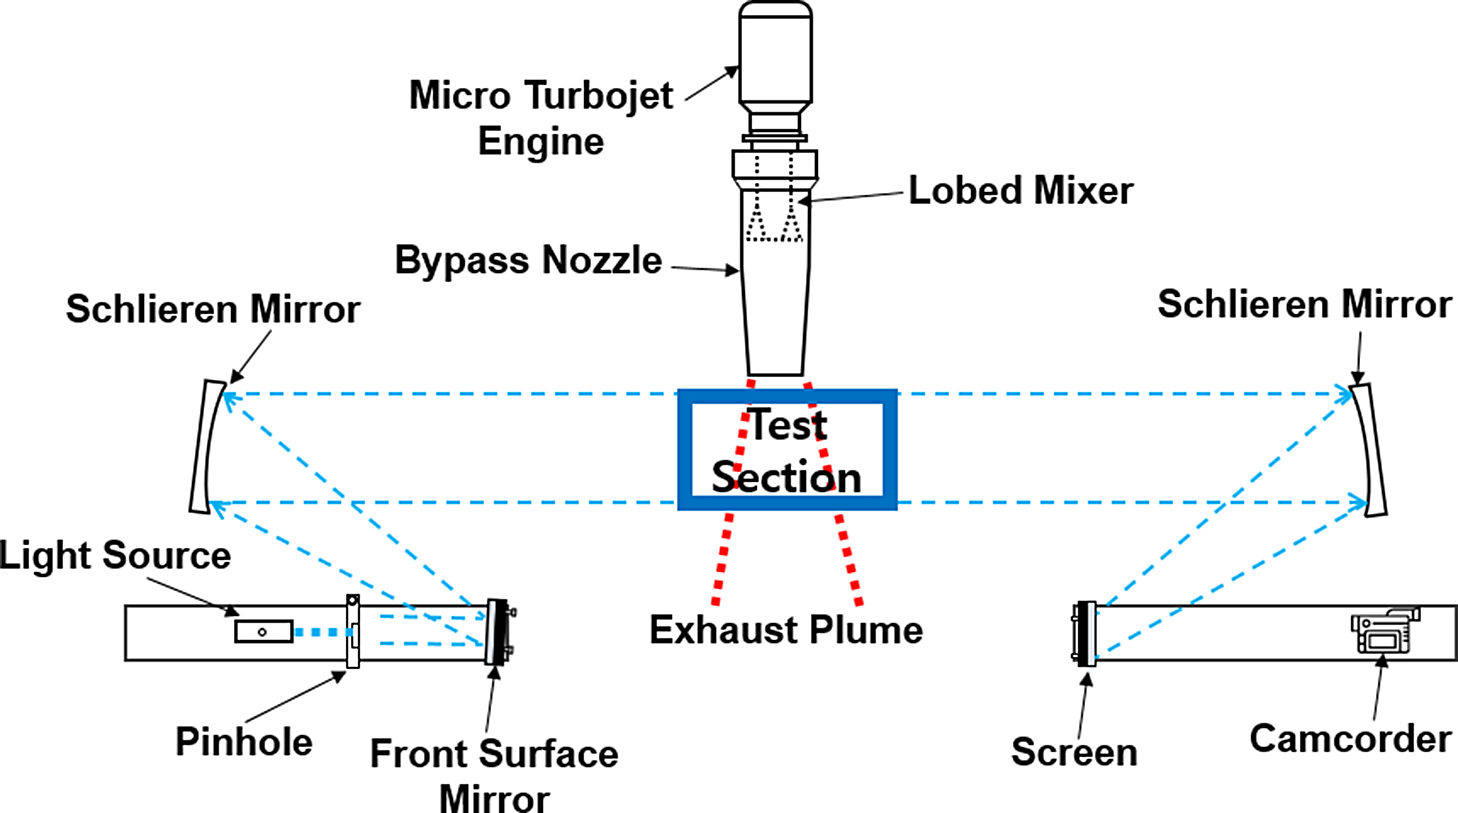
Figure 11. Layout of Schlieren visualisation system.
3.0 RESULTS AND DISCUSSION
3.1 Infrared signal
The infrared thermography image of exhaust gas according to the bypass ratio is presented in Fig. 12. It can be clearly seen that as the bypass ratio increases, the length of the core plume at the centre of the nozzle is shortened. In addition, the infrared signal decreases as the distance from the nozzle increases. Joo(Reference Joo15) built the same micro-turbojet engine and experimental equipment as in this study and conducted infrared signal measurement studies according to the bypass ratio for a simple cone-shaped nozzle without a lobed mixer. Referring to the results of Joo, the reduction rate of infrared signal by distance for the shape of the cone nozzle and lobed mixer is presented in the Fig. 13. The infrared signal reduction rate is expressed as a percentage of the irradiance signal of the flow with a mixture of core and bypass air to irradiance signal of core flow only and is shown in the Equation (2). In both cases, a larger infrared signal reduction effect is seen as the bypass ratio increases, but the infrared signal reduction rate for the same bypass ratio is much more effective in the lobed mixer than the cone nozzle. In the case of bypass ratio 1.4 with a lobed mixer, the infrared signal reduction rate at the nozzle exit (0.16D) reached approximately 46%. However, without a lobed mixer, it has a relatively low value of approximately 16%. Therefore, with a lobed mixer, the infrared signal can be reduced by up to three times compared to the cone nozzle. The temperature distribution of exhaust gases in the following section shows the mixing effect of the lobed mixer.
 \begin{equation}{\rm{Infrared\;reduction\;rate}}\left( {\rm{\% }} \right) = \frac{{{\rm{Mixed\;Flow\;Irradiance\;Signal}}}}{{{\rm{Core\;Flow\;Irradiance\;Signal\;}}}} \times 100\end{equation}
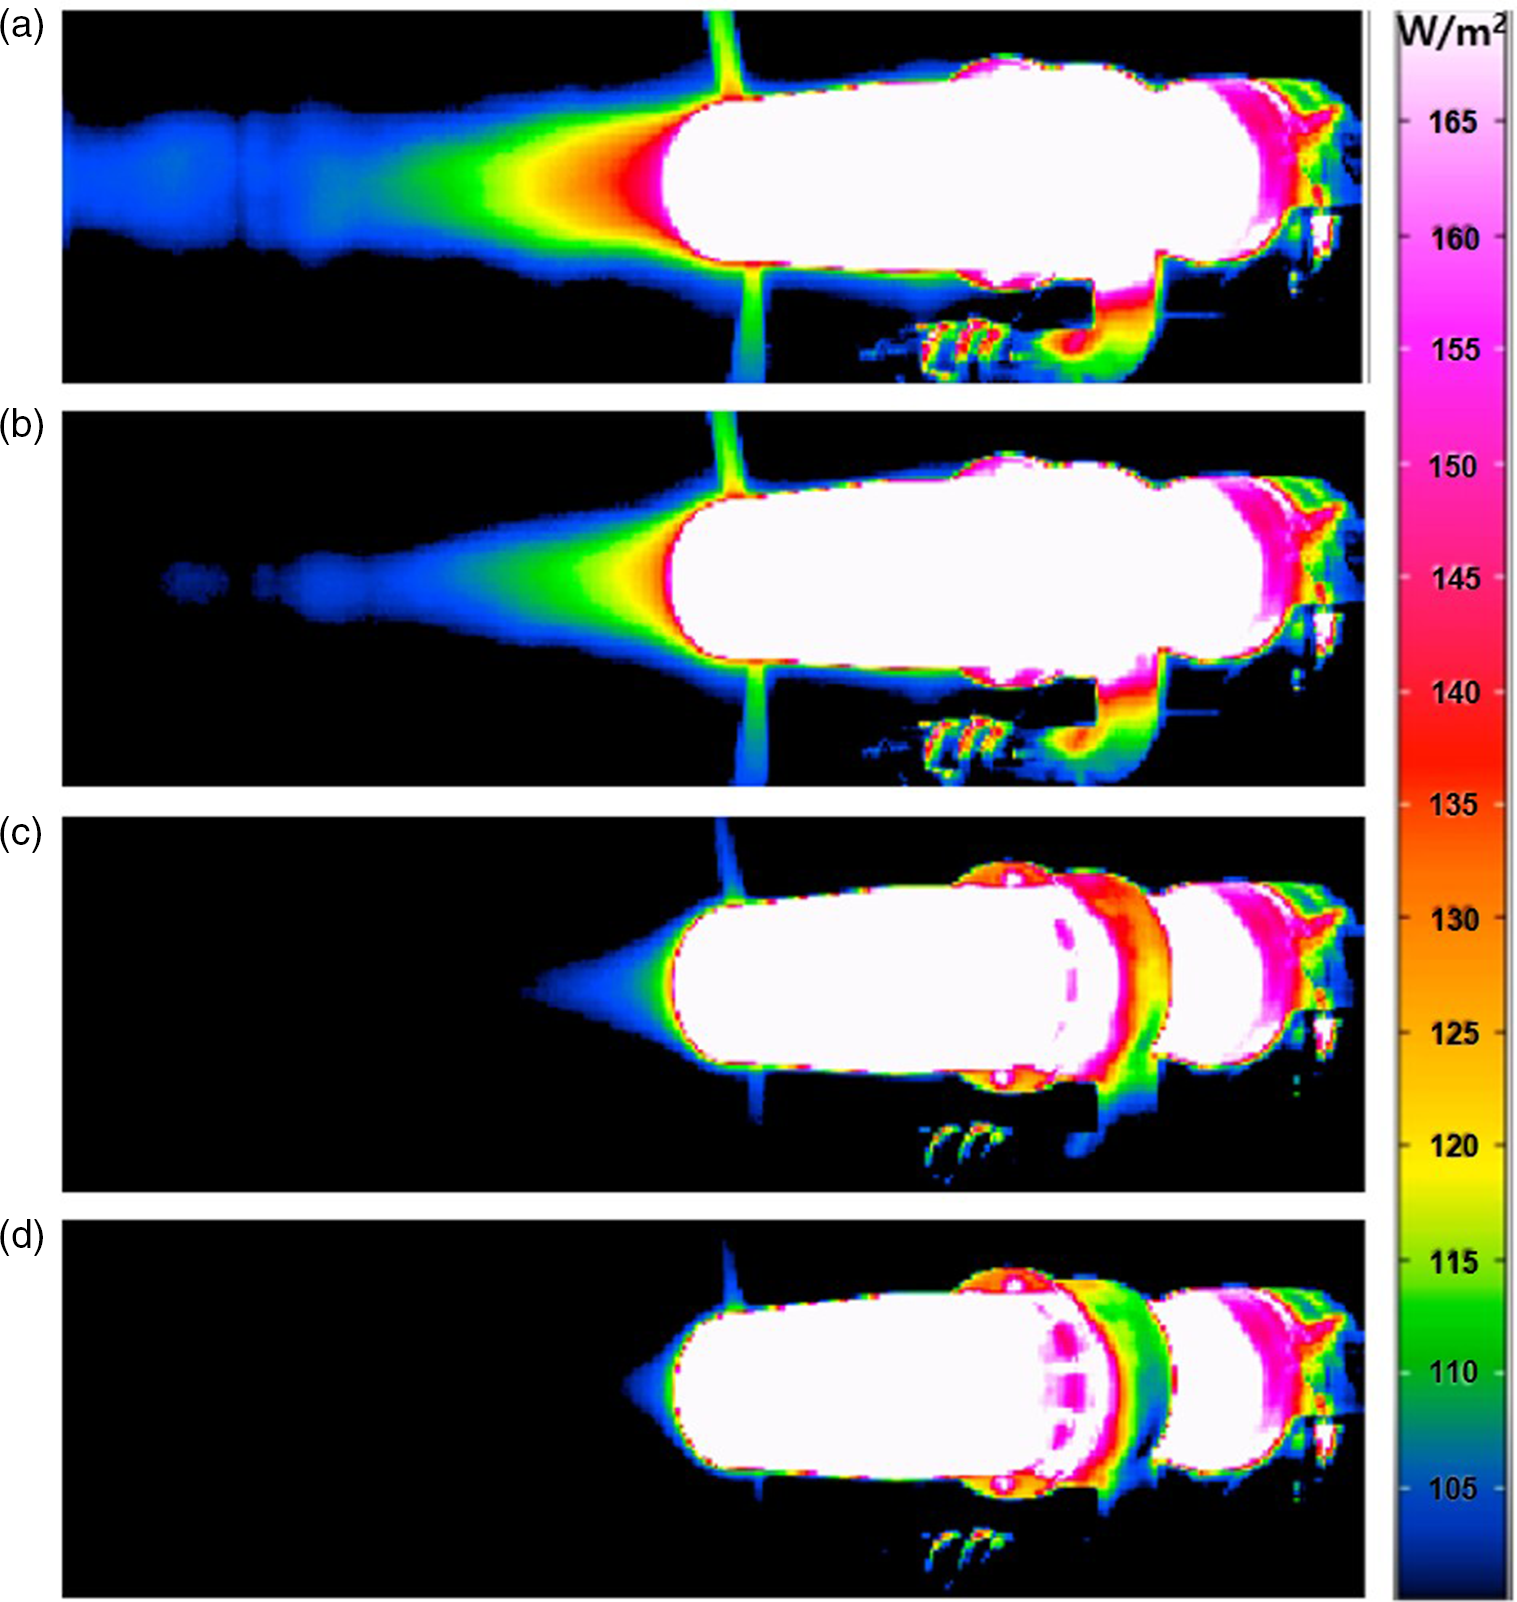
Figure 12. IR signature with bypass ratio: (a) bypass 0.0 (b) bypass 0.5 (c) bypass 1.0 (d) bypass 1.4.
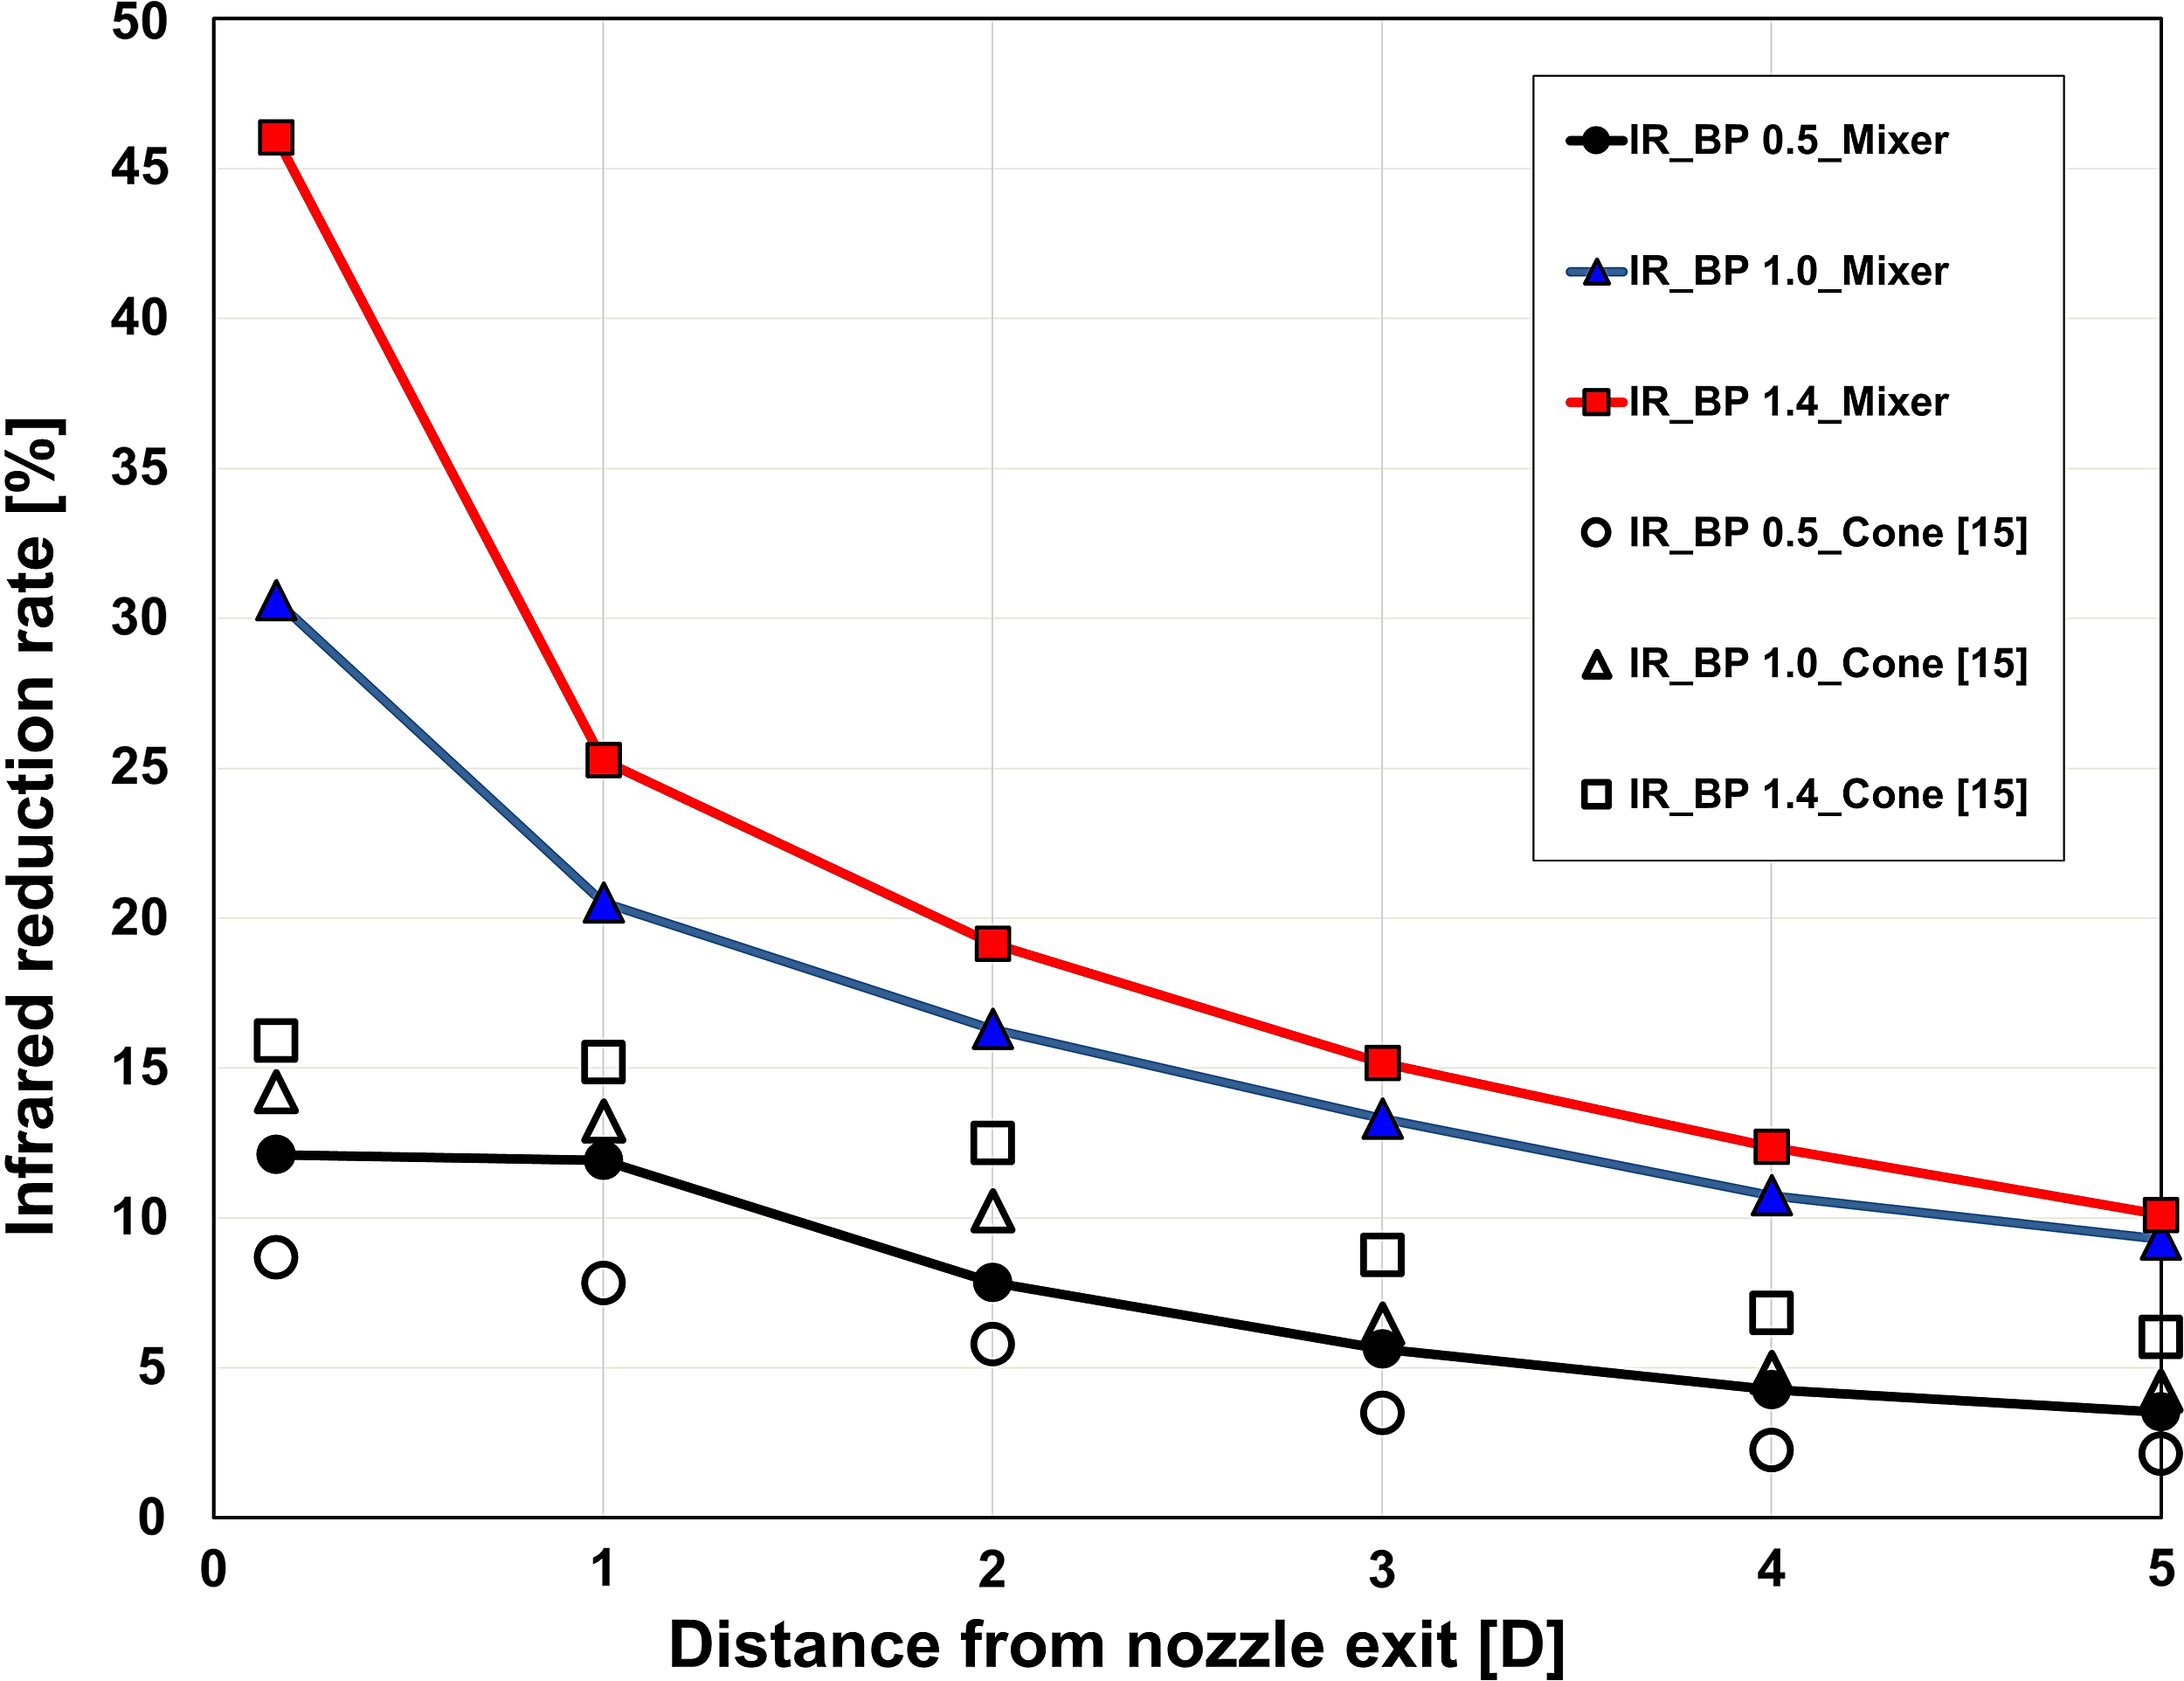
Figure 13. IR reduction rate with distance.
3.2 Plume gas temperature distribution
Since the infrared signal of the aircraft has a direct correlation with the exhaust gas temperature, it is important to check the temperature distribution of the exhaust gas according to the bypass ratio. The two-dimensional temperature distribution for each distance according to the bypass ratio measured through experiments is presented in Fig. 14. For easy understanding, a two-dimensional image was generated assuming axis symmetry. In the case of a bypass ratio of 0.0, which corresponds to core flow only, a temperature of 300°C or more is distributed in the centre of the nozzle from the nozzle to a distance of 2D. As the bypass ratio increases, the temperature distribution in the centre of the nozzle gradually decreases. In the case of the bypass ratio 1.4, the temperature distribution at the centre of the nozzle at 0.16D is around 250°C. This can be clearly seen in the 3D temperature distribution according to the bypass ratio in Fig. 15. As the bypass ratio increases, the length of the hot gas over 300°C gradually decreases, and at the bypass ratio 1.4, there is no hot gas over 300°C. Therefore, as the bypass ratio increases, the temperature of the exhaust gas decreases. From this result, the temperature of the exhaust gas decreases as the bypass ratio increases.
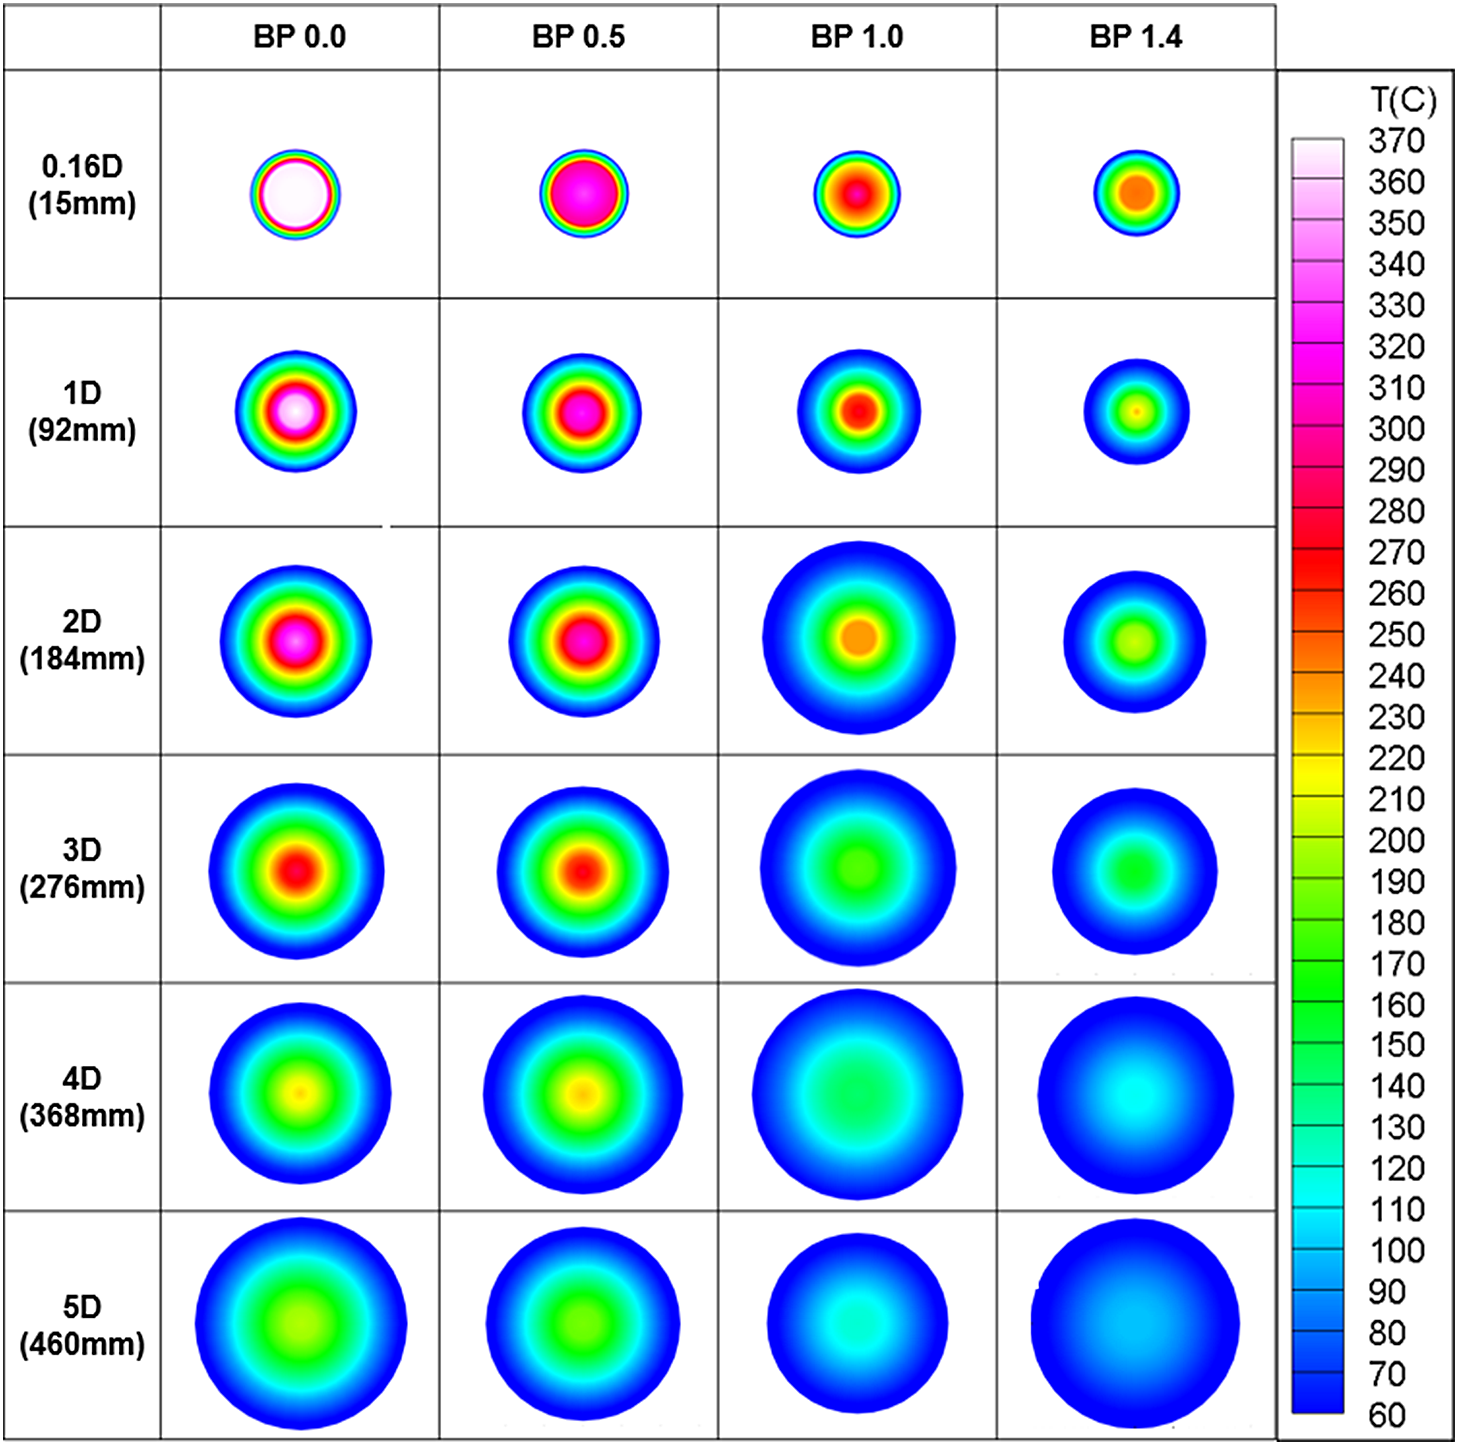
Figure 14. 2D Temperature distribution with bypass ratio.
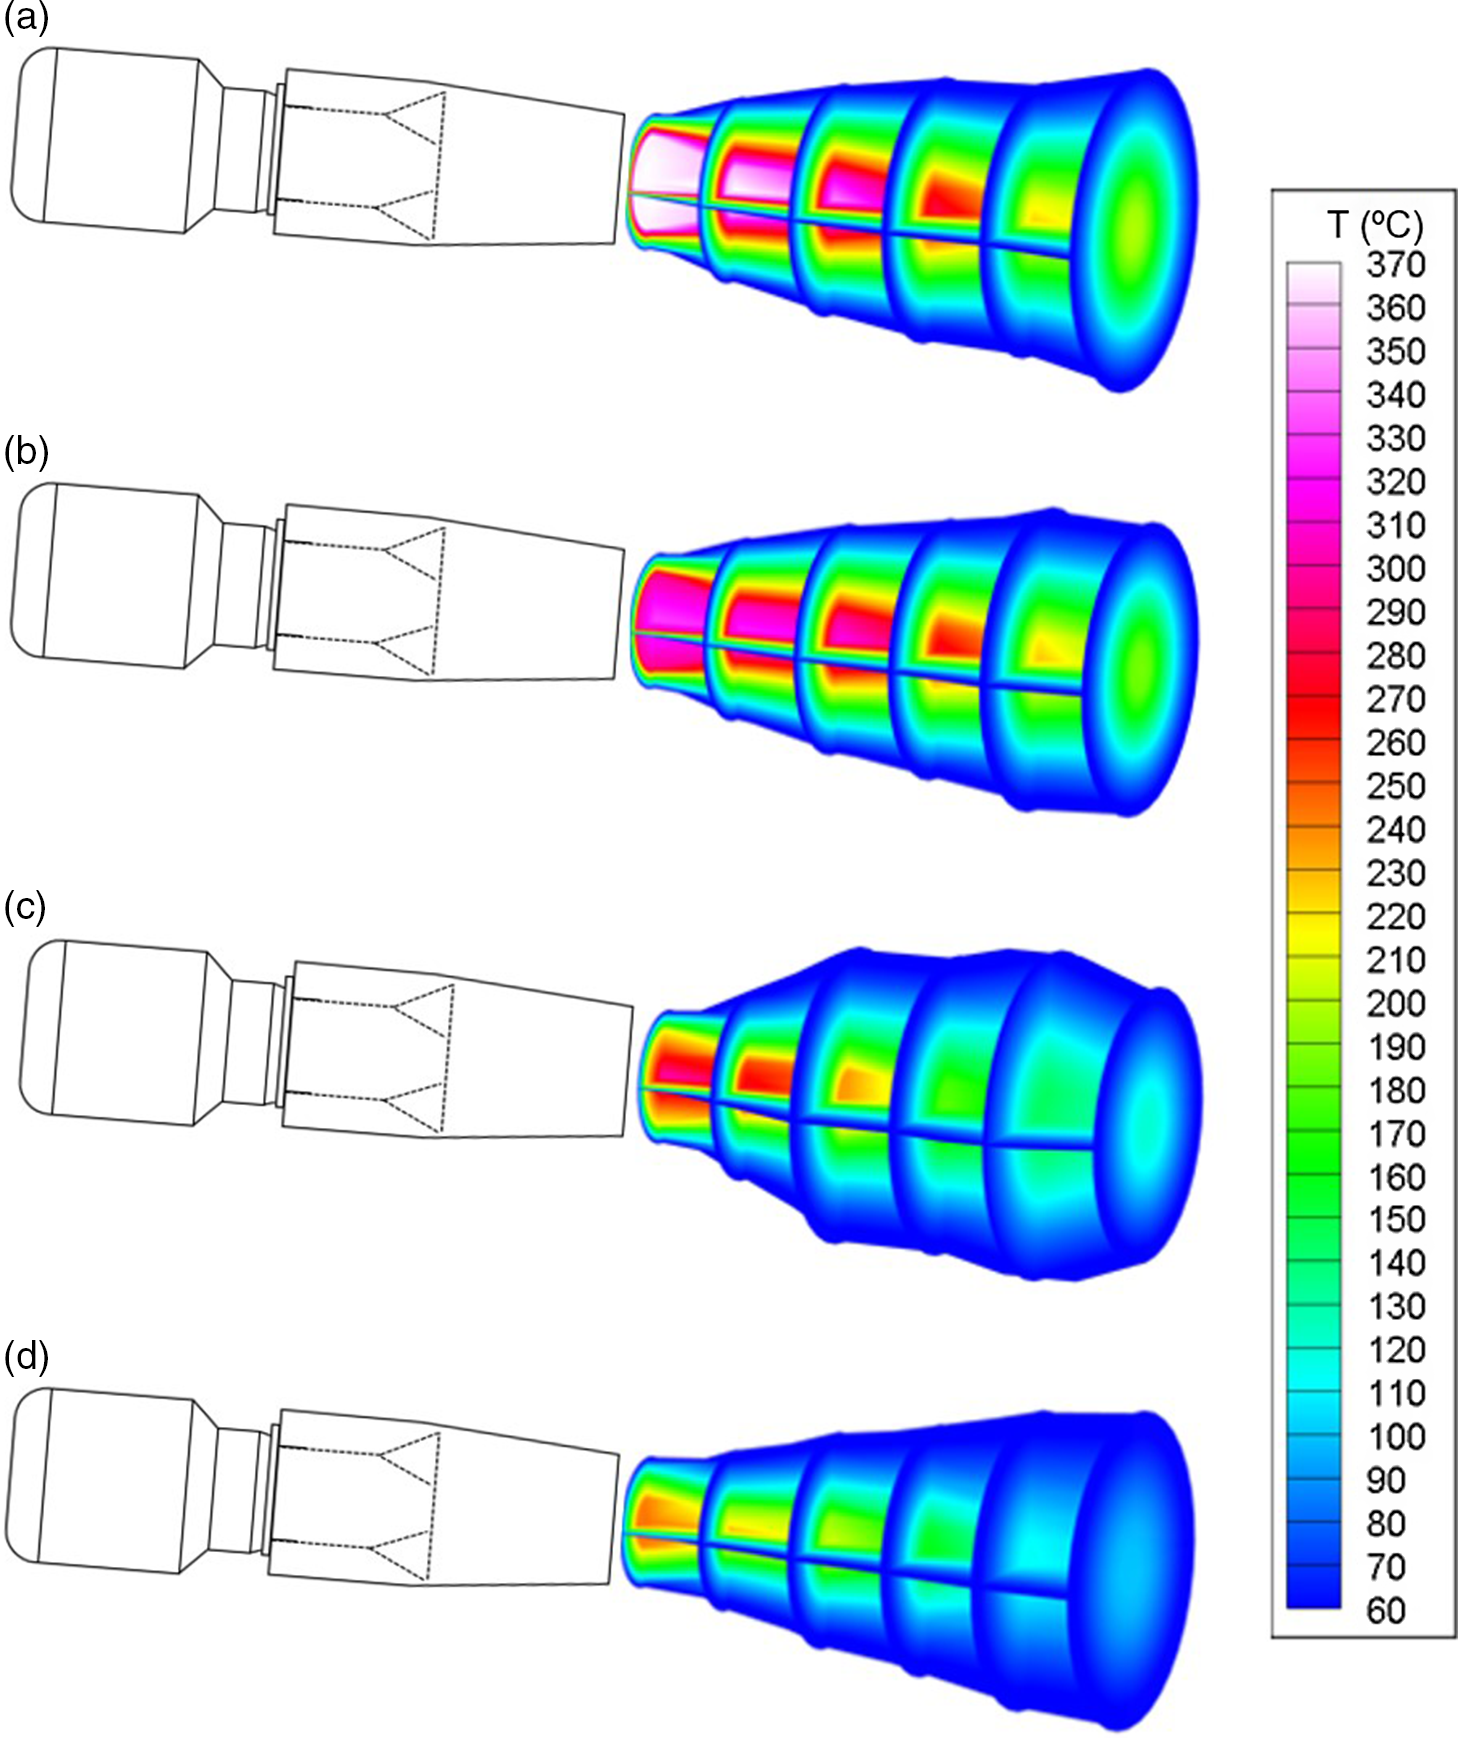
Figure 15. 3D Temperature distribution with bypass ratio: (a) bypass 0.0 (b) bypass 0.5 (c) bypass 1.0 (d) bypass 1.4.
The results of the exhaust gas temperature measurement at the exit of the exhaust nozzle according to the distance are presented in Figs. 16, 17, and 18. In the graph, the radial position 0 indicates the centre of the nozzle, and the dashed line in the graph shows the temperature after the engine reaches stable operation at 43,000rpm (bypass = 0.0), and the solid line shows the maximum air flow after supplying compressed air. The figures show that when outside air is supplied, the temperature distribution is slightly skewed without symmetry. It is thought that large amounts of air supplied from the outside are moved vertically from the bottom side of the engine and the vertical velocity components caused some imbalance. In the case of the bypass ratio of 0.5, in Fig. 16, after the supply of compressed air, the exhaust gas temperature at the 2D position is reduced by about 31.5°C, and at 4D by about 8°C. The exhaust gas temperature of the bypass ratio 1.0 is shown in Fig. 16. The exhaust gas temperature decreased by about 109.1°C at a position 2D away from the nozzle exit and decreased by about 86.7°C at 4D. The exhaust gas temperature of the bypass ratio 1.4 is shown in Fig. 18. The exhaust gas temperature decreased by about 140°C at a position 2D and decreased by about 109.7°C at 4D. Through these results, it is seen that as the bypass ratio increases, the temperature reduction in the centre of the nozzle increases, and when the bypass ratio is 1.0 or higher, the temperature of the exhaust gas is greatly reduced even at a close distance from the nozzle exit.
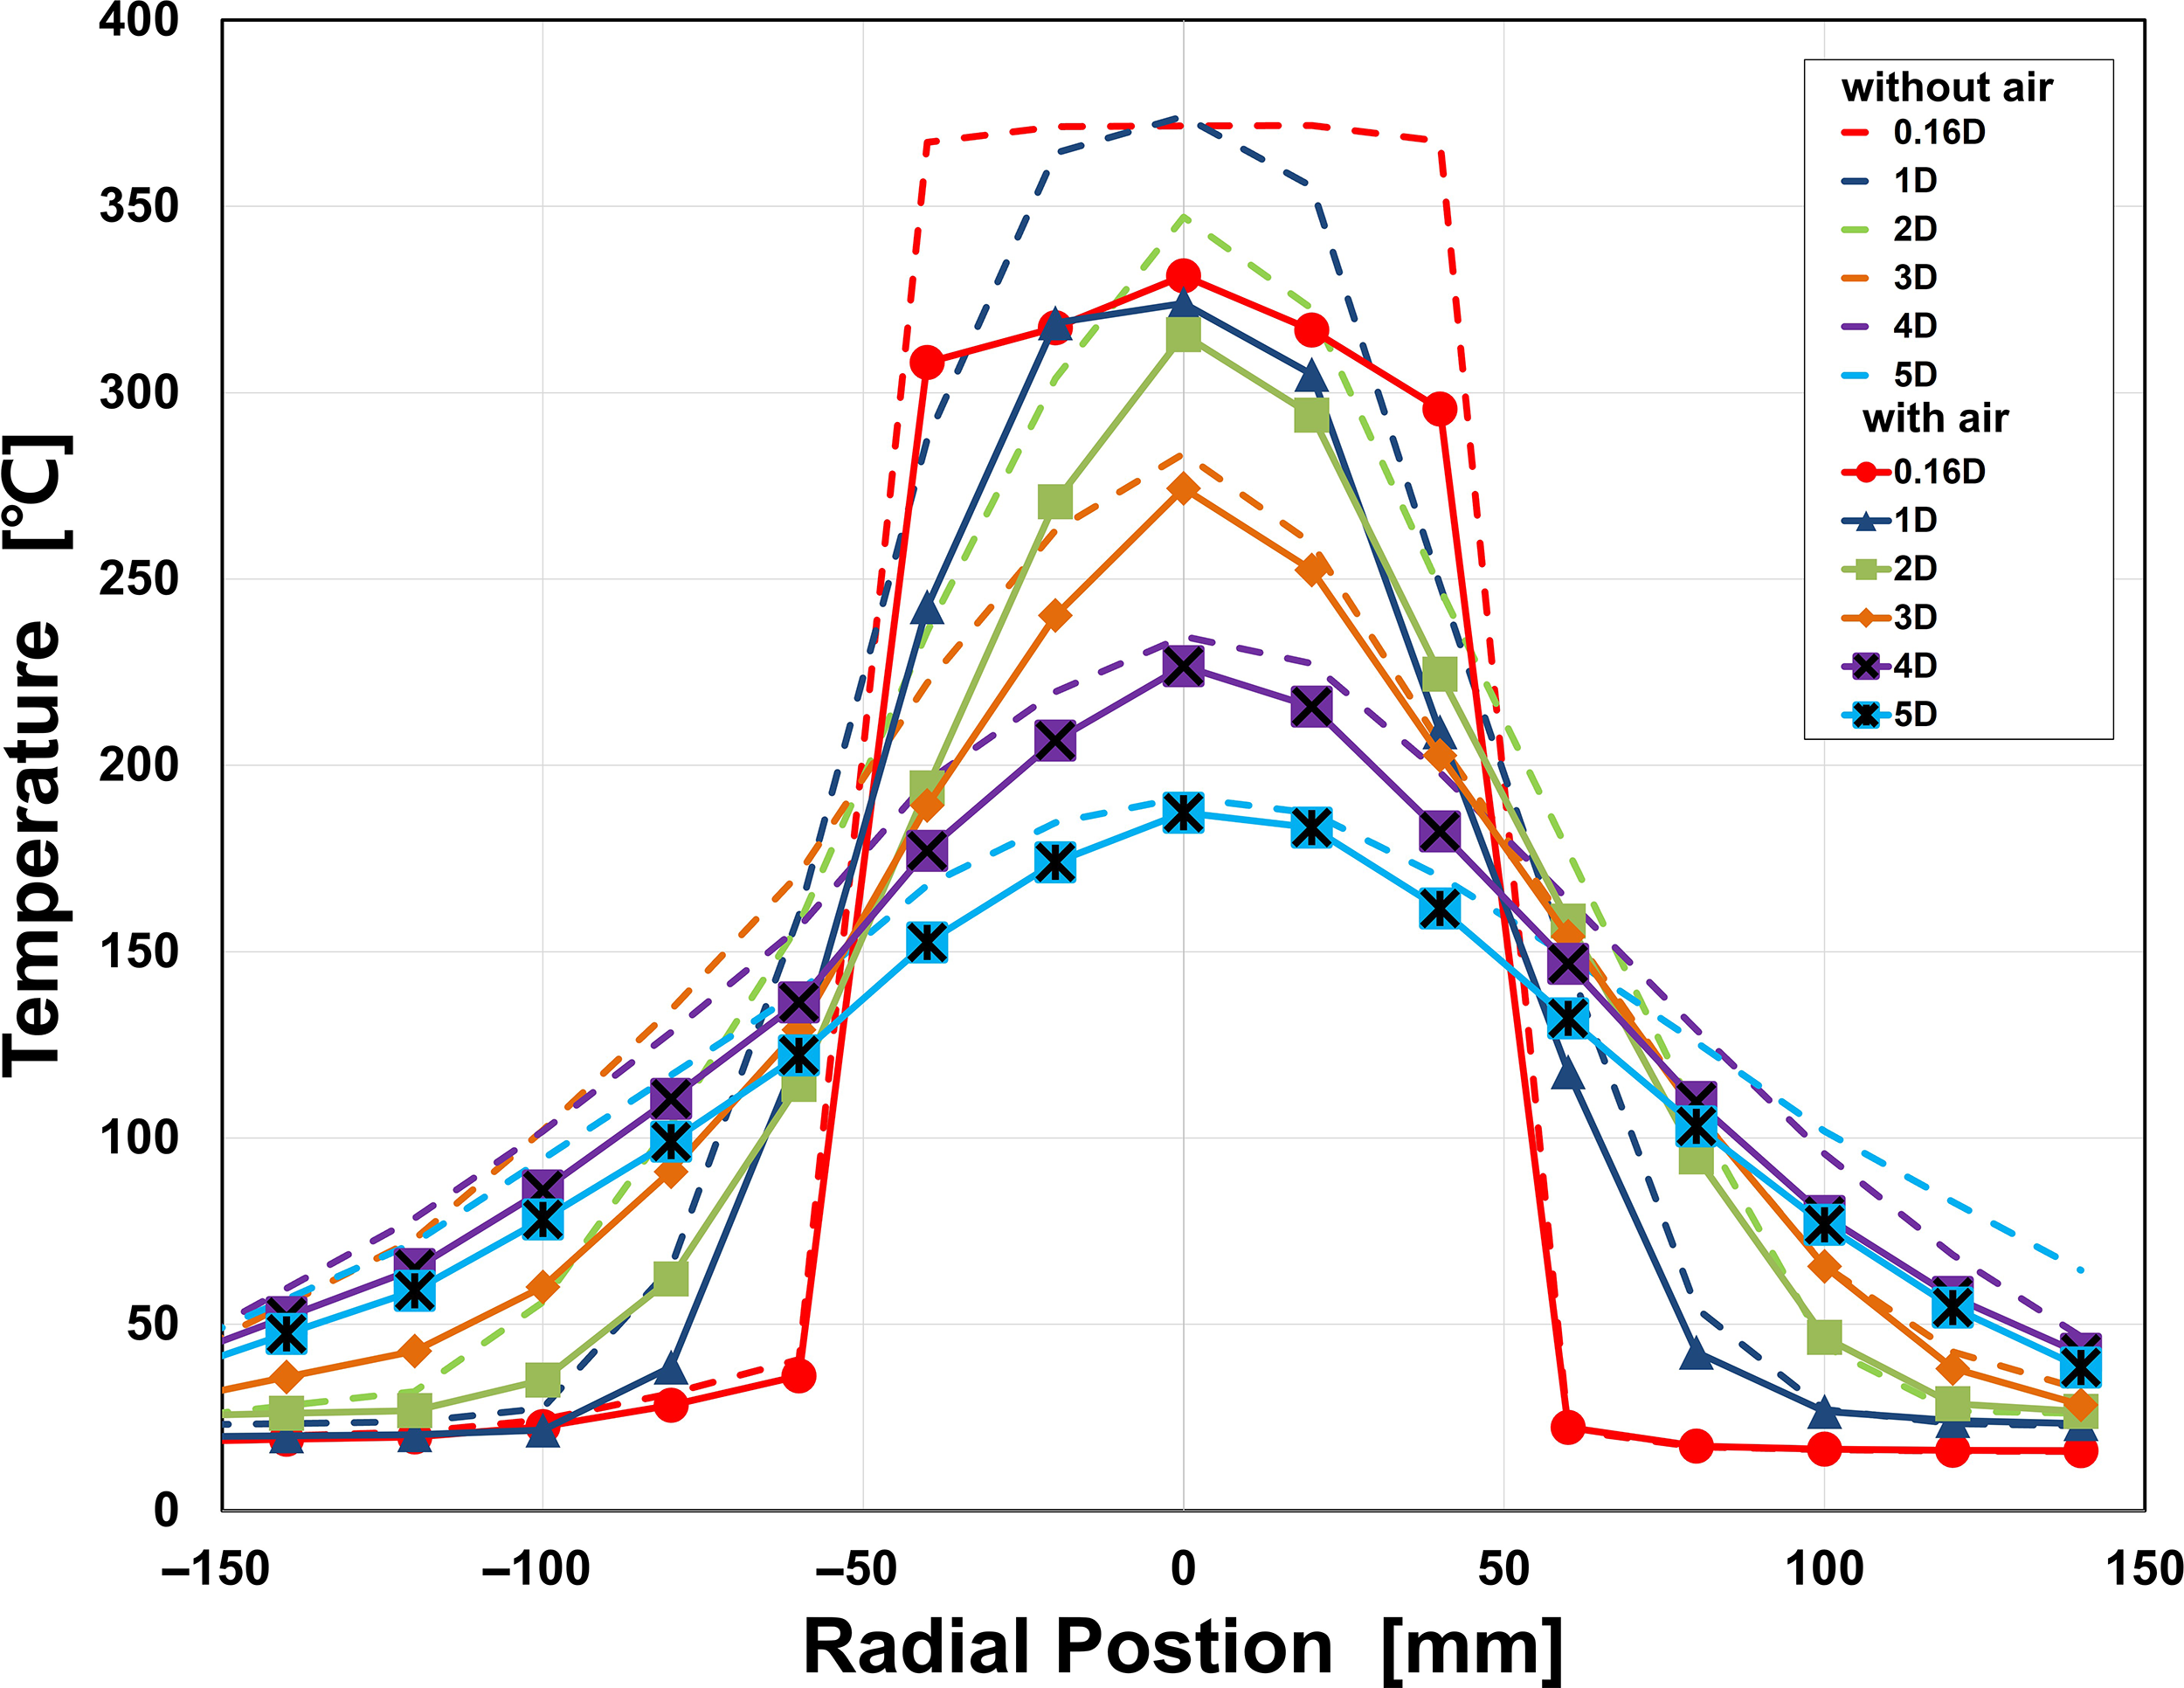
Figure 16. Plume temperature distribution (bypass 0.5).
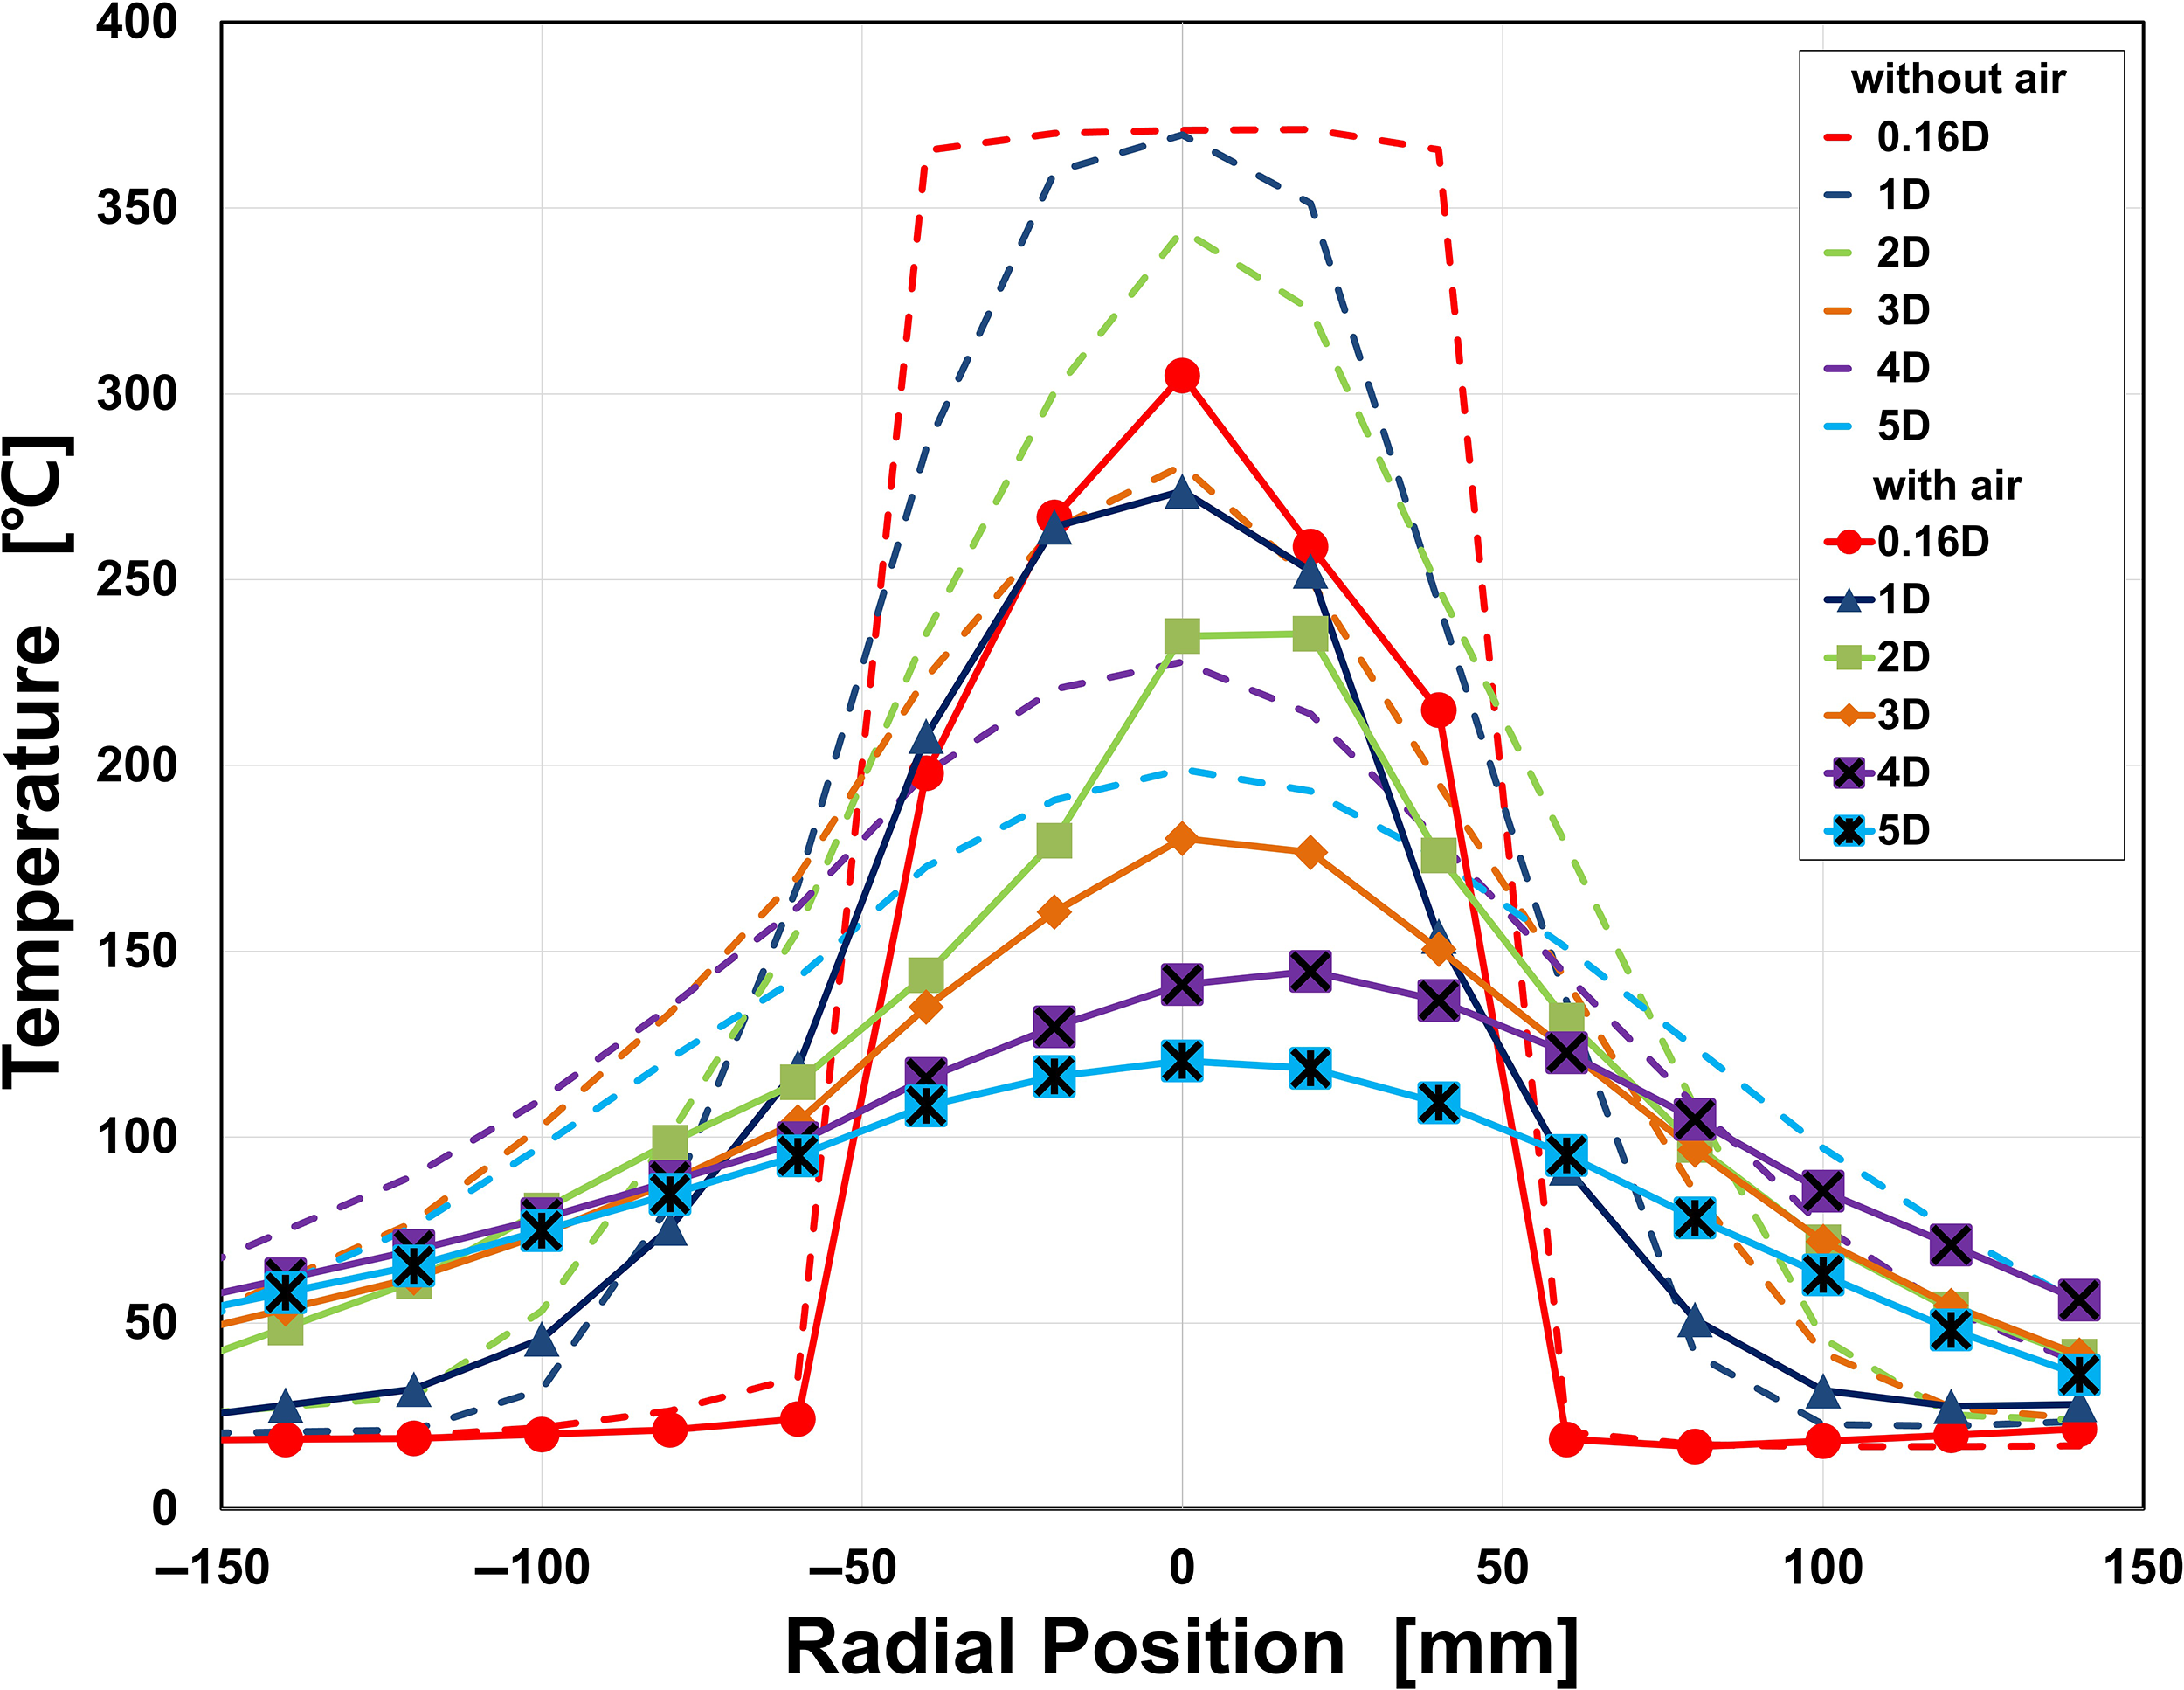
Figure 17. Plume temperature distribution (bypass 1.0).
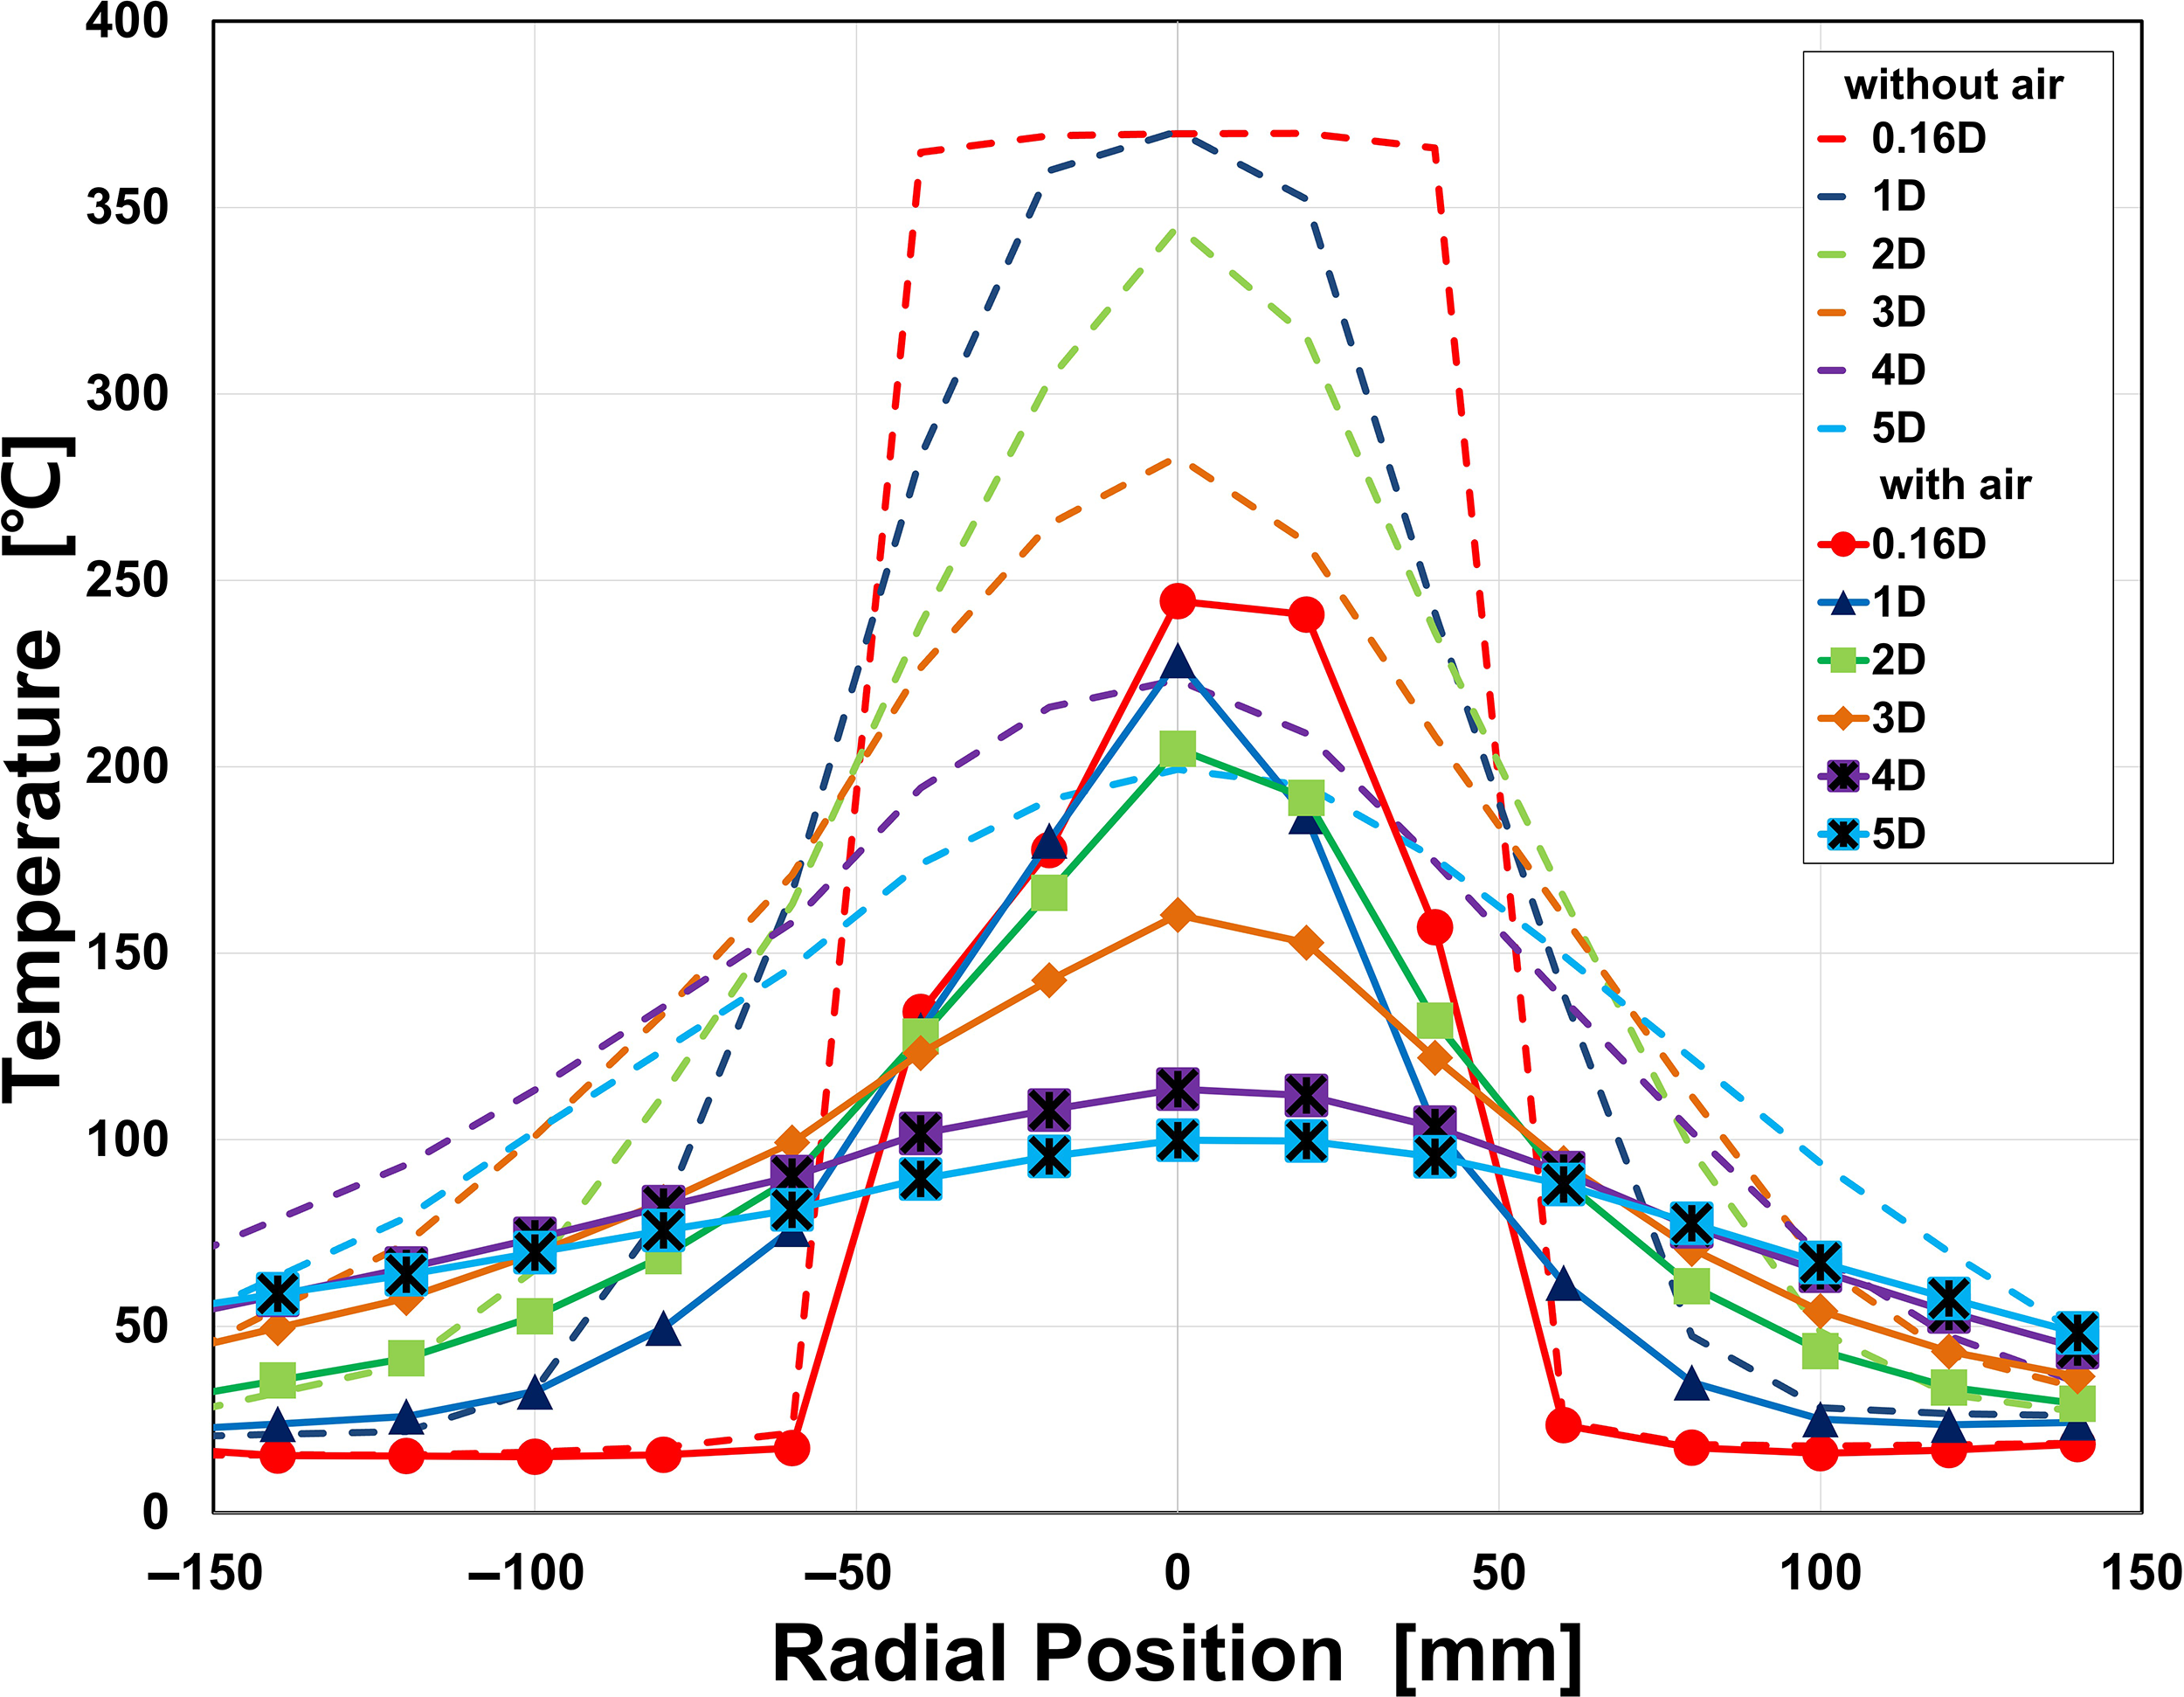
Figure 18. Plume temperature distribution (bypass 1.4).
The exhaust gas temperature according to the distance is compared with the results for the cone nozzle without a lobed mixer by referring to the research results of Joo et al.(Reference Joo, Jo, Choi and Jo4), and the results are presented in Fig. 19. The temperature reduction rate is expressed as in Equation (3).
 \begin{align}\mathrm{Temperature\ reduction\ rate}\ (\%)=\frac{{{\rm{Core\;Flow\;Temperature}} - {\rm{Mixed\;Flow\;Temperature}}}}{{{\rm{Core\;Flow\;Temperature\;}}}} \times 100\nonumber\\
\end{align}
\begin{align}\mathrm{Temperature\ reduction\ rate}\ (\%)=\frac{{{\rm{Core\;Flow\;Temperature}} - {\rm{Mixed\;Flow\;Temperature}}}}{{{\rm{Core\;Flow\;Temperature\;}}}} \times 100\nonumber\\
\end{align}
In both cases, as the bypass ratio increases, the overall temperature reduction rate with distance increases. The temperature reduction rate in the lobed mixer is shown to be greater than without lobed mixer. For bypass ratio of 1.4 and 0.16D locations, the temperature reduction rate is 33.9% with the lobed mixer and 15% without lobed mixer. For bypass ratio 1.4 with a lobed mixer, the temperature reduction rate gradually increases as the distance from the nozzle outlet increases, reaching up to 50% in the 5D position. It is considered that the lobed mixer enhances the mixing intensity of the high-temperature core flow and the compressed air. Because of that, the core flow and bypass flow can be more effectively mixed far from the nozzle exit.
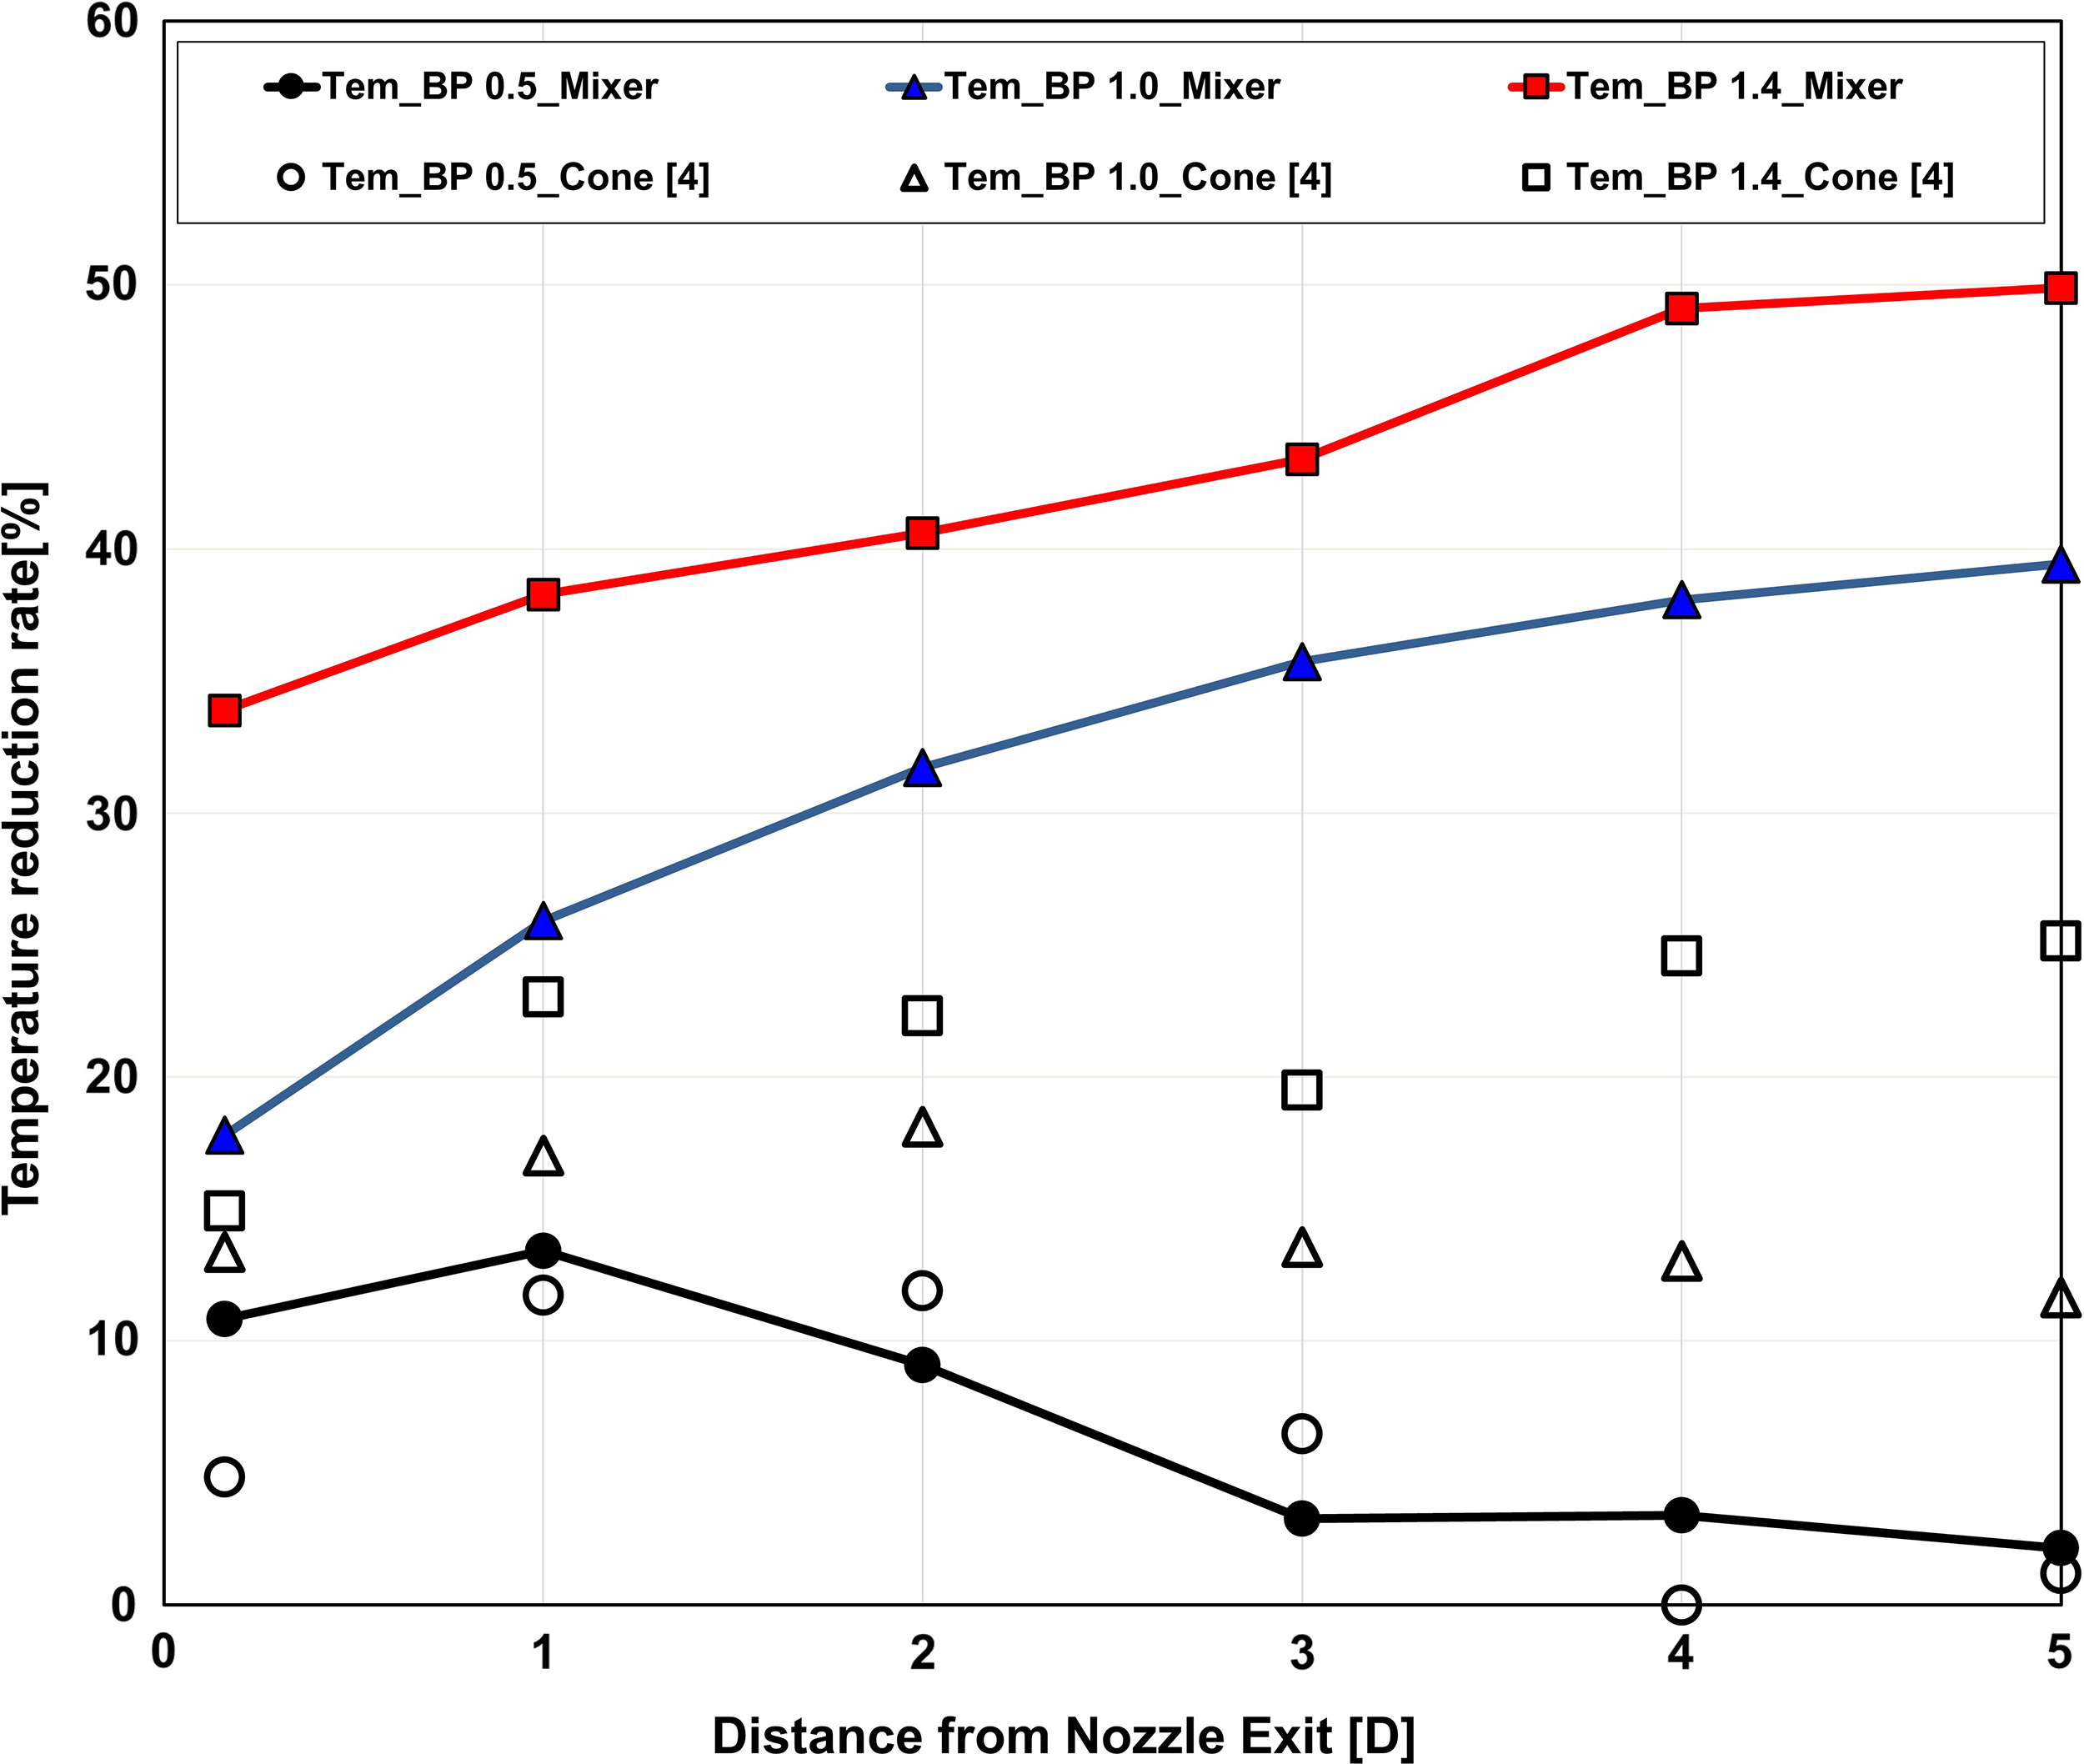
Figure 19. Temperature reduction rate with distance from nozzle exit.
In order to understand the correlation between the exhaust gas temperature and the infrared signal reduction rate, the delta temperature and infrared signal reduction rate at 0.16D position from the centre of the nozzle outlet are shown in Fig. 20. The delta temperature is expressed as the temperature difference between the core gas only and the mixed flow, and the definition is given in Equation (4).
 \begin{equation}{\rm{Delta\;temperature}}\left( {^\circ {\rm{C}}} \right) ={\rm{Core\;Flow\;Temperature}} - {\rm{Mixed\;Flow\;Temperature}}\end{equation}
It can be seen from the results that the infrared signal reduction rate increases as the delta temperature of the exhaust gas increases. In case of lobed mixer, as delta temperature increases from 40°C to 125°C with bypass ratio, the infrared reduction rate increases linearly from 12% to 46%. On the other hand, in the case of a cone without a lobed mixer, the delta temperature is relatively small, ranging from 18°C to 52°C, and the reduction rate of the infrared signal is only 9% to 16%. Therefore, in the case of a lobed mixer, the maximum gas temperature reduction by mixing is 2.4 times greater than without a lobed mixer, and the reduction rate of the infrared signal is approximately 2.9 times greater.
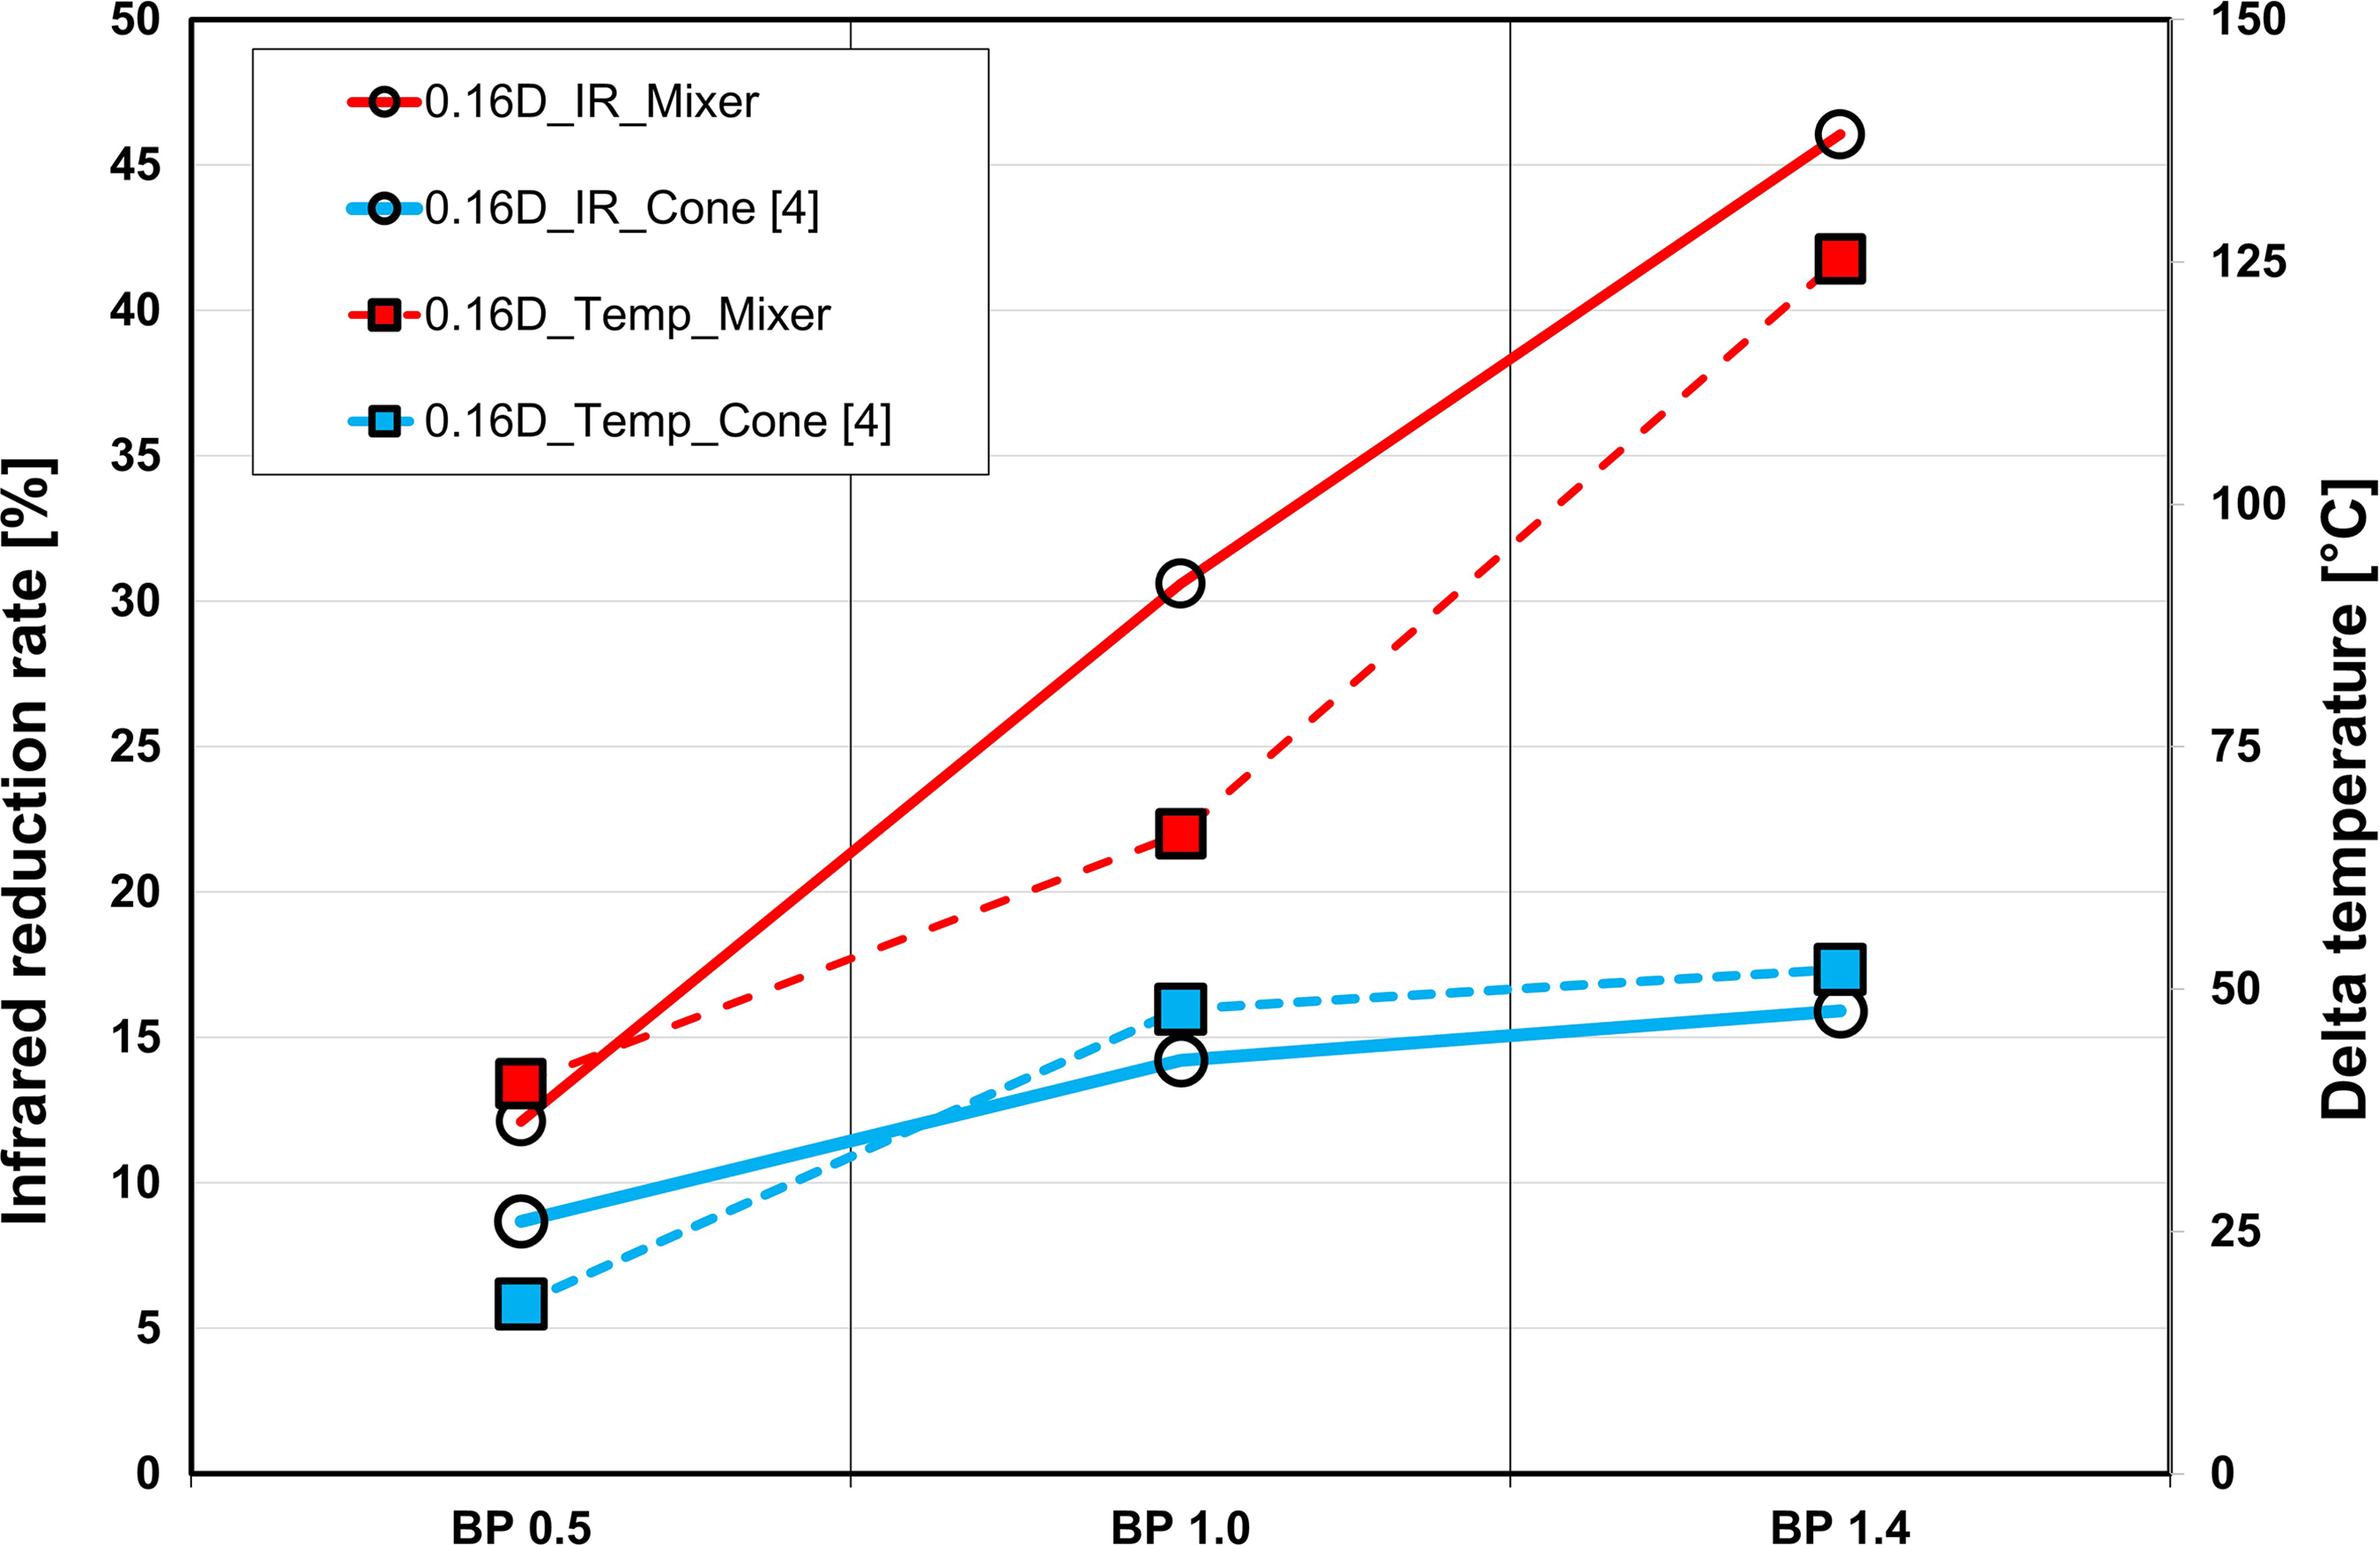
Figure 20. Infrared reduction rate and delta temperature with bypass ratio.
3.3 Schlieren visualisation
The image of the exhaust gas flow visualization according to the bypass ratio is shown in Fig. 21. At the bypass ratio of 0.0, the contrast is different due to the irregular change of the exhaust gas wake flow that occurs in the process of cooling the core flow at high temperature by mixing air in the atmosphere. This irregular flow change gradually decreases as the bypass ratio increases, and in the case of the bypass ratio 1.4, the flow of the nozzle downstream is uniform. It is understood that the high-temperature portion of the core flow and the high-pressure air are mixed well in the bypass nozzle to form a uniform flow.
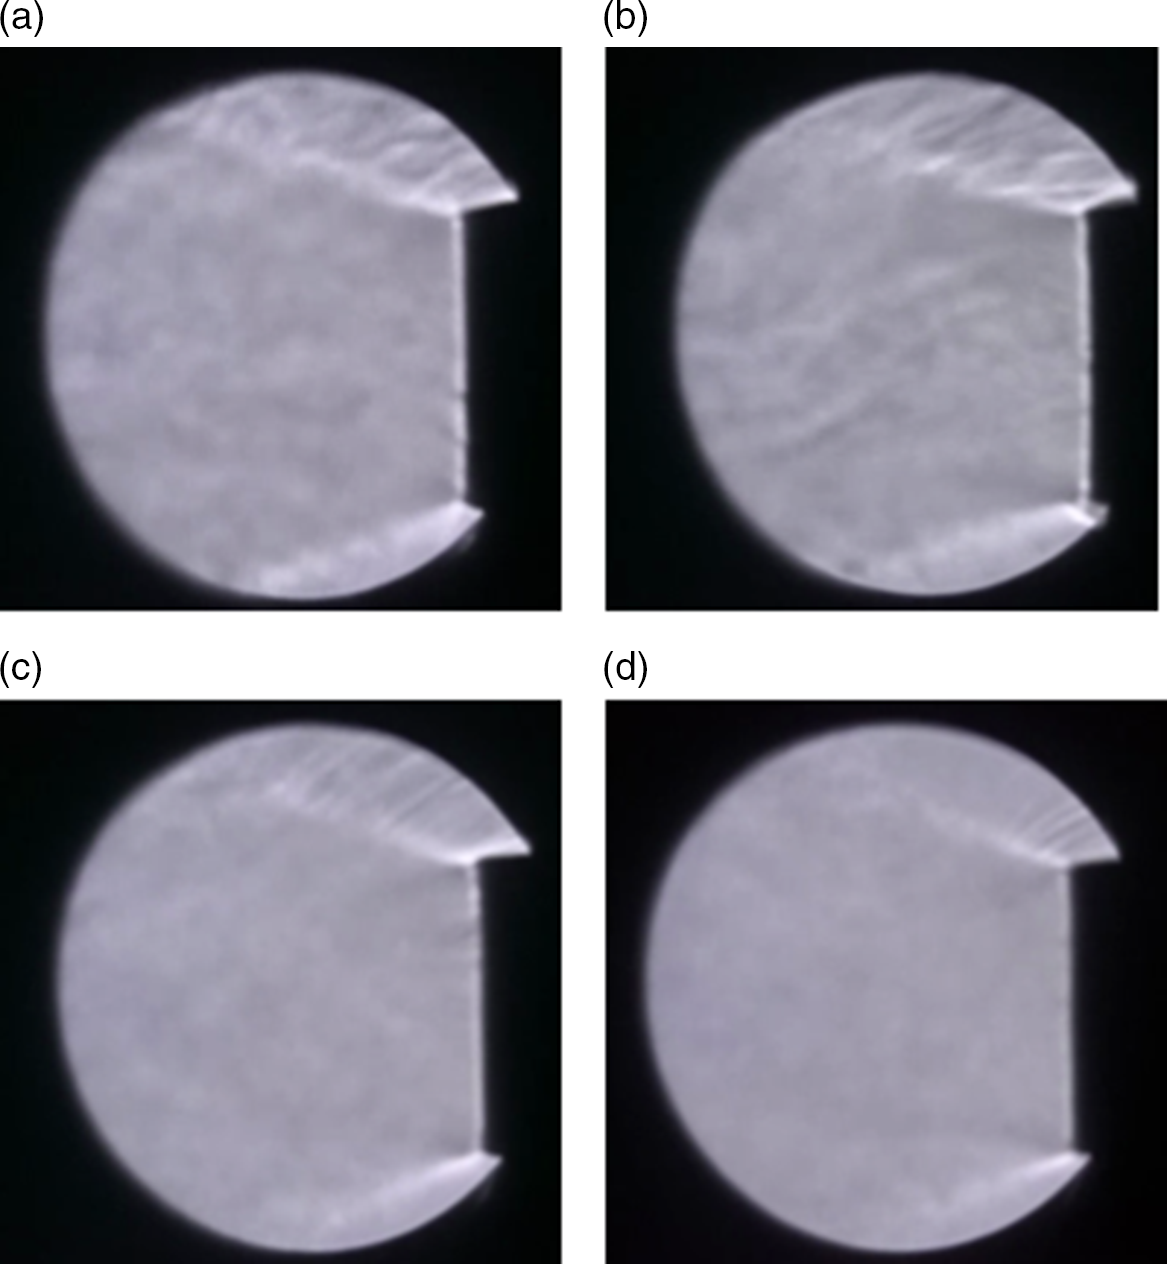
Figure 21. Visualisation of plume flow with bypass ratio: (a) bypass 0.0 (b) bypass 0.5 (c) bypass 1.0 (d) bypass 1.4.
4.0 CONCLUSION
In this paper, infrared signal and temperature measurement are performed to understand the characteristics of the infrared signal according to the bypass ratio by supplying compressed air to a micro-turbojet engine equipped with a lobed mixer. The experiment was performed under the conditions of bypass ratio 0.5, 1.0, 1.4, and temperature and infrared were measured at the positions of 0.16D, 1D, 2D, 3D, 4D and 5D from the nozzle exit.
As a result of measuring the exhaust gas infrared signal, the infrared signal is reduced as the bypass ratio increased. The infrared signals are reduced at a rate of 12.1%, 30.6% and 46% for bypass ratios of 0.5, 1.0 and 1.4 at the 0.16D position from the nozzle outlet, respectively. Compared with the results of Joo et al.(Reference Joo, Jo, Choi and Jo4), it can be seen that the lobed mixer has a greater effect on reducing the temperature of the exhaust gas and reducing the infrared signal than the cone nozzle. In addition, as the bypass ratio increases, the temperature of the exhaust gas decreases more at the nozzle outlet. The larger the bypass ratio, the greater the effect of reducing the exhaust gas temperature even at a close distance from the nozzle outlet. This means that as the bypass ratio increases, the mixing of the high-temperature core flow and the bypass flow increases. Therefore, as the bypass ratio increases, the hot core flow is more uniformly mixed with the flow generated by the lobed mixer and discharged to the atmosphere. This can be confirmed in the image result of Schlieren visualisation.
The results of this study can be used as basic data when developing a lobed mixer for infrared signal reduction. The detailed calculation of the mixing characteristics in the lobed mixer will be studied later through numerical analysis.