NOMENCLATURE
- x
spatial co-ordinate, origin at the nozzle inlet section
- y
spatial co-ordinate, origin at the nozzle symmetry axis
- h
height of the recessed step
- H
height of the nozzle profile at the throat (from nozzle centreline)
- u
x-component of the flow velocity
- v
y-component of the flow velocity
- P
pressure
- T
temperature
- M
Mach number
- Re
Reynolds number
- ρ
density
- β
nozzle expansion ratio (total to ambient pressure)
- t
total conditions
Greek Symbol
Superscript
1.0 INTRODUCTION
The expansion of a stagnant fluid or low-speed flow to supersonic speeds is required in a number of aerospace and industrial applications, e.g. aircraft and rocket propulsion(Reference Sutton and Biblarz23), wind tunnels for aerodynamic testing(Reference Pope17) and supersonic turbines for energy conversion(Reference Angelino, Invernizzi, Macchi, Angelino, De-Luca and Sirignano1,Reference Colonna, Casati, Trapp, Mathijssen, Larjola, Turunen-Saaresti and Uusitalo4,Reference Larjola12) , and supercritical CO2 jets for chemical processes(Reference Helfgen, Türk and Schaber9). In all such processes, the working fluid undergoes an expansion in a converging-diverging duct at relatively large Reynolds numbers. The fluid achieves sonic conditions at the minimum-area section (throat) of the duct and becomes supersonic in the diverging portion to eventually attain the design Mach number at the exhaust section. The viscous boundary layer displaces the so-called inviscid core from the duct walls by its thickness, thus modifying the area and pressure distributions through the duct and the position and shape of the sonic line, as obtained from the inviscid-flow design. Moreover, operating conditions (e.g. the reservoir or ambient pressure) are subject to small variations, which in turn cause boundary-layer unsteadiness. The maximum massflow discharged by the duct, which is proportional to the throat area(Reference Thompson24), is slightly reduced due to the contraction of the minimum-area passage.
Boundary-layer unsteadiness can possibly be controlled by the introduction of a geometry singularity such as a sharp corner or a recessed step, which triggers separation of the boundary layer at the singularity location. Applications of this simple workaround to high-speed flows are documented in literature and move from a sound phenomenological knowledge of the behaviour of supersonic flows past recessed-step obstacles(Reference Chapman3,Reference Hama7,Reference Roshko and Thomke18,Reference Smith19,Reference Wu, Su and Moulden27) . In Refs 10, 11 and 25, boundary-layer separation is forced at a geometry singularity in the supersonic portion of a nozzle and in Ref. 28, a backward-facing step is examined as a viable device to increase the characteristic time of mixture residence in a scramjet combustor.
In the present work, the supersonic expansion of dry air in a planar converging-diverging nozzle is examined. Separation of the boundary layer at the nozzle throat is imposed by the introduction of a small recessed step at the minimum-area section. The presence of a recessed-step at the nozzle throat is expected to perturb the flow-field so as to set the inviscid throat location and the position and shape of the sonic line. A possible, desirable, outcome of this modification of the throat geometry is a more stable behaviour of the flow in the diverging portion of the nozzle at varying operating conditions.
The goal of the present work is to examine the adapted operation of a planar converging-diverging nozzle in the presence of a recessed step at the throat. Specifically, the disturbances introduced by the recessed step on the flow in close proximity to the step edge and on the overall flowfield are quantified by means of a detailed experimental and numerical analysis. Pressure measurements and schlieren visualisations are performed on the geometry with the recessed step and compared to results obtained from a geometry with no recessed step, which will be referred to in the following as the “clean” configuration. Both geometries are simulated numerically to support the experimental findings.
The present paper is structured as follows. In Section 2, a brief overview of the experimental set-up is provided, with particular regard to the pressure measurement system and to the layout of the optical components for schlieren visualisations. In Section 3, the operation of the nozzle in adapted flow conditions is examined and results for the clean and recessed step configuration are compared. A closer investigation to the flow pattern originating at the step edge is presented in Section 3.1. In Section 3.2, the effect of the step height is examined. Section 4 provides concluding remarks.
2.0 EXPERIMENTAL SET-UP
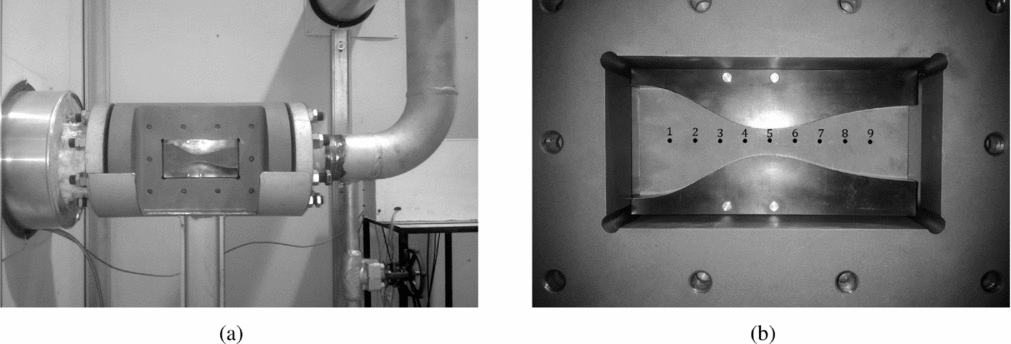
Supersonic nozzle flows of dry air in the clean and recessed step configurations were tested in a blow-down wind tunnel, named TROVA (Test-Rig for Organic VApours). The facility was designed to observe the expansion of a molecularly complex fluid, namely, siloxane MDM (Octamethyltrisiloxane, C8H24O2Si3), in the so-called non-ideal compressible-fluid region in the close proximity of the liquid-vapour saturation curve and critical point(Reference Spinelli, Pini, Dossena, Gaetani and Casella21). In all experiments reported in the present study, the wind tunnel is run with dry air. All tests are performed at room temperature, and the total pressure in the settling chamber is 4 bar. Therefore, the ideal, dilute gas model Pv = RT, where P is the pressure, v is the specific volume, R the gas constant for air, and T is the temperature, can be assumed. The temperature is well below the first vibrational temperature, therefore, a constant specific heat ratio γ = c P/c v is maintained. The TROVA operates in a discontinuous way, namely the fluid is discharged from a high-pressure vessel to a low-pressure vessel through a planar converging-diverging nozzle, which constitutes the test section of the wind tunnel, see Fig. 1. Specifically, the nozzle is made of contoured profiles, which can be easily replaced whenever a different nozzle geometry has to be tested. Stagnation pressure P t and temperature T t are measured in the settling chamber upstream of the nozzle and static pressure is measured along the nozzle axis, at the locations marked with black dots in Fig. 1(b). In the following, the pressure measurement system and the layout of the schlieren bench are briefly described. The reader is referred to Refs 5, 20 and 21 for a detailed description of all the plant components.
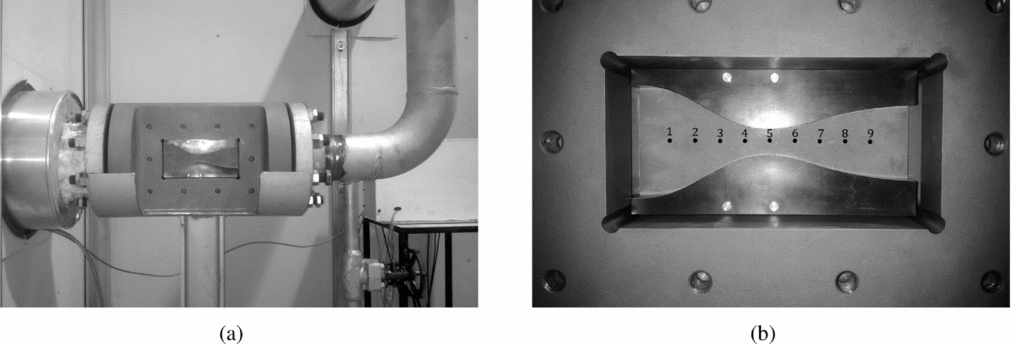
Figure 1. Overview of the TROVA test section (a) and details of the nozzle within the test section (b). Flow direction is from left to right.
For static pressure measurements, a wall pressure tap-line-transducer system is machined in the steel plate, which constitutes the rear planar wall of the test section (see Fig. 1(b)). Each pressure measurement point on the nozzle axis is connected to a piezo-resistive transducer (Kulite XTEH-7L series) by a ~25 mm long, 0.3 to 1.5 mm diameter pneumatic line, followed by a ~45 mm3 capacity ahead of the sensing element. A natural frequency of about 900 Hz was estimated for the transmission lines(Reference Antonini, Persico and Rowe2), thus limiting the observable frequencies at a maximum value of 200–250 Hz, in the absence of a dynamic calibration of the taps. All pressure transducers were calibrated in pressure and temperature in the range 3.5–40 bar at 25–250℃, yielding an expanded uncertainty of 0.07% of the full scale. Due to the very low flow velocity in the settling chamber upstream of the nozzle, the same wall pressure tap-line-transducer arrangement is implemented for the measurement of the total pressure. To measure the total temperature, the tip of a J-type thermocouple is positioned at the symmetry axis of the settling chamber and at the same axial location of the total pressure tap. The thermocouple is calibrated in the range 25–250℃, with expanded uncertainty 1℃. Both pressure transducers and thermocouples provide a voltage output. The measured signals are amplified by an analog signal conditioning system before being sampled and converted to digital by a high-speed data acquisition board housed in a dedicated computer. A software developed in LabView environment runs the data acquisition module and includes the plant control routines.
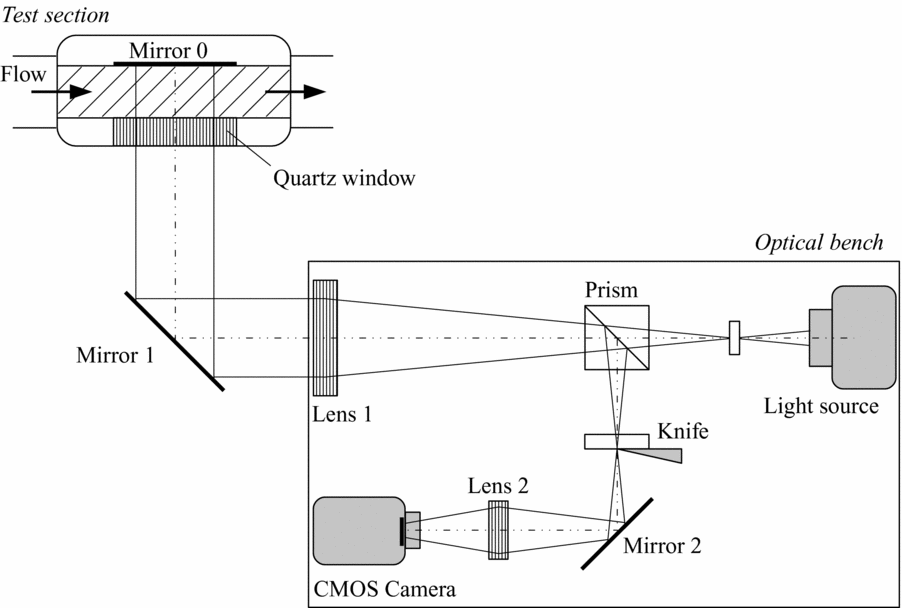
Schlieren visualisations of the flow within the nozzle complement pressure and temperature measurements. The front planar wall of the test section is a quartz window allowing for optical access to the flow, while the rear closure is a mirror-polished steel plate. Since optical access is permitted only from one side of the test section, the double-passage parallel-light schlieren system sketched in Fig. 2 is used instead of the classical Z-type configuration. The emitting and receiving optical components are mounted on the same bench, thus the optical path lies in a plane containing the nozzle axis and perpendicular to the nozzle lateral walls (the front quartz window and the back closure). The light from a 100 W Hg arc-lamp is focused by an F/1.5 silica lens into a circular spot of about 3 mm in diameter and then collimated by the schlieren head (Lens 1 in Fig. 2, 150 mm diameter, 1000 mm focal length). A circular mirror, indicated as Mirror 1 in Fig. 2, deflects the collimated light beam perpendicularly to the test section. After traversing the test section, the light beam is reflected back to the schlieren head by the mirror-polished rear wall of the test section, indicated as Mirror 0 in Fig. 2. The reflected beam is displaced from the incident one by an amount proportional to the density gradients within the flow in the measurement volume. A cubic beam-splitter (Prism in Fig. 2) separates the light originated by the light source from the reflected beam and deviates the latter towards the knife edge. The vertical orientation of the knife edge allows the visualisation of density gradients in a streamwise direction. The lens indicated as Lens 2 in Fig. 2 (50 mm diameter, 150 mm focal length) forms the image of the test section on the sensor of a high-speed Complementary Metal-Oxide-Semiconductor (CMOS) camera. The camera records the schlieren images for the entire duration of the test at a rate of 100 fps. The image resolution is set to 1024 × 512 pixels and the exposure time to 20 μs.
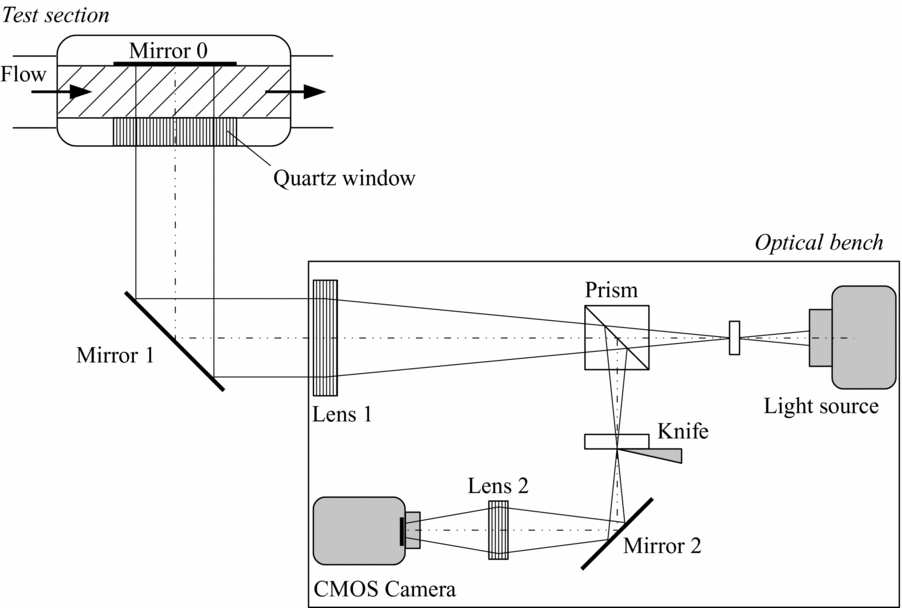
Figure 2. Functioning scheme of the double-passage schlieren set-up.
3.0 ADAPTED NOZZLE FLOWS FOR THE CLEAN AND RECESSED-STEP CONFIGURATIONS
In the present section, the effects of the recessed step on the nozzle flow in adapted conditions are examined. Two different nozzle geometries are considered, one with the recessed step and one with a smooth profile at the throat (clean configuration).
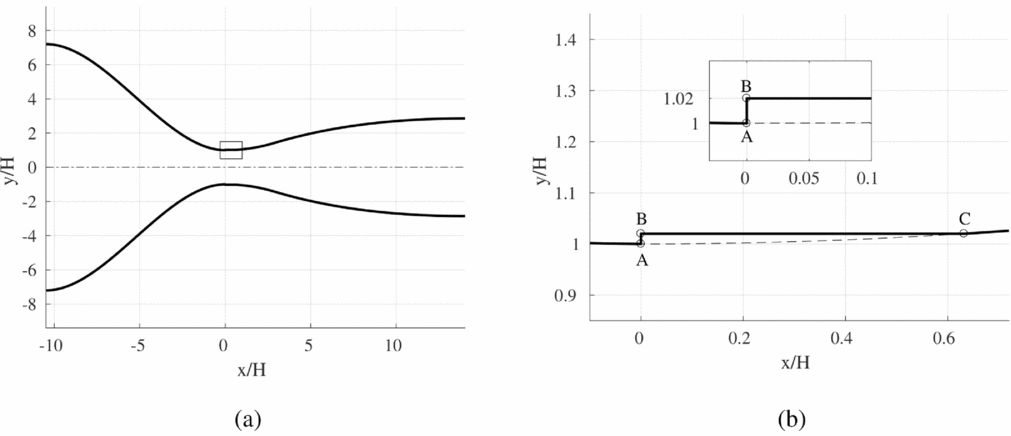
The non-dimensional geometry of the converging-diverging nozzle is shown in Fig. 3(a). The normalisation parameter is the throat half-height H. The nozzle is designed to operate with dry air in dilute gas conditions. In adapted conditions, the ambient to reservoir pressure ratio β is 20 and the exhaust design Mach number is 2.59. The Reynolds number computed using the throat half-height H as the reference length and sonic flow conditions is Re = 3.73 × 10⁵. The diverging portion of the nozzle is designed by applying the method of characteristics implemented in Ref. 5, while the profile of the converging portion is defined by a third-order polynomial curve. At the throat section, the profiles of the converging and diverging portions match with horizontal tangent. Two symmetrical contoured profiles shaped as the upper and lower contours of Fig. 3(a) constitute the top and bottom wall of the nozzle mounted within the test section of the TROVA test rig. The throat half-height is 5 mm and the nozzle is 18.7 mm wide, which results in a throat area of 187 mm2. The inlet to throat area ratio or, equivalently, the contraction ratio of the converging portion is 7.2, while the exit to throat area ratio is 2.86. The axial location of the geometrical throat is coincident with the third pressure tap along the nozzle axis and the exhaust section is located past the seventh pressure tap (see Fig. 1(b)). The overall nozzle length is 122.6 mm and the ratio of the length of the diverging portion to that of the converging one is 1.34.

Figure 3. Non-dimensional geometry of the converging-diverging nozzle. (a) Complete geometry. (b) Detailed view of the throat section and of the recessed step.
The geometry with the recessed step at the throat is obtained by machining the top and bottom contoured profiles as shown in the detailed view of Fig. 3(b). The height of the recessed step at the geometrical throat is h = 0.1 mm, which corresponds to 2% of the throat half-height.
In all experiments reported in the present work, the fluid pressure in the high pressure vessel is 12 bar. The fluid is throttled through a control valve to reach a total pressure of 4 bar in the settling chamber. The fluid exiting from the nozzle is discharged to the low-pressure vessel, where the pressure at the beginning of the test is about 0.1 bar. The downstream reservoir fills during the experiment, hence, the pressure downstream of the nozzle increases gradually until equilibrium is reached. The nozzle flow regimes change accordingly from under-expanded conditions to an unchocked, fully subsonic flow.
Figure 4 reports the schlieren visualisations of the flow field in adapted conditions for both the recessed-step and the clean configurations. Images include about 10 mm of the converging portion, the divergent and 31.6 mm of the downstream ambient. As already commented in paragraph 2, the knife orientation allows to visualise density gradients parallel to the nozzle axis. Darker grey levels are associated to positive density gradients (compressions) and lighter grey levels to negative ones (expansions).

Figure 4. Schlieren visualisation of the adapted nozzle flow, β = 20. (a) Recessed-step configuration. (b) Clean configuration.
For the recessed-step geometry, the schlieren visualisation reported in Fig. 4(a) reveals the occurrence of a complex flow pattern in the throat region of the nozzle. It is a perturbation wave system originating at the step edge (point A in Fig. 3(b)) and propagating towards the exit section of the nozzle with multiple reflections at the nozzle walls and mutual inter-actions at the nozzle axis. For comparison, the same adapted flow conditions of Fig. 4(a) are replicated in Fig. 4(b) for the clean configuration. As expected, the flow in the diverging portion is free of shocks and no perturbation waves originate in the throat region of the nozzle. Indeed, the schlieren image of the clean configuration distinctly shows the Mach lines in the supersonic portion of the nozzle, especially in the throat region, where the strongest density gradients are attained. Mach lines originate from small flaws along the nozzle surface due to machining. In both Figs 4(a) and (b), the equally spaced dark spots along the nozzle axis mark the location of the static pressure taps.
According to schlieren visualisations, the clean and recessed-step nozzles exhibit markedly different flow arrangements even in adapted flow conditions. Static pressure measurements along the nozzle axis and numerical simulations of the overall nozzle flow are now used to quantify the influence of the recessed step on the static pressure field.
Nozzle flow simulations are performed using SU2, a C++ open-source software suite for solving multiphysics PDE problems on unstructured grids. SU2 includes a Reynolds Averaged Navier-Stokes (RANS) finite volume solver for the simulation of compressible and conductive turbulent flows. A thorough description of the code structure and capabilities is provided in Ref. 16, while the implementation of thermodynamic and transport models including state-of-the-art equations of state for non-ideal compressible-fluid flows is described in Ref. 26. SU2 is applied here to the simulation of the adapted nozzle flow in the clean and recessed-step configuration. The computational domain reproduces the test section of the TROVA test-rig. For the planar nozzle geometry of interest in the present work, two-dimensional simulations are considered to be sufficient to capture the flow behaviour at the middle section of the wind tunnel, where the inter-action with the sidewall boundary layer is expected to be negligible. Therefore, two-dimensional simulations are performed in the domain defined by the converging-diverging profile reported in Fig. 3, with and without the recessed step at the throat. Stagnation pressure and temperature are assigned at the nozzle inlet section. They are 4 bar and 288 K, respectively. At the nozzle exhaust section, static pressure is imposed, which in adapted conditions is 0.2 bar (β = 20). Turbulence is modelled using the k-ω SST turbulence model(Reference Menter15).
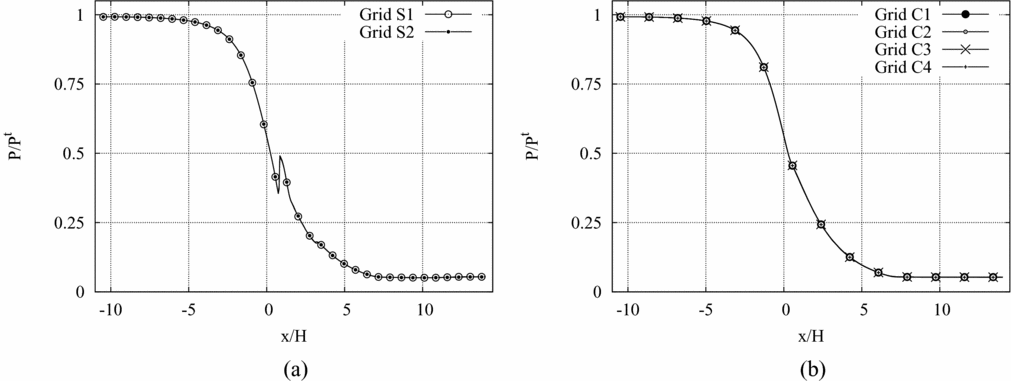
A grid dependence study on the pressure along the nozzle axis in adapted conditions is shown in Fig. 5. The pressure is computed in both the clean and the recessed-step configuration using the computational grids listed in Table 1. For the clean configuration, four quadrilateral grids are used. The recessed-step geometry is simulated instead on two different hybrid quadrilateral-triangular grids. For both geometries, the first grid point is placed in the viscous sublayer, so that no wall functions are used. From Figs 5(a) and (b), the independence of the calculated pressure profile on the computational grid is apparent. In the following, the C2 grid (made of 81,792 nodes and 81,196 elements) is adopted for all the simulations of the clean configuration.
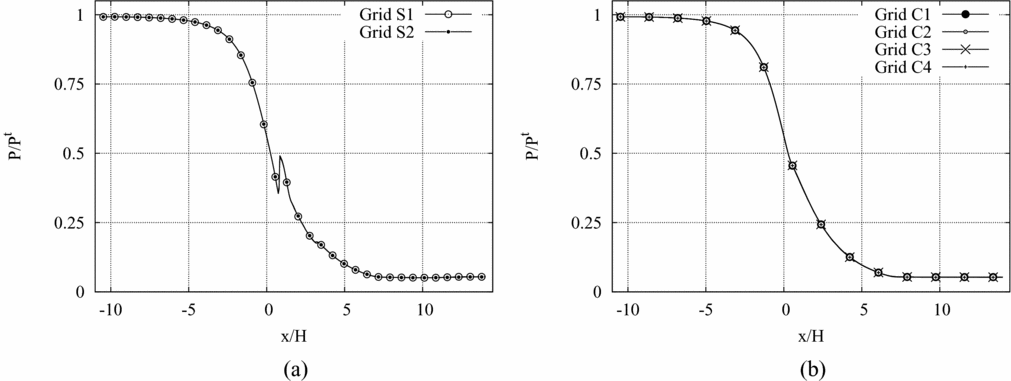
Figure 5. Grid convergence evaluated on the pressure profile along the nozzle axis. (a) Recessed-step configuration. (b) Clean configuration.
Table 1 Computational grids for the simulation of the clean and recessed-step configurations

In addition to an accurate representation of the overall nozzle flow, the simulation of the recessed-step nozzle also requires to correctly reproduce the flow past the geometry singularity at the throat. While the overall nozzle flow has a characteristic length of ![]() ${\mathscr O}(10 \ {\rm mm})$ (i.e. the height of the throat section), the flow past the recessed step has a characteristic length of
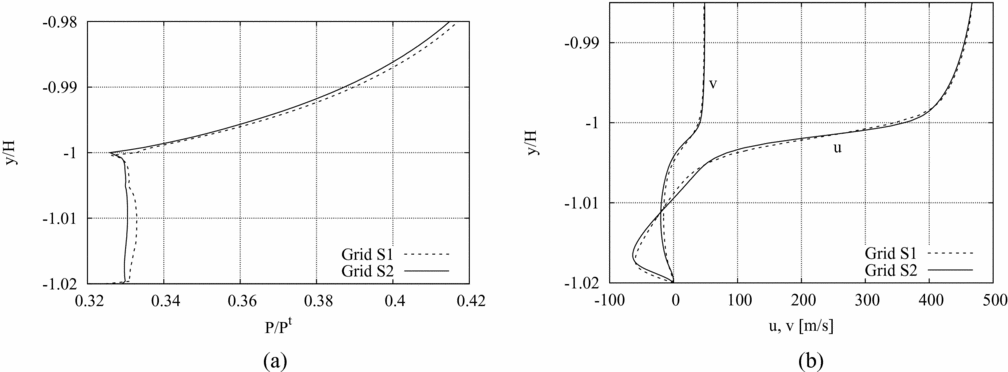
${\mathscr O}(10 \ {\rm mm})$ (i.e. the height of the throat section), the flow past the recessed step has a characteristic length of ![]() ${\mathscr O}(0.1 \ {\rm mm})$ (i.e. the step height). At the recessed-step location, the incoming boundary layer separates and forms a recirculation region, which ends at the reattachment point on the bottom wall downstream of the obstacle(Reference Hama7,Reference Wu, Su and Moulden27) . For the recessed-step nozzle, the dependence of the solution within the recirculation region on the grid resolution is also checked as follows. Figure 6(a) reports the pressure profile along the vertical wall of the step on the lower nozzle wall, from the step base (y/H = −1.02) to a point located at a distance of one step height from the minimum-area section (y/H = −0.98). The numerical profiles of the two velocity components along y/H and at one step height downstream of the throat (x/H = h) are also shown in Fig. 6(b). The pressure in the recirculation region past the recessed-step is expected to keep a constant value, except in the close proximity of the bottom wall and of the step edge. Such behaviour appears to be better captured by the pressure profile computed on the finest (S2) grid (Fig. 6(a)). From Fig. 6(b), grid independence of the velocity profiles at y/H > −1 is apparent. More prominent differences are observed in the velocities calculated within the recirculation region (y/H < −1). In the following, the S2 grid (made of 392,433 nodes and 550,796 elements) is adopted for all the simulations of the recessed-step configuration.
${\mathscr O}(0.1 \ {\rm mm})$ (i.e. the step height). At the recessed-step location, the incoming boundary layer separates and forms a recirculation region, which ends at the reattachment point on the bottom wall downstream of the obstacle(Reference Hama7,Reference Wu, Su and Moulden27) . For the recessed-step nozzle, the dependence of the solution within the recirculation region on the grid resolution is also checked as follows. Figure 6(a) reports the pressure profile along the vertical wall of the step on the lower nozzle wall, from the step base (y/H = −1.02) to a point located at a distance of one step height from the minimum-area section (y/H = −0.98). The numerical profiles of the two velocity components along y/H and at one step height downstream of the throat (x/H = h) are also shown in Fig. 6(b). The pressure in the recirculation region past the recessed-step is expected to keep a constant value, except in the close proximity of the bottom wall and of the step edge. Such behaviour appears to be better captured by the pressure profile computed on the finest (S2) grid (Fig. 6(a)). From Fig. 6(b), grid independence of the velocity profiles at y/H > −1 is apparent. More prominent differences are observed in the velocities calculated within the recirculation region (y/H < −1). In the following, the S2 grid (made of 392,433 nodes and 550,796 elements) is adopted for all the simulations of the recessed-step configuration.
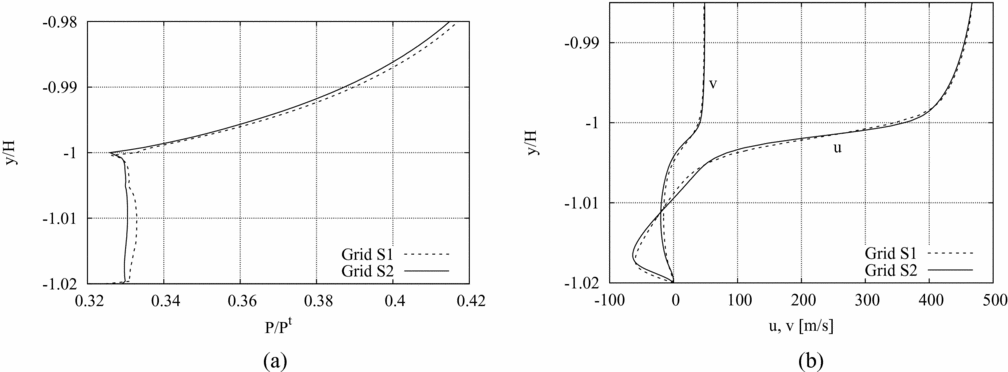
Figure 6. Grid convergence results for the recessed-step configuration. (a) Pressure profile along the step vertical wall (x/H = 0, −1.02 < y/H < −0.98). (b) Velocity profiles along y/H and at one step height downstream of the throat. (x/H = h, −1.02 < y/H < −0.98).
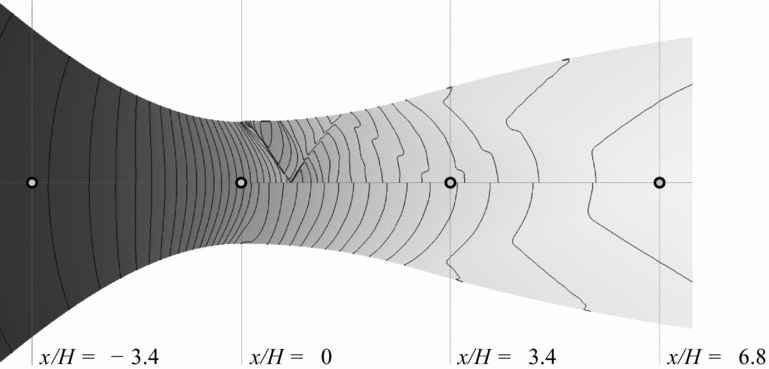
Numerical results for the static to total pressure ratios P/P t for the adapted flow regime are shown in Fig. 7. In the top portion of the plot, numerical results for the recessed-step configuration are reported. The complex wave structure observed in the experiments (cf. Fig. 4(a)) is clearly visible. For the clean configuration, numerical results confirm a smooth subsonic-to-supersonic transition in the throat region. For consistency, pressure isolines refer to the same pressure levels for both the clean and the recessed-step configuration.
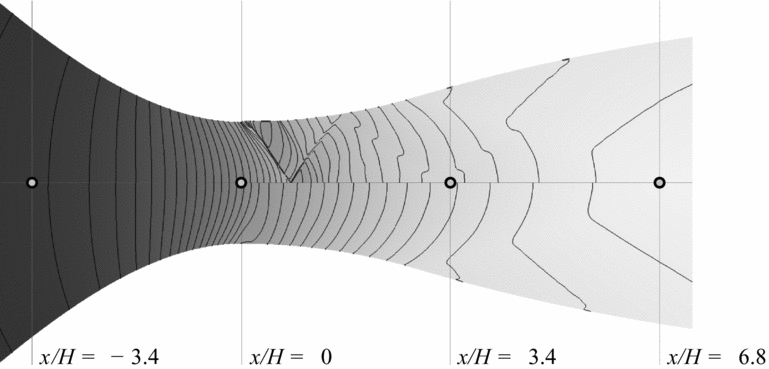
Figure 7. Static to total pressure ratio in adapted conditions for the recessed-step (upper portion) and the clean (lower portion) configuration.
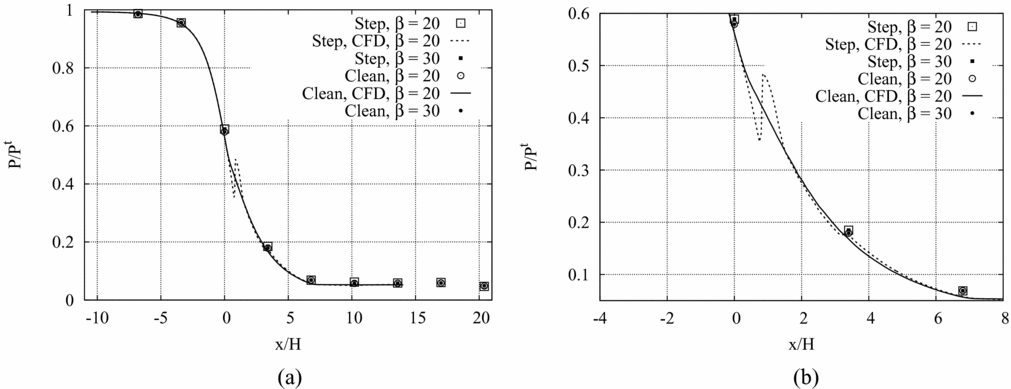
In Fig. 8(a), the static pressure measured along the nozzle axis in adapted and under-expanded conditions is compared to numerical simulations for the clean and recessed-step configuration. Experimental results are reported over 9 different pressure taps. Figure 8(b) provides a detailed view of the pressure profile in the throat region and in a portion of the divergent. Both charts clearly show that in the diverging portion and sufficiently far from the throat section, the recessed-step nozzle attains the same pressure level of its smooth counter-part. This result suggests that the perturbation introduced by the recessed step acts only locally and does not alter significantly the flow in the diverging portion.
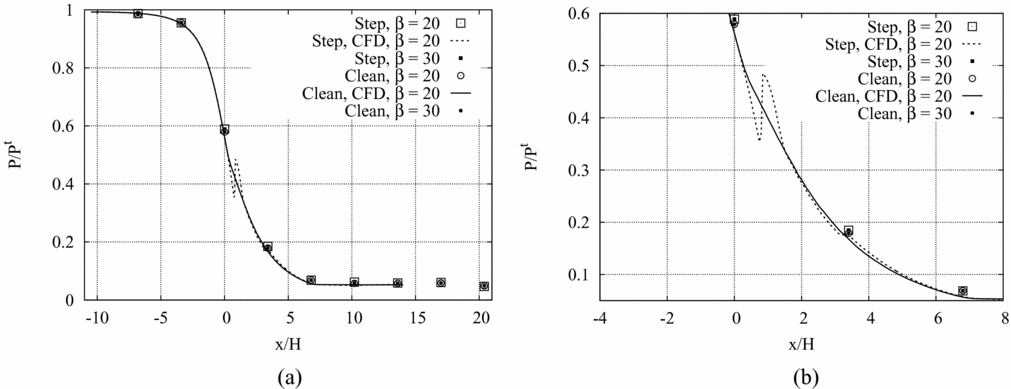
Figure 8. (a), (b) P/P t along the nozzle axis in adapted and under-expanded conditions for the clean and the recessed-step configurations. (b) Detailed view of the throat region.
3.1 Flow features in the throat region
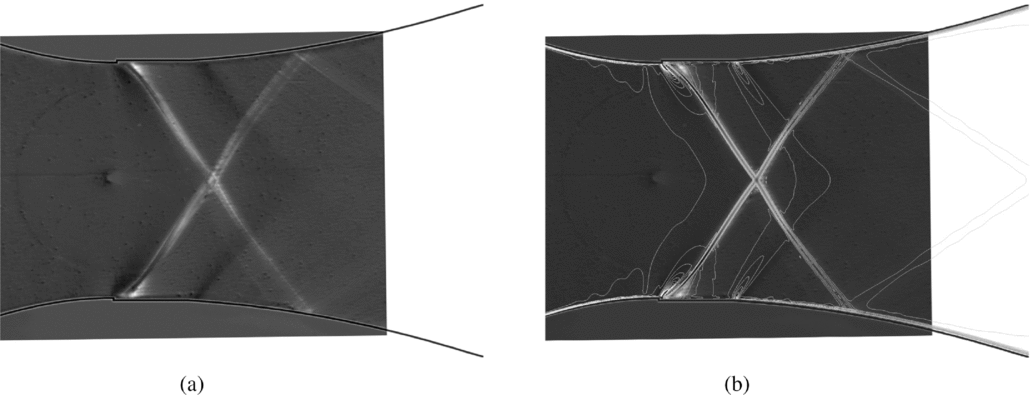
A closer investigation including both schlieren visualisations and numerical simulations is now performed to unveil the nature of the perturbation wave system observed in the previous section. A schlieren visualisation of the throat region in adapted conditions is shown in Fig. 9(a). This enlarged schlieren image is recorded by replacing the lens designated as Lens 2 in Fig. 2 (150 mm focal length) with a lens of 1,000 mm focal length and by adjusting the camera position accordingly. Contrary to the schlieren images reported in the previous paragraph, the knife position is adjusted in such a way that light rays deflected by positive density gradients are left unblocked. Hence, expansions appear as darker regions, compressions as lighter ones. In Fig. 9(b), the computed isolines of the density gradient in the streamwise direction are superimposed to the schlieren image, showing, indeed, a fine agreement.
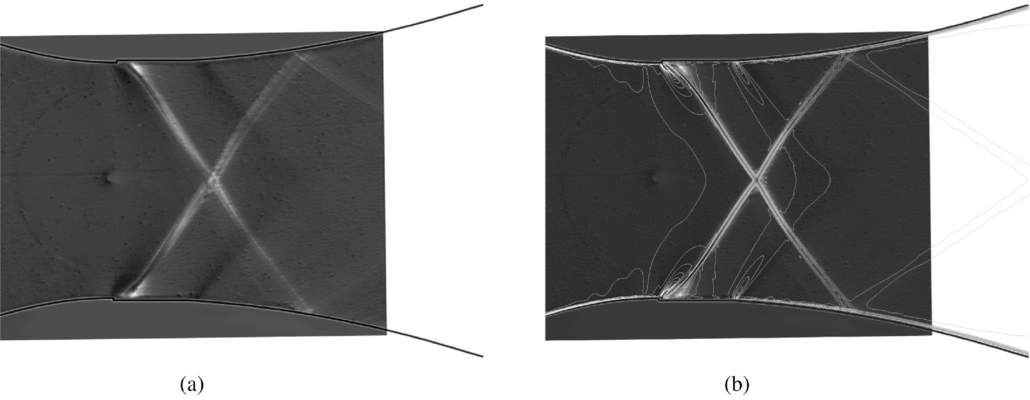
Figure 9. (a) Schlieren visualisation of the throat region. (b) Isolines of the density gradient in streamwise direction (from CFD simulation) superimposed to the schlieren visualisation.
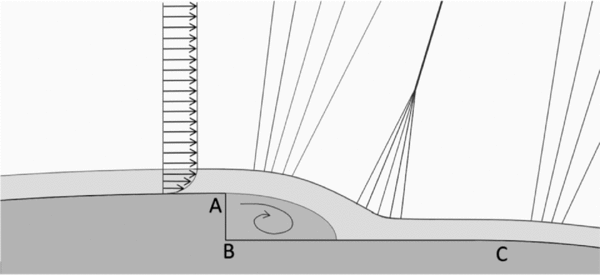
With reference to Figs 9(a) and (b), and to the qualitative representation of the flow configuration reported in Fig. 10, the flow pattern in the throat region can be understood. The boundary layer separating at the step edge (point A in Fig. 10) reattaches on the down-stream bottom wall and encloses a separation bubble past the vertical wall of the step. A Prandtl-Meyer expansion fan is centred at the step corner. The fluid then expands over the separated region and it recompresses again near the reattachment point through a series of weak compression waves. The compression waves eventually coalesce into an oblique shock, which is clearly observed in the schlieren visualisation of Fig. 9(a) (white curve originating at the recessed step location). Away from the step, the oblique shock is curved and bent upstream due to the inter-action with the expansion fan emanating from the step edge (point A in Fig. 10). This inter-action is clearly visible from both Figs 9(a) and (b). At the location identified as point C in Fig. 10, the recessed step ends and a second expansion fan is formed.
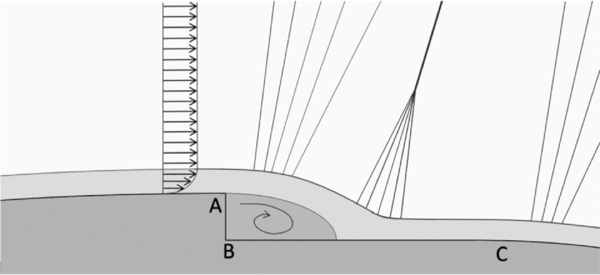
Figure 10. Qualitative representation of the supersonic flow at the recessed step location, according to Ref. 22.
In addition to the flow features outlined previously, the presence of a so-called lip shock at the onset of boundary-layer separation past backward-facing obstacles is documented in experimental(Reference Hama7) and numerical(Reference Halupovich, Natan and Rom6) studies. Across the lip shock, the pressure of the expanded flow past the step corner increases to reach its so-called base value at the bottom of the step. At the reattachment point, the fluid is further compressed by the compression wave-oblique shock system described previously, often referred in literature as wake shock(Reference Hama7).
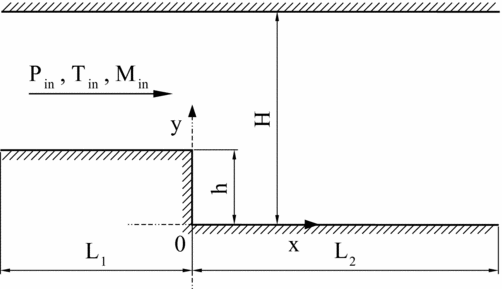
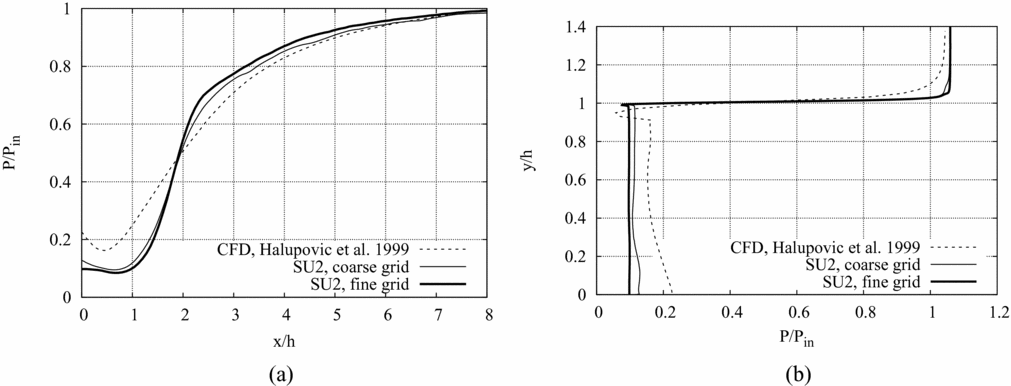
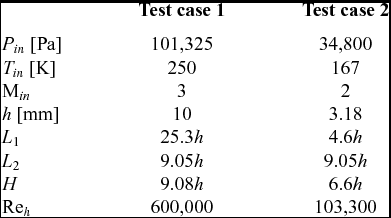
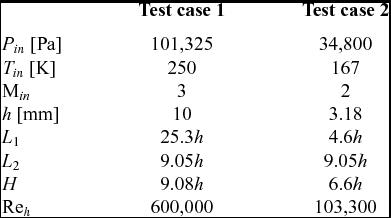
As a further assessment of the capabilities of the adopted numerical method to capture nozzle flows in the recessed-step configuration, supersonic channel flows experiencing an expansion past a backward-facing step are simulated with SU2. Results are validated by comparison between experimental results of planar laser-induced iodine fluorescence (PLIIF) measurements of Ref. 8 and Computational Fluid Dynamics (CFD) simulations of Ref. 6. The computational domain is shown in Fig. 11 and simulation parameters are given in Table 2. Numerical results of test case 1 are reported in Fig. 12. The normalised pressure profile along the bottom wall behind the step is given in Fig. 12(a) versus the non-dimensional abscissa. The origin is set at the step base and the normalisation parameter is the step height. In the base region immediately downstream of the step, the pressure is significantly lower than free-stream. The flow pressure attains its free-stream value close to the reattachment point. Figure 12(b) reports the normalised pressure profile along the vertical wall of the step. The flow experiences a pressure drop near the step edge, down to a value that is lower than the base pressure. The base pressure value is then restored by the lip shock and remains constant along the vertical wall.
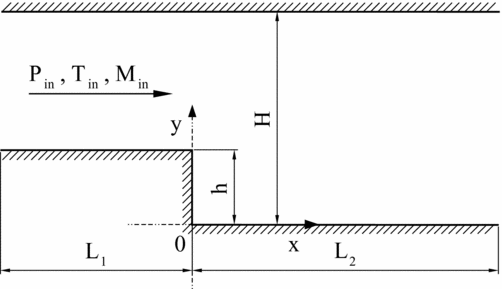
Figure 11. Computational domain for the simulation of uniform supersonic flows past recessed-step obstacles. The geometry of the domain is taken from Ref. 6.
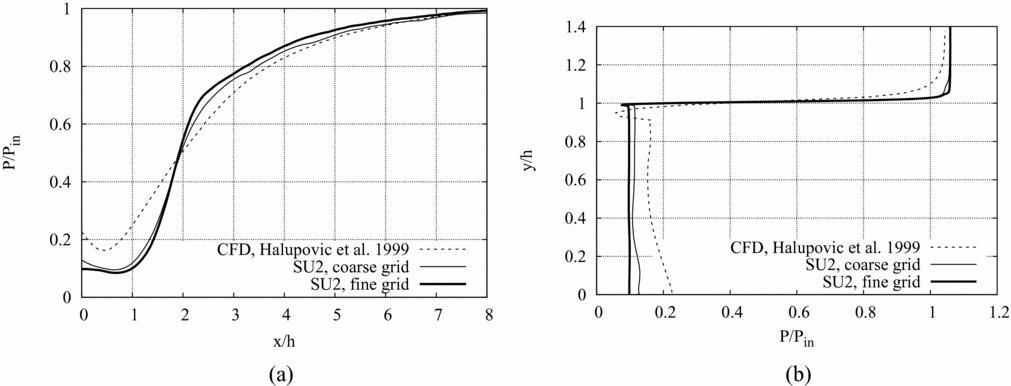
Figure 12. SU2 results for Test case 1 compared to CFD results reported in Ref. 6. (a) Normalised pressure profile along the bottom wall behind the step. (b) Normalised pressure profile along the vertical wall of the step.
Table 2 Simulation data for supersonic channel flow test cases. Test case 1 and Test case 2 reproduce test case 22 and 5 reported in Ref. 6, respectively
SU2 calculations are reported over two different hybrid quadrilateral-triangular grids and compared to the CFD results documented in Ref. 6. The coarse grid made of 120, 974 nodes and 173, 138 elements and the fine one of 588, 893 nodes and 864, 094 elements. In both SU2 grids, the first grid point is placed in the viscous sublayer. The reference CFD results of Ref. 6 are obtained using the PHOENICS CFD code(Reference Ludwig13,Reference Ludwig, Qin and Spalding14) , which instead, implements a k-ε turbulence model with a wall treatment based on the wall-function approach. The computational grid of the reference simulation is a quadrilateral grid of ![]() ${\mathscr O}(10^4)$ nodes and elements. The SU2 and reference CFD results match fairly well outside of the separated flow region, where the influence of turbulence models on simulation results is less significant. Among the SU2 results, a grid dependence of the pressure levels achieved in the recirculation region is observed. As expected, the fine grid better captures the typical pressure distribution attained in recirculation regions.
${\mathscr O}(10^4)$ nodes and elements. The SU2 and reference CFD results match fairly well outside of the separated flow region, where the influence of turbulence models on simulation results is less significant. Among the SU2 results, a grid dependence of the pressure levels achieved in the recirculation region is observed. As expected, the fine grid better captures the typical pressure distribution attained in recirculation regions.
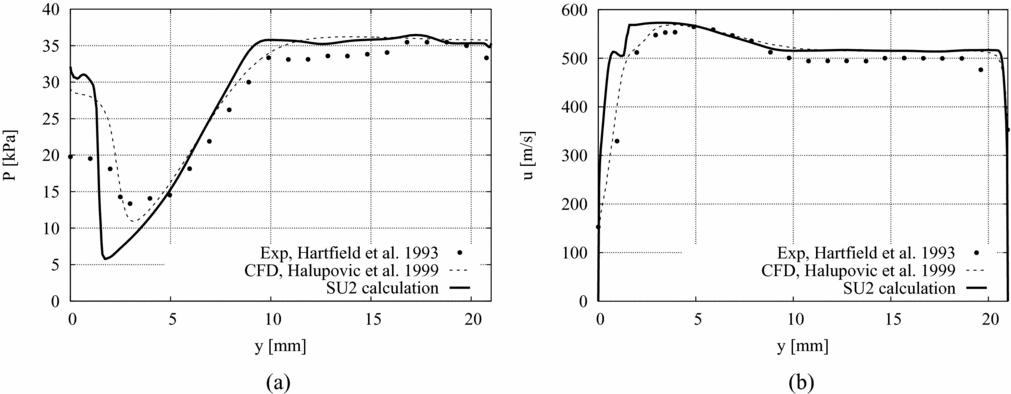
Results of test case 2 (see Table 2) are presented here to assess the SU2 calculations against the experimental data of Ref. 8 and the CFD results of Ref. 6. The pressure and streamwise velocity profiles in a direction parallel to the vertical wall of the step and 10 mm downstream of the step base are reported in Fig. 13. This section is located downstream of the reattachment point. The grid spacing adopted in the SU2 simulation (418,465 nodes and 674,722 elements) is the same as that of the fine grid of test case 1. The agreement between the measurements and the calculations performed with SU2 and PHOENICS is good away from the walls and particularly outside of the recirculation region, where the two solvers predict a significantly higher pressure drop than the measured one. Even so, the numerical method adopted so far has proven to correctly capture the qualitative features of the flowfield once grid convergence is reached.
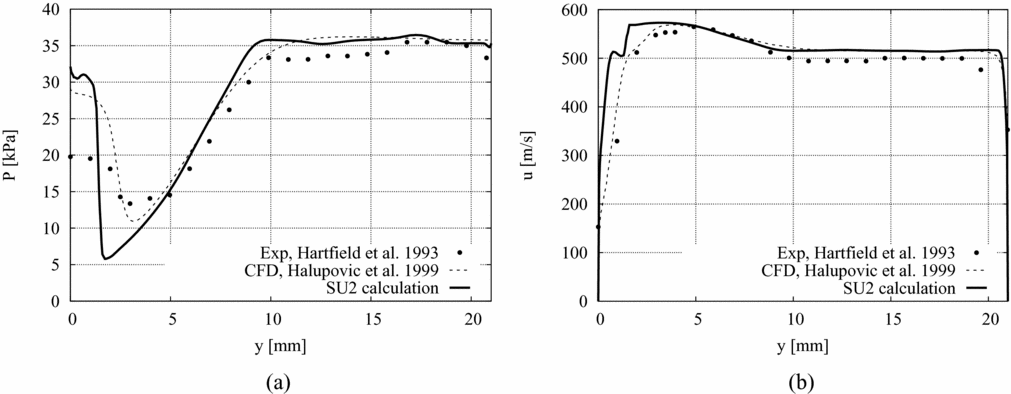
Figure 13. SU2 results for Test case 2 compared to the CFD results reported in Ref. 6 and the PLIIF measurements of Ref. 8. (a) Pressure and (b) streamwise velocity profiles in a direction parallel to the vertical wall of the step and 10 mm downstream of the step base.
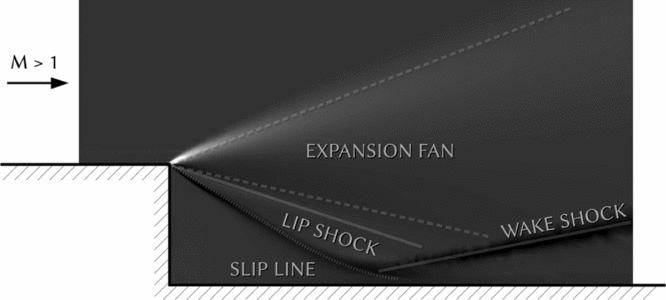
The results obtained from the two-channel flow test cases provide valuable insights into the qualitative description of the flow around the step corner in the case of the recessed-step nozzle. Similarly to the pressure profile reported in Fig. 12(b), the pressure profile of Fig. 6(a) shows a dent close to the step edge, i.e. an overexpansion followed by a recompression which can be reasonably associated to the presence of the lip shock. The orientation of the lip shock is strongly dependent on the Mach and Reynolds number of the flow past the step. As documented in Refs 7 and 27 about uniform supersonic flows around backward-facing obstacles, for a given freestream Mach number, the lip shock is directed downward at the high Reynolds number but turns upward and decreases in strength as the Reynolds number decreases. The flow configuration resulting from test case 1 (Fig. 14) closely follows the scheme proposed in Ref. 7, with the lip shock located between the expansion fan and the shear layer dividing the recirculation region and the outer part of the boundary layer. In the case of the recessed-step nozzle of interest here, the relatively low Mach number (~1.04) at the step location, combined with the small size (0.1 mm) of the obstacle (the Reynolds number based on the step height is ~3,500) result in flow features of lower intensity. Thus, the schlieren visualisation and the computed flowfield do not clearly display the orientation and shape of the lip shock, and the observed flow pattern is the one sketched in Fig. 10.
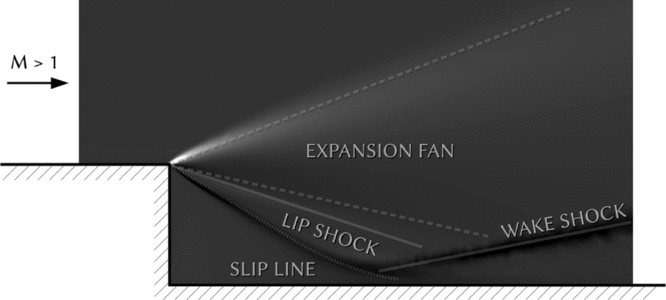
Figure 14. Qualitative representation of the supersonic flow at the recessed step location according to the schematisation proposed in Ref. 7.
3.2 Assessment of the influence of the step height on nozzle flows
In all the experimental runs reported in the present work, the height of the recessed step at the nozzle throat is h = 0.1 mm (2.0% of the throat half-height). Numerical simulations are used here to examine two recessed-step configurations at varying height of the step, 0.2 mm (2h configuration) and 0.05 mm (h/2 configuration). Similarly to the previous paragraphs, the analysis is restricted to adapted flow conditions.
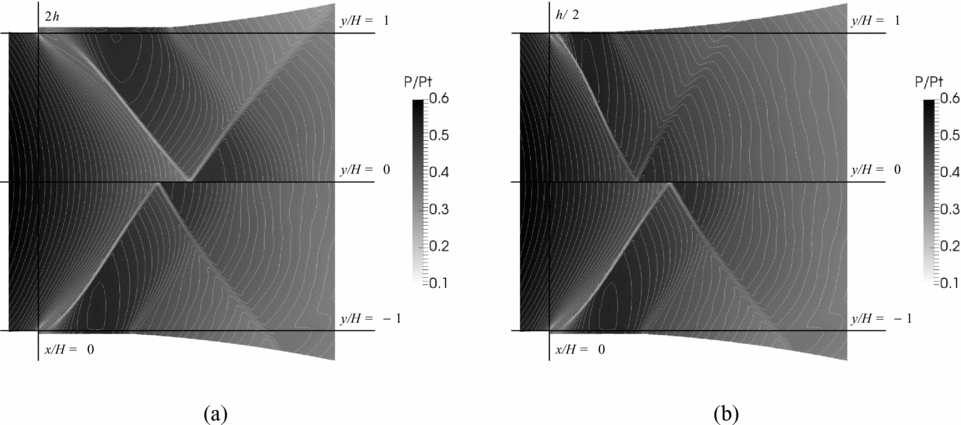
In Fig. 15, a detailed view of the calculated pressure fields (static to total pressure ratio) in the throat region close to the recessed-step location is reported. Results obtained for the 2h and h/2 configurations are compared to the reference (h) configuration. Inspection of the calculated flow-field reveals that, as expected, the length of the recirculation region past the step edge decreases at decreasing height of the recessed step. In equivalent terms, the axial position of the reattachment point moves upstream at decreasing height of the obstacle. As a result, the inter-action between the wake shock, which originates at reattachment, and the expansion fan emanating from the step corner yields different orientations of the coalesced oblique shocks. Namely, if the reattachment point moves downstream, then the inter-action between the expansion fan and the wake shock is more significant and, therefore, the coalesced shock is deflected farther downstream.
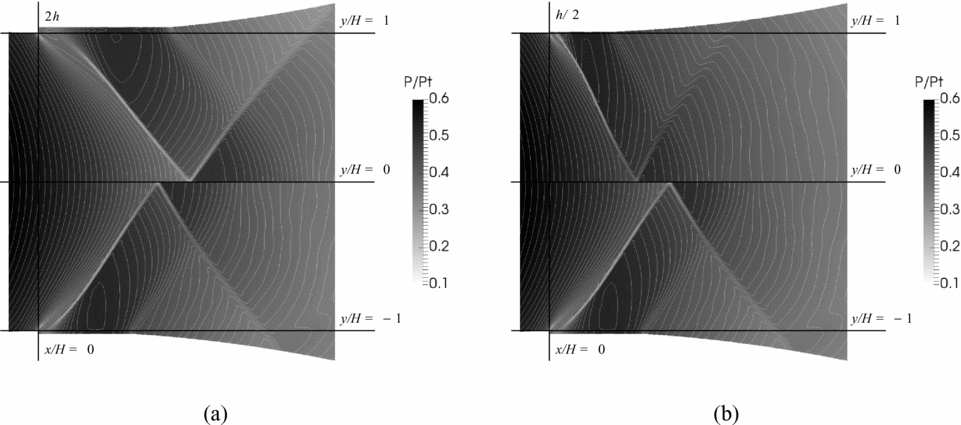
Figure 15. P/P T in adapted conditions in the throat region, close to the recessed step location. (a) 2h (top) and h (bottom) configurations. (b) h/2 (top) and h (bottom) configurations.
The influence of the recessed step height on the adapted nozzle flow is evaluated by comparing a set of flow variables calculated in the 2h, h and h/2 configurations.
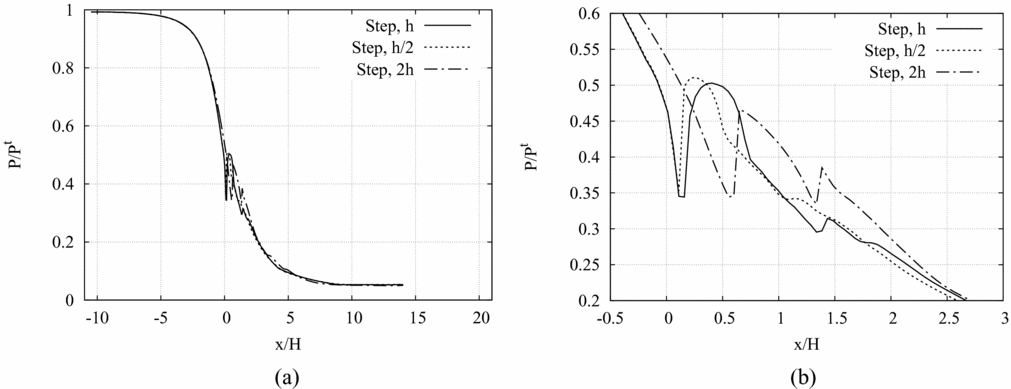
The pressure along a horizontal axis placed at 95% of the throat half-height (y/H = 0.95, i.e. 0.025 mm distance from the step corner) is given in Fig. 16(a) and a detailed view of the throat region is provided in Fig. 16(b). The height of the recessed step influences the position and the intensity of the wake shock (see Fig. 16(b)), namely the wake shock occurs farther downstream and with a lower intensity at increasing height of the step. The perturbation waves originating at the throat exhibit a different reflection pattern at varying height of the step. Though, the pressure profiles of Fig. 16(a) clearly show that, sufficiently far from the throat region, the effect of the perturbation introduced by the step is dissipated and the pressure profiles computed for the three recessed-step nozzles overlap.
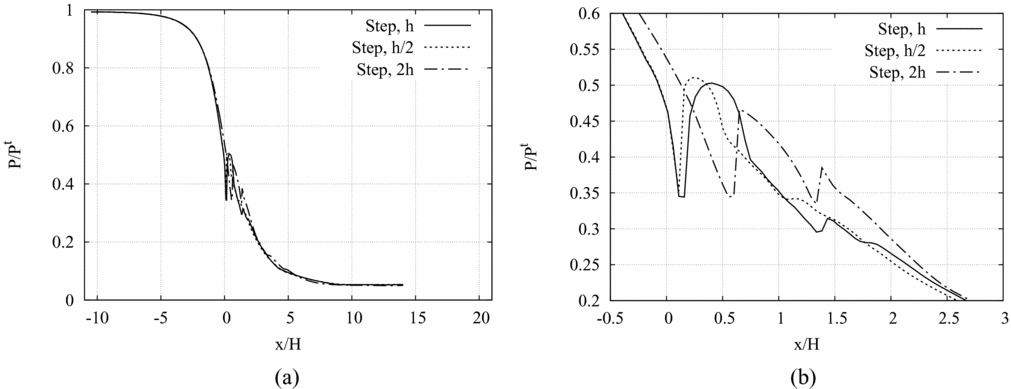
Figure 16 (a), (b) P/P T along a horizontal axis placed at 95% of the throat half-height (y/H = 0.95, i.e. 0.025 mm from the step corner) in adapted conditions for three recessed-step configurations: h/2, h and 2h. (b) Detailed view of the throat region.
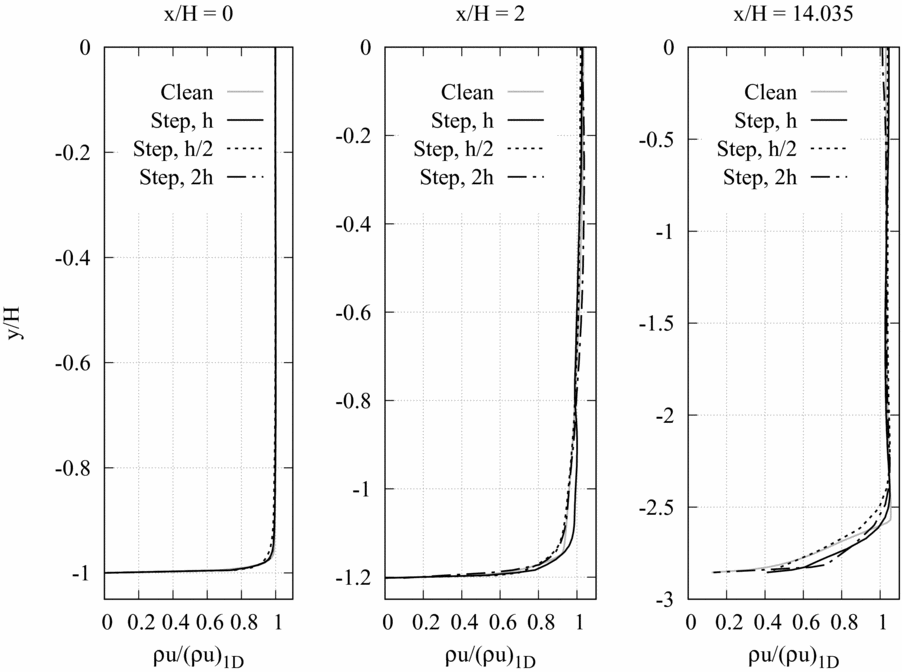
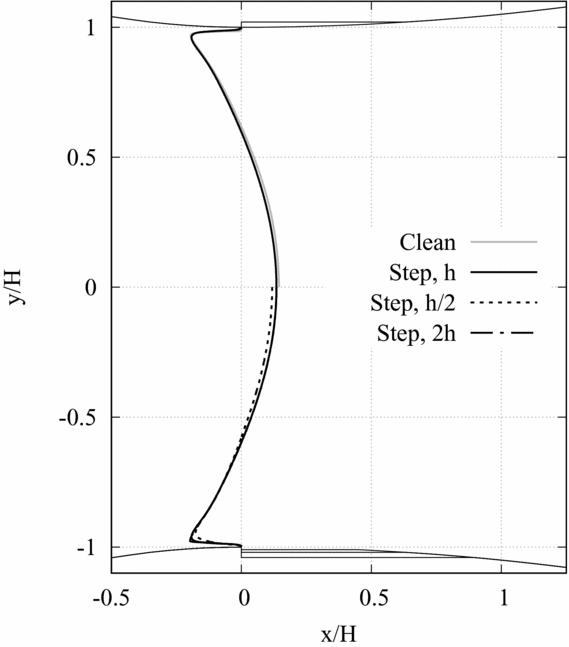
In Fig. 17, the profile of the momentum density in streamwise direction at the geometrical throat (x/H = 0), in the divergent section at x/H = 2 and at the nozzle exhaust (x/H = 14.035) is reported. At the three selected locations, the local value of the momentum density in streamwise direction ρu obtained from numerical simulations is made dimensionless with respect to the corresponding momentum density computed from quasi-one-dimensional theory (ρu)1D. In Fig. 18, the sonic lines obtained for the clean configuration and at varying heights of the step (h, h/2 and 2h) are compared. Results of Figs 17 and 18 display no significant differences in the inviscid core. The shape of the throat section is seen to influence the momentum density profiles and the sonic lines in the boundary-layer region only, where the most relevant discrepancies between the calculated flow variables are observed.
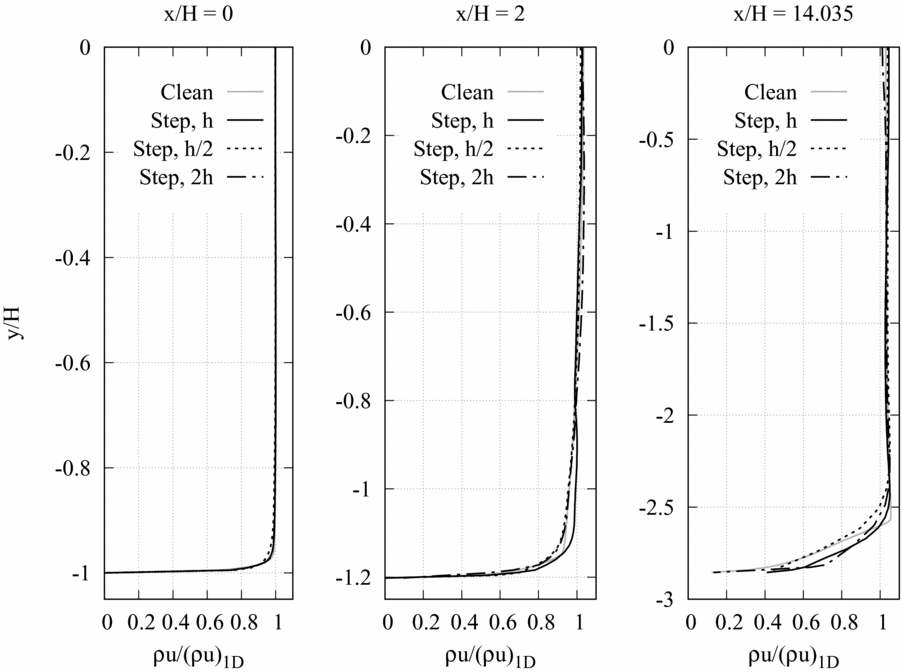
Figure 17. Momentum density in streamwise direction at three different stations: x/H = 0 (throat), x/H = 2 (10 mm downstream of the throat), x/H = 14.035 (exhaust).

Figure 18. Sonic lines for four configurations: clean configuration and h, h/2 and 2h recessed-step configurations.
4.0 CONCLUSIONS
Experiments and numerical simulations were applied to the analysis of the flow in a planar converging-diverging nozzle in the presence of a small recessed step at the throat section. The nozzle operated with dilute dry air and the height of the recessed step was 0.1 mm, i.e. 2% of the throat section. Experimental investigations were carried out in the blow-down TROVA at Politecnico di Milano and included pressure measurements along the nozzle axis and schlieren visualisations. Adapted flow conditions for the recessed-step and the clean nozzles were simulated numerically with the open-source SU2 software and results compared to the measurements performed on the two different geometries in both adapted and off-design conditions.
The nature of the complex perturbation wave system originating at the step location was investigated by means of schlieren visualisations and numerical simulations. The flow undergoes a supersonic expansion at the step corner. Past the step, the curvature of the separated region originates a system of compression waves, which finally coalesce into an oblique shock. Pressure measurements along the nozzle axis and numerical results were used to quantify the influence of the presence of the recessed step on the pressure field in the diverging portion of the nozzle. The pressure profile along the axis exhibits a small dent in the close proximity of the throat section (axially located at the inter-section of the oblique shocks emanating from the reattachment points), but it superimposes to that obtained by the clean configuration immediately downstream of the nozzle throat.
A numerical analysis of the nozzle flow in the presence of recessed steps of 0.05 mm and 0.2 mm (respectively half and twice the height of the reference one) pointed again at the local nature of the effects of the obstacle, though a significant variation in the layout of the perturbation wave pattern at varying step height is observed.
ACKNOWLEDGEMENTS
The research is partially funded by the European Research Council under Grant ERC Consolidator 2013, project NSHOCK 617603. The authors would like to thank Margherita Carmine and Renata Cheli for their help during the experimental trials.


