NOMENCLATURE
- slpm
standard litre per minute
- NOx
nitrogen oxide
- eiNOx
emission index of nitrogen oxide
- ICCD
intensified charge-coupled device
- IGCC
integrated gasification combined cycle
- SNG
synthetic natural gas
- CCS
carbon capture and storage
Symbols
-
 $$\dot{V}$$
volume flow rate
- f
F number
- OH
hydroxyl
- C
speed of sound
- γ
adiabatic index
- L c
combustor length
- L i
ith acoustic energy loss
- R
gas constant
- T
temperature

1.0 INTRODUCTION
1.1 Background
Renewable and alternative fuels such as synthetic gas (syngas; composed of H2 and CO), synthetic natural gas (SNG; composed of H2 and CH4) and biomass are promising solutions to global climate issues. In the research field of gas turbines, interest in such energy resources has increased in recent years. Conventional burners use solid fuels such as coal, are inefficient and emit a large amount of pollutants, including soot, which is the final product of combustion. SNG plants have recently been highlighted as an alternative to conventional burners. An SNG plant converts coal into gaseous fuel while applying the carbon capture and storage (CCS) technique, which eliminates the need to remove carbon and sulphur( Reference Liu, Cui, Yao, Yu, Su and Xu 1 ). SNG as fuel is stable and storable, and lead to fewer emissions because methanation and CO shift remove the CO and CO2 generated by coal oxidation. The first SNG plant was built in North Dakota, USA, and 15 plants are in operation today( Reference Vitasari, Jurascik and Ptasinski 2 ).
A gas turbine system has many advantages. For example, renewable resources can be used in it, and it is highly efficient (60%) when combined with a steam turbine. Moreover, the duration between the starting of the engine and its attainment of maximum power is relatively short compared with that in a conventional burner. The size of the system is not too large either, i.e. the site for a gas turbine plant need not be vast. However, emissions and combustion instability have recently been identified as problems in gas turbine systems because the operation environment involves a high pressure and temperature.
NOx and CO are exhaust gas emissions that cause pollution and the destruction of the ozone layer. NOx is generated through three mechanisms (thermal, prompt and fuel NOx); however, about 80–90% of the generated NOx is thermal NOx, which is generated in high-temperature environments in combustors( Reference Khalil and Gupta 3 ). NOx emission irritates the human eye and respiratory system, in addition to destroying plants and causing acid rain. CO is emitted as a colourless and tasteless gas, and is the most common cause of fatal air poisoning in many countries( Reference Omaye 4 ). Therefore, it is important to study the characteristics of such emissions and ways to reduce them.
Combustion instability occurs through interactions between pressure and heat-release oscillation in a combustor. When the oscillation is too high, the combustor’s liner and the blade of the turbine can be damaged. Even at a low amplitude of combustion instability, the oscillation may have a high amplitude. Therefore, it is important to investigate the characteristics of combustion for various fuel compositions and combustor geometries.
1.2 Past research on H2/CH4 combustion in gas turbine
Many research groups have studied combustion in gas turbines to understand the emission characteristics and combustion instability of fuels having various compositions.
Cheng et al reported that NOx emissions are linearly dependent on the temperature of the adiabatic flame in low-swirl-injected lab-scale gas turbine combustion. They observed a shift in a lifted low-swirl flame at the exit of the nozzle with increasing H2 content in the fuel, and the flame was observed to attach onto a dump plane for 100% H2 fuel( Reference Cheng, Littlejohn, Strakey and Sidwell 5 ). Coppens et al experimentally studied NO concentration in various flame shapes and found that NO concentration is a function of the equivalence ratio. The Zeldovich thermal NOx mechanism was found to be dominant in stoichiometric conditions, whereas the Fenimore prompt NO mechanism was dominant for equivalence ratios ranging from 1.3 to 1.4. A high H2 content of the fuel did not affect NO concentration in lean flames, whereas the NO concentration in rich flames decreased considerably with increasing H2 content( Reference Coppens, Ruyck and Konnov 6 ).
In the context of combustion instability, Shanbhogue et al experimentally studied a fixed-swirl-angle combustor at atmospheric pressure and temperature. Combustor transitions to periodic oscillation occurred as the equivalence ratio increased to 0.65( Reference Shanbhoguea, Sanusi, Taamallaha, Habib, Mokheimer and Ghoniem 7 ). Dowling and Langhorne et al pointed out that low-frequency instability of combustion occurs in the afterburner of aero-engines with a high equivalence ratio, and it is called reheat buzzing instability( Reference Langhorne 8 , Reference Blixsidge, Dowling and Langhorne 9 ). Figura et al reported that the centre of heat release is an important factor for predicting combustion instability. The centre of heat release moves with respect to the operation conditions and fuel composition( Reference Figura, Lee, Quay and Santavicca 10 ). Lee et al found that the convection and skewness time are key parameters determining frequency mode shift. They conducted an experimental study in a gas turbine combustor and applied OH PLIF and POD to determine reasons for the frequency mode shift phenomenon( Reference Lee, Yoon, Joo, Kim, Hwang and Yoon 11 ). Moreover, many researchers have studied the characteristics of combustion using experimental( Reference García-Armingol, Ballester and Smolarz 12 – Reference Daniele, Jansohn, Mantzaras and Boulouchos 20 ), analytic( Reference Ströhle and Myhrvold 21 , Reference Theofilis, Barkley and Sherwin 22 ) and computational( Reference Arghode and Gupta 23 – Reference Saboohi and Ommi 25 ) approaches.
This study investigates the characteristics of frequency mode shift for various combustor lengths, heat loads and fuel compositions (H2/CH4 ratio). To investigate reasons for the frequency mode shift, a high-speed camera was used to obtain OH* chemiluminescence images and the Abel inversion process was applied. The laminar burning velocity of the flame was also calculated to investigate the relation between convection time and frequency mode shift( Reference Aliyu, Nemitallah, Said and Habib 26 ).
2.0 EXPERIMENTAL APPARATUS AND METHODS
2.1 Experimental setup
A model gas turbine combustor was manufactured for the experimental study, as shown in Fig. 1. The flow rates of fuel and air were controlled using mass flow-rate controllers (MFC; air: Bronkhorst, F-206BI, fuel: Parker, Porter-200), and an air heater constantly supplied heated air at a temperature of up to 200±3°C. The fuel consisted of H2 and CH4, which were mixed in the MFCs. The fuel mixture was injected into the combustion zone through 14 holes, each measuring 1.78 mm in diameter, in the cross air flow jet pattern. The injection holes were located 2.7 mm upstream of the dump plane, which can make partially premixed flame. The swirl vane was angled at 45°, and the swirl number of the nozzle was approximately 0.8. To visualise the flame, a circular quartz tube was installed at the front of the combustor’s dump plane. Cooling air (V ̇cooling_air=900 slpm) was injected onto the quartz surface to avoid thermal damage from the flame. A plug nozzle blocked 90% of the combustor’s outlet to create an acoustic boundary and could move back and forth. The combustor’s length was defined as the distance between its dump plane and the plug nozzle because the fuel–air nozzle also had an acoustic boundary. The definition of the combustor length was validated by comparing the frequency of experimental instability to the calculated longitudinal instability mode frequency obtained using this length. Eleven dynamic pressure sensors (PCB 102A05) and five thermo-couples (K type and R type) were used to measure the fluctuating pressure and temperature, respectively, and their positions are shown in Fig. 1.
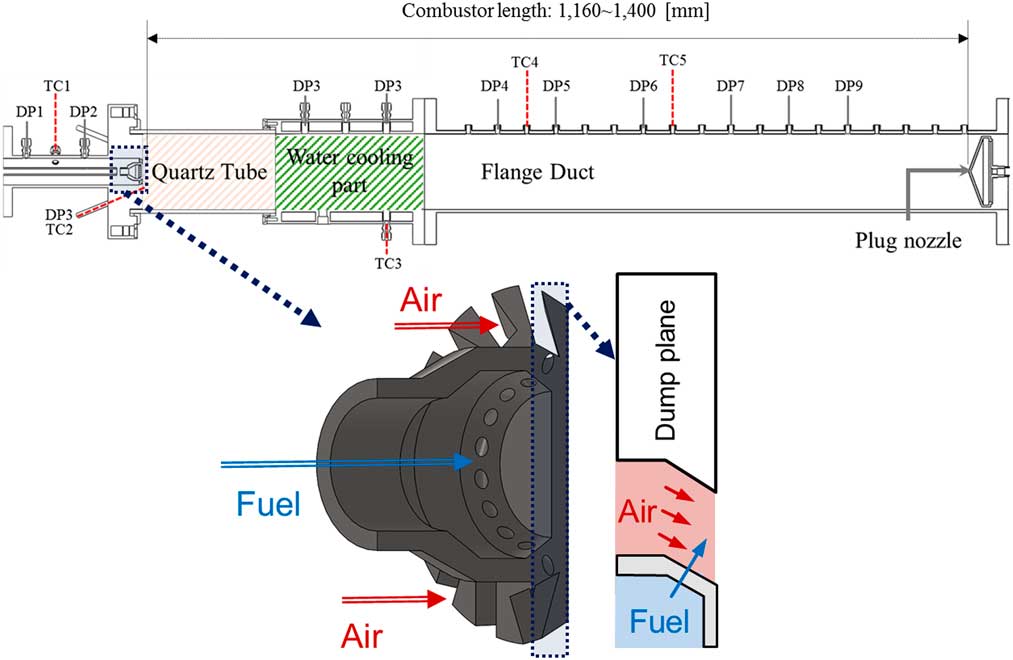
Figure 1 Schematic of model gas turbine combustor and sensor position.
A gas analyser (TESTO 350K) was set up to measure the exhaust emissions of NOx in dry gas using a drying sampling tube (NOx sensor; measurement range: 0–4,000 ppm, resolution: 0.1 ppm) and CO (CO sensor; measurement range: 0–10,000 ppm, resolution: 1 ppm). NO2 is more stable than NO, and NO is continuously converted to NO2 by reacting with O2 in the high-temperature combustion zone. Therefore, the measurement of exhaust emissions must be made at the final stage of the combustor to obtain accurate results. For this purpose, the sensing probe of the gas analyser was installed at the rear of the combustor, where the chemical reaction had been completed.
A high-speed ICCD camera (high-speed star 8; 1,024×1,024 pixels, 1 kHz) with an intensifier (high-speed IRO) was used to capture images of the flame through a quartz tube. An f/2.8 UV lens and an OH bandpass filter (307±10 nm) were installed on the camera to obtain chemiluminescence signals of the OH radical. The OH chemiluminescence signal represented the heat-release characteristics of the combustion zone. In other words, this signal could be used to identify the structural characteristics of the flame.
2.2 Test conditions
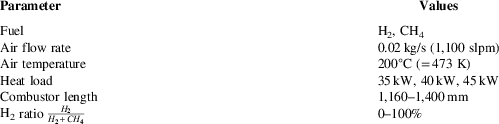
To obtain maps of the combustion stabilities of H2 and CH4 (purity; H2>99.5 mole%, CH4>99.5 mole%) on the model gas turbine combustor, several variations were selected in this study. The combustion air temperature was 200±3°C, and the mass flow rate was 0.02 kg/s (volume flow rate: 1,100 slpm). Thermal loads of 35 kW, 40 kW and 45 kW were considered to study the relation between thermal load and combustion instability. Since the test was conducted at a lab scale, the test pressure was maintained at 1.1–1.3 atm depending on the fuel composition because of the instantaneous combustion pressure in the combustion zone and the acoustically closed plug nozzle. Moreover, the H2 and CH4 contents were varied, and the H2 ratio was defined as the ratio of the volumetric flow rate of H2 to the sum of those of H2 and CH4. The fuel compositions varied from 100% CH4 to 100% H2. In other words, the H2 ratio was varied from 0% to 100% in increments of 12.5%. The combustor’s length was the main variable in this study because the geometric conditions of the combustor influenced the mode frequency of combustion instability; the length was varied from 1,160 mm to 1,400 mm in increments of 15 mm. Table 1 summarises the experimental conditions. To determine the characteristics of the flame under these test conditions, images of the flame, mode analysis and CANTERA-MATLAB were used.
Table 1 Experimental test conditions
2.3 Methods
Emissions of exhaust gases such as NOx and CO were converted from their original values to 15% O2 correction by using Equation (1) to compare the experimental results:
 $${\rm Emission}_{{{\rm ppm }\,@\,x\,\%\, O_{2} }} {\equals}\left( {{\rm Emission}_{{{\rm meas}{\rm .}}} } \right){\times}\left\{ {{{20.9{\minus}x} \over {20.9{\minus}100 \cdot \left( {O_{{2,{\rm meas}.}} } \right)}}} \right\}$$
Here, emissionmeas. denotes the emission measured by the gas analyser, and x is the conversion value. The objective of this conversion was to regulate NOx or CO emissions from the gas turbine, heater and boiler systems( Reference Ströhle and Myhrvold 21 ). The conversion value was 3% O2 in the case of the heater and boiler, whereas it was 15% O2 in the case of the engine and the gas turbine( Reference Turns 27 , 28 ).
To analyse the mode frequency, Equation (2), which represents the longitudinal mode frequency in the case of closed boundary conditions, was used to calculate the instability frequency:
 $$f{\equals}{{n \cdot c} \over {2 \cdot L_{c} }},{\rm }\,n{\equals}1,{\rm }2,{\rm }3,{\rm }\,\ldots\,,{\rm }c{\rm }{\equals}\sqrt {{\rm \rgamma } \cdot R \cdot T_{{\rm c}} } $$
γ is the adiabatic index, R is the gas constant, L c is the combustor length from the dump plane to the acoustic plug nozzle and c is the speed of sound in the combustion zone. The temperature used in Equation (2) was obtained from the experimental data. The value of T c was calculated based on the mean value of the temperature measured using the thermo-couple installed from the dump plane to the plug nozzle.
The Abel inversion process was applied to obtain 2D images from 3D accumulated images that were acquired using a high-speed camera. To capture the averaged flame images, the high-speed camera captured images for one second at a rate of 1 kHz with full CCD resolution. The averaged images were calculated using cross-sectional radical information( Reference Hansen and Law 29 ).
Figure 2 shows a time-averaged OH chemiluminescence image and its Abel-inverted image under a heat load of 40 kW, an H2 ratio of 75%, and combustor length of 1,400 mm.
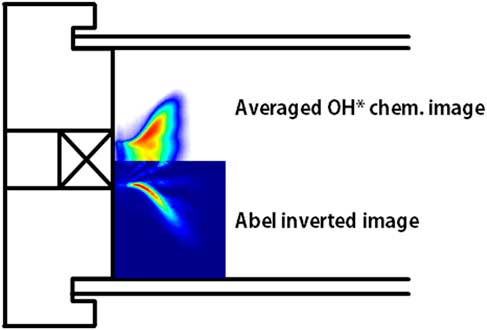
Figure 2 Time-averaged OH chemiluminescence and Abel-inverted image at a heat load of 40 kW, H2 ratio of 75% and combustor length of 1,400 mm.
3.0 RESULTS AND DISCUSSION
3.1 Exhaust gas emission
The emission index of nitric oxide (eiNOx) is defined as grams of NOx emitted per kg of burned gas, which can be used as an indicator of the exhaust gas in various combustion environments. It is important in combustion research to determine the eiNOx data at the scaling formulation to predict the amount of NOx emissions because it is the relative value used to compare varying compositions of fuel( Reference Naha and Aggarwal 30 ):
 $${\rm eiNO}{\rm x}{\equals}{{{\minus}\int {M_{{NO}x}}\dot{\omega}_{{{NO}x}} {\rm d}x} \over {{{\minus}\int {M_{fuel}}{\dot{\omega }}_{{{fuel}}} {\rm d}x}}$$
where M denotes the molecular weight of each gas and
 ${\rm \dot{\omega }}$
is the production or consumption rate in the combustion zone.
${\rm \dot{\omega }}$
is the production or consumption rate in the combustion zone.
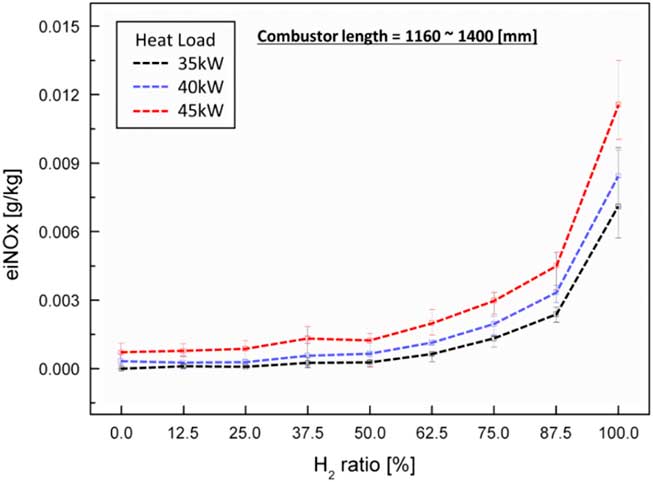
Figure 3 shows the experimental results for heat loads of 35 kW, 40 kW and 45 kW for different lengths of the combustor. The average emission values at each test condition are represented by the dotted line, and the minimum–maximum values are plotted in Fig. 3. Relatively high eiNOx emissions were observed at a high heat load and high H2 ratio at the tested combustion temperature. The thermal NOx mechanism was the major one in NOx generation in these experimental tests. The adiabatic flame temperature was higher than 1,200°C under all test conditions. The caloric value of the H2 fuel was greater than that of the CH4 fuel. In other words, a higher ratio of H2 resulted in a higher flame temperature. The variation in combustor length from 1,160 mm to 1,400 mm did not influence the characteristics of NOx emission. According to the mechanism of thermal NOx (Zeldovich’s mechanism), its temperature and time of residence in the combustion zone determined the characteristics of NOx emission. That is, the chemical reaction in the combustion zone is important for these characteristics. However, the length of the combustor used in this study was greater than the flame length. The eiNOx associated with a non-premixed turbulent jet flame is proportional to the global residence time L f/U F. However, the fuel–air injector used in the experiments was of a partially premixed injecting type with strong swirl number in spite of a very short mixing length. The swirl number can be calculated from the following equation:
 $$S_{n} {\equals}{2 \over 3}\left[ {{{1{\minus}\left( {D_{{{\rm swirl\_in}}} \,/\,D_{{{\rm swirl\_out}}} } \right)^{3} } \over {1{\minus}\left( {D_{{{\rm swirl\_in}}} \,/\,D_{{{\rm swirl\_out}}} } \right)^{2} }}} \right]{\rm tan{\leqslant}} \rphi$$

Figure 3 Characteristics of eiNOx emission with respect to H2 ratio and heat load.
D swirl_in, D swirl_out and ф are the inner diameter of the swirler, the outer diameter of the swirler and the swirl vane angle, respectively. From Equation (4), the swirl number is about 0.83, which is sufficiently high to make a premixed flame. Therefore, eiNOx was mainly influenced by the flame temperature, which is determined by thermal NOx (Zeldovich’s mechanism), rather than flame length.
In the case of H2 flame, the flame length was shorter than the CH4 flame length. When the H2 ratio was higher, a higher eiNOx was measured because the eiNOx strongly depended on the flame temperature, rather than the combustor length, in the experiments. Therefore, the variation in combustor length in this study did not affect the flame shape, length characteristics and flame temperature. Consequently, the combustor length did not affect the thermal characteristics of the emission of NOx.
In contrast to the characteristics of the emissions of NOx, CO emission was less than 3 ppm under all test conditions. CO was generated by incomplete combustion. The equivalence ratio in the test ranged from 0.4 to 0.6. Therefore, if all reactants were well mixed, the amount of CO emission was small. The gas turbine combustor had a partially premixed nozzle with a short mixing length. Nevertheless, the swirled vane intensified swirling flow, and the fuel and air mixed well. Therefore, CO emission was negligibly low for all experimental conditions.
3.2 Shift in combustion instability mode with H2 ratio
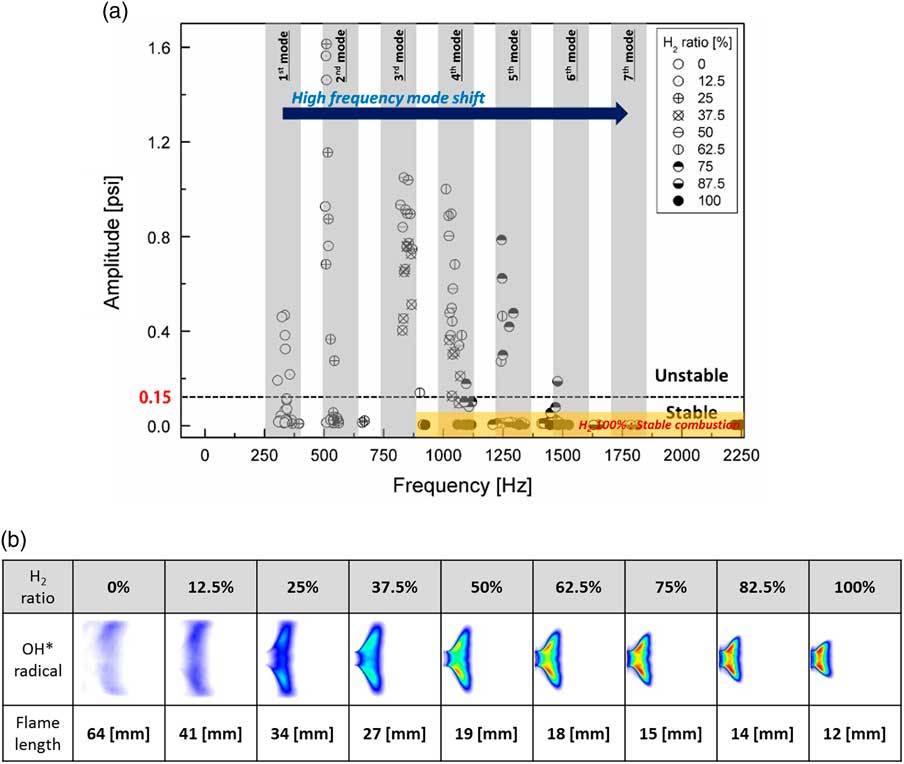
Figure 4(a) shows the maximum amplitude of the fast Fourier transform (FFT) at the third dynamic pressure sensor (DP3), which was placed on the dump plane, where dynamic pressure data were measured for one second. Figure 4(b) shows radial images of the flame’s OH chemiluminescence and flame length, which was post-processed by the Abel transform. The combustion instability criterion was defined as a root mean square (RMS) value of the FFT amplitude higher than 0.15 psi. As per legislation, the criterion of industrial gas turbine combustion instability was an oscillation of static pressure of the combustor liner greater than 3–5%( Reference Lieuwen 31 ).

Figure 4 (a) Mode analysis based on the amplitude of a dynamic sensor and (b) flame structure with respect to H2/CH4 ratio and combustor length at a heat load of 40 kW.
The frequency of the theoretical longitudinal instability of the combustor is represented by the grey rectangular area in Fig. 4(a) because the combustor length affected the longitudinal frequency mode. The experimental conditions are denoted by circular marks. The flame length was calculated using the OH* radial images and was defined as the distance between the dump plane and the flame centre of OH* intensity. The combustion instability frequency mode shifted from the first to the seventh mode as the H2 ratio increased from 0% to 100%. However, the amplitude of combustion instability for 100% H2 fuel was low compared with that for the other test conditions in which CH4 was included in the fuel. Almost all instability amplitudes of 100% H2 fuel were under 0.01. Convective time was an important parameter for combustion instability in time-lag analysis. It was also directly influenced by and proportional to the flame’s length. If the flame is very short, the convective time is short as well. This process rendered very short the time between a fluctuation in the heat released by the flame and that in its pressure in the combustion zone. Therefore, H2 with a high burning velocity affected the high-frequency mode shift of combustion instability. The effect of H2 composition on the frequency of combustion instability has been studied by many research groups. Lieuwen claimed that the mixture velocity of fuel and air at the inlet affected the frequency mode shift( Reference Lieuwen 32 ), and Yoon reported the importance of convective time as a parameter of instability frequency( Reference Yoon, Joo, Kim, Lee, Lee and Yoon 33 ). The total time delay consisted of various delay times (acoustic time, convective time, ignition time and so on). Higher-frequency transition phenomena mainly depend on the convective time among the delay times. In a conventional premixed combustor, the fuel–air mixing length mainly affects the convective time since the mixing length was greater than the flame length. In contrast, the change of the flame length with H2 ratio in a partially premixed combustor has a major effect on the convective time because of the very short mixing length (L mixing length=2.7 mm).
Figure 5 shows the frequency of instability during the variation in combustor length from 1,160 mm to 1,400 mm at a heat load of 35 kW and H2 ratio of 37.5%. The dotted line shows the longitudinal frequency calculated using Equation (2). The theoretically calculated values were overestimated compared with the experimental dataset because the temperature in Equation (2) was used only as the third thermo-couple value in Fig. 1. However, the trend of a reduction in frequency in the experimental data was confirmed to be similar to the calculated trend, and the frequency of instability was shown to be the longitudinal mode frequency.
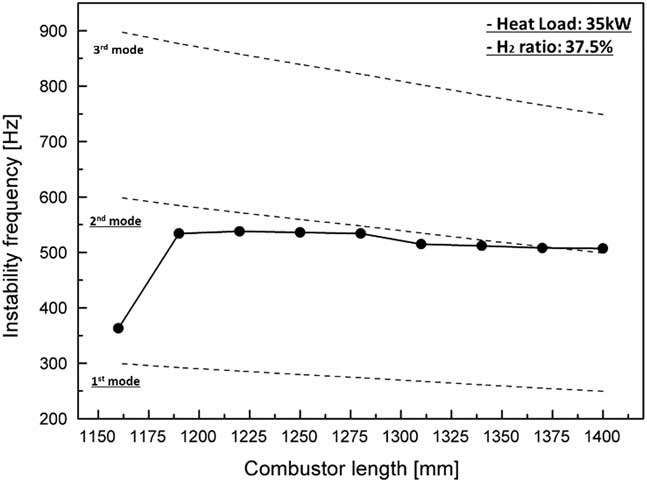
Figure 5 Frequencies of combustion instability for various combustor lengths with a heat load of 35 kW and H2 ratio of 37.5%.
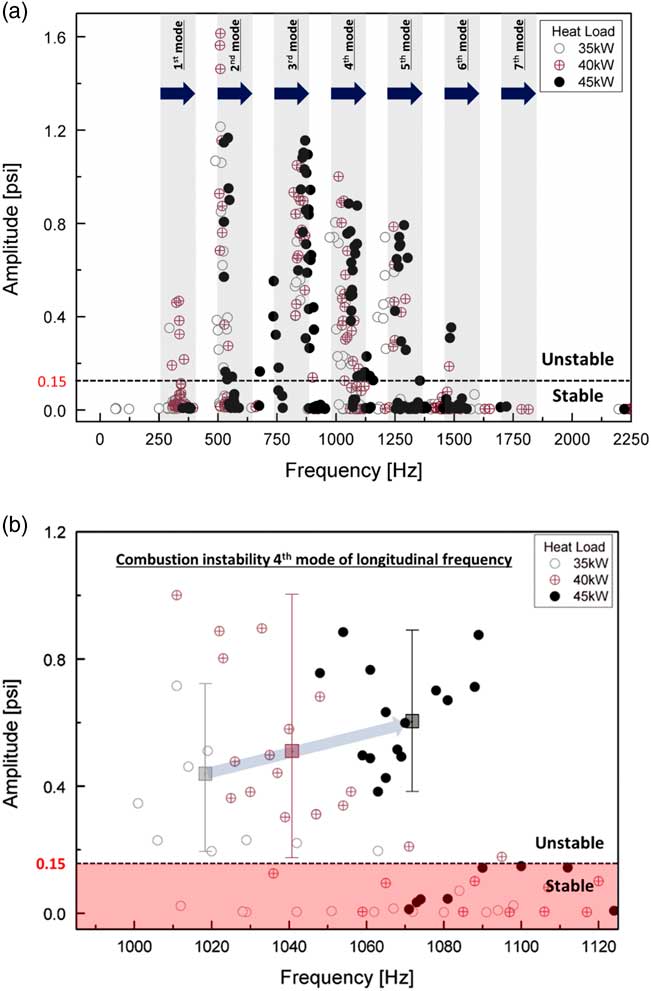
OH-chemiluminescence image acquisition and flame-length calculation were performed as shown in Fig. 4(b) to investigate the effect of convective time of the fuel–air mixture with regard to the H2 ratio in the partially premixed fuel–air nozzle. In addition, the combustion instability frequency does not shift to a higher mode as the combustor length is changed as in Fig. 6, and it is experimentally confirmed that the length of the combustor does not affect the combustion instability and length of the flame.

Figure 6 (a) Mode analysis based on the amplitude of a dynamic sensor with respect to the heat load and (b) a detailed view of the combustion instability of the fourth mode of longitudinal frequency.
3.3 Combustion instability mode shift for different heat loads
Equation (5) is the definition of the Rayleigh criterion, which describes combustion instability:
 $$\mathop{\int}\limits_V {\mathop{\int}\limits_T {p{'} \left( {x,t} \right)q{'} {\rm (}x,t{\rm )d}t{\rm d}V} } \geq \mathop{\int}\limits_V {\mathop{\int}\limits_T {\mathop{\sum}\limits_i {L_{i} (x,t){\rm d}t{\rm d}V} } } ...$$
where p′ is the instantaneous oscillation in the pressure of the combustor, q′ is the heat-release oscillation and L is the loss of acoustic energy through processes such as damping and viscous dissipation( Reference Nicoud and Poinsot 34 ). When the value of the right-hand side of Equation (5) exceeds that of the left-hand side, combustion instability occurs. In other words, the increase in the heat load increases the heat-release oscillation in the acoustic field, and can increase the amplitude of combustion instability. On the contrary, combustion instability did not occur at a 100% H2 ratio, even though a high heating value of H2 was applied. Hydrogen has a high burning velocity and high extinction rate compared with CH4; that is, a flame containing a high H2 composition is not easy to extinguish, and thus, the heat-release oscillation was low. Therefore, a 100% H2 fuel flame was very stable.
Figure 6(a) shows the results of the instability FFT mode analysis under all experimental conditions for heat loads of 35 kW, 40 kW and 45 kW. In the unstable region, the characteristics of instability frequency were similar at all heat loads in the same longitudinal mode. The increase in heat increased the flame temperature in the combustion zone and q′ in Equation (5), which induced a pressure fluctuation (p′). The temperature of the combustion zone increased the speed of sound of the combustion product, which is c in Equation (2). Therefore, the frequency of combustion instability increased at the same harmonic mode as the longitudinal mode. Moreover, the amplitudes of combustion instability increased with respect to the heat load, as shown in Fig. 6(b). The amplitude of combustion instability is related to the coupling between the fluctuation in pressure and that in heat release. Therefore, increasing q′ does not necessarily increase p′. However, when the phase between p′ and q′ was the same under various heat-load conditions, the amplitude of combustion instability was theoretically proportional to heat release. Therefore, the average amplitude of combustion instability at the same heat-load conditions increased with respect to this increase. The rate of fuel flow was low compared with that of air flow, and heat load was controlled to adjust fuel flow at a fixed rate of air flow. The variation in the velocity of the fuel–air mixture was small for each heat load at the inlet. Therefore, the heat load did not affect the frequency mode shift. Figure 7 shows the length and structure of the flame. As mentioned above, when the flame length was similar, the frequency mode shifting of combustion instability did not occur under different heat loads.
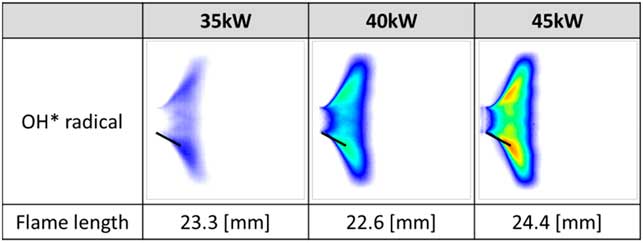
Figure 7 Length and structure of the flame at varying heat loads (35, 40 and 45 kW).
The laminar flame speed was the velocity at which the flame propagated through unburned reactants in the combustion zone. Flame length was dependent on the speed of the laminar flame and affected convection time (τ convtion=L flame/U) in time-lag analysis ( Reference Park and Lee 35 ). Figure 8 shows the characteristics of calculation of the laminar flame speed using GRI-3.0 in CANTERA-MATLAB code, where it was assumed that the fuel–air mixture was well mixed in the reactor and combustion was complete. The speed of the laminar flame affected the frequency mode shift from the fundamental mode to the sixth mode of longitudinal frequency. When this speed increased, convection time decreased because the flame length decreased. A higher H2 ratio and heat load increased the laminar flame speed by increasing the temperature of the combustion zone. In other words, the interval between the fluctuation in the fuel–air mixture in the combustion zone and that in heat release was shorter than the convection time. Therefore, the frequency mode was proportional to the speed of the laminar flame.
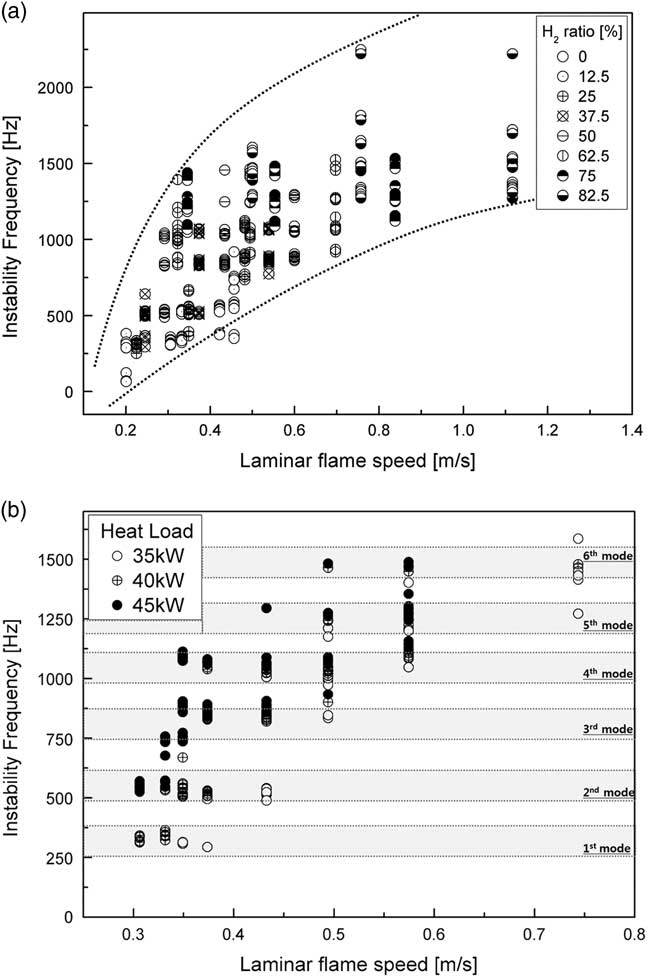
Figure 8 Instability frequency with respect to the speed of the laminar flame for different (a) H2 ratios and (b) heat loads.
3.4 OH* chemiluminescence (flame) characteristics
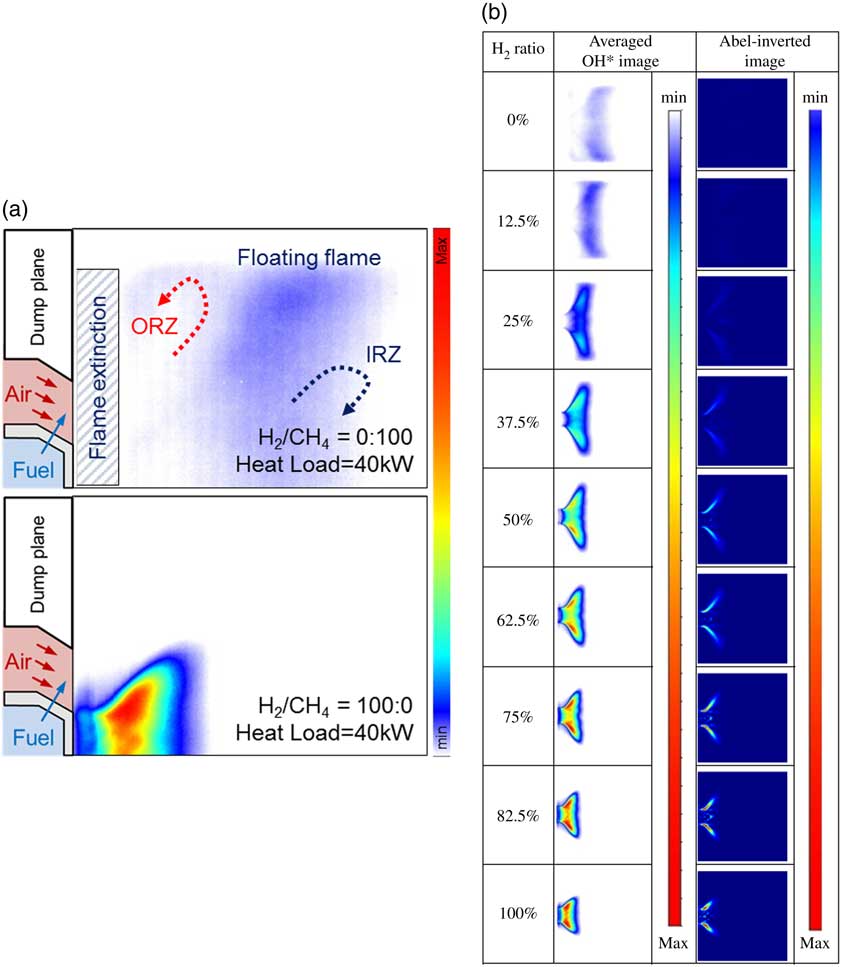
To investigate the characteristics of the flame, OH chemiluminescence images were acquired by using a high-speed ICCD camera; 500 pairs of instantaneous images were averaged, as shown in Fig. 9. Fuel with a relatively high H2 content had a higher burning velocity than CH4. That is, a high H2 ratio rendered the flame short, and it shrunk onto the dump plane (burning velocity; H2: 289 cm/s, CH4: 37 cm/s). In addition, the CH4 flame was more likely to be blown out than the H2 flame because the CH4 flame fluctuated near the fuel-air nozzle owing to the low burning velocity. However, the flame was anchored in the dump plane, as shown in Fig. 9(a), by the outer recirculation zone between the long CH4 flame and the quartz tube wall and the inner recirculation zone. In contrast, the H2 flame exhibited a wider range of stable flames owing to the increased hydrodynamic and diffusive thermal instability( Reference Manton, Von-Elbe and Lewis 36 ). Moreover, the intensity of OH chemiluminescence was low because of the broad radial distribution, although the heat load was constant. The mixture velocity is an important parameter that influences flame length. The high heating values of H2 and CH4 were 12.76 MJ/Nm3 and 37.75 MJ/Nm3, respectively. In other words, the flow rate of the fuel mixture increased with the H2 ratio. A high H2 ratio incurred a high mixture injection velocity at the nozzle, and a relatively long flame was formed at higher heat loads. However, in view of flame structure, the effect of fuel flow rate was smaller than that of fuel composition.

Figure 9 (a) Flame-structure characteristics between CH4 and H2 flames and (b) time-averaged OH* chemiluminescence and Abel-inverted images at a combustor heat load of 40 kW and a length of 1,400 mm.
The angle between the dump plane and the direction of main flow was defined as the flame angle. To determine the flame angle in accordance with the H2 ratio, the radial profiles of the OH radical concentration of the flame were acquired at y=8 mm, y=11 mm and y=14 mm from the dump plane, as shown in Fig. 10. At low H2 ratios such as 0% and 12.5%, the intensity of the OH radical was barely apparent near the dump plane. Further, the maximum value of OH intensity increased with increasing H2 ratio at y=8 mm and y=11 mm. However, the maximum value of OH intensity decreased rapidly at an H2 ratio of 100% at y=14 mm because the flame of the 100% H2 fuel was shorter than that at an H2 ratio of 87.5%. Therefore, the radial position of the OH radical was lower.
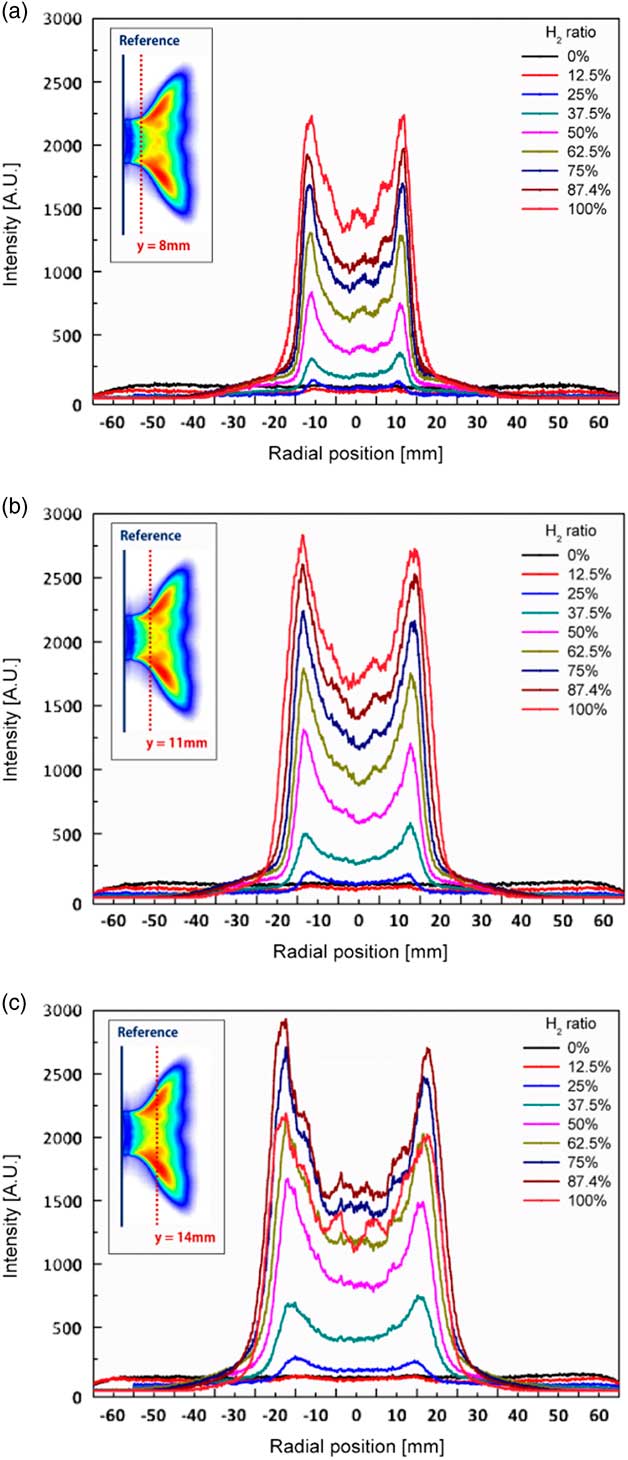
Figure 10 Radial profiles of OH radical concentrations of the flame at a combustor length of 1,400 mm for H2 ratios of (a) y=8 mm, (b) y=11 mm and (c) y=14 mm.
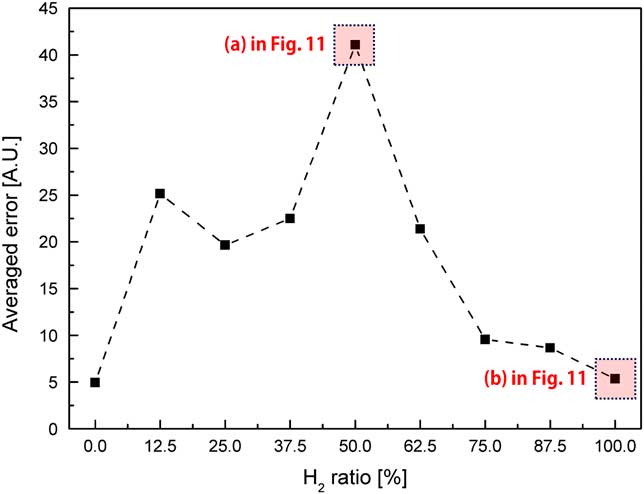
The variation in flame shapes in accordance with that in combustor length (1,160 mm, 1,280 mm and 1,400 mm) in the state of combustion instability was analysed. OH radical profiles were obtained at y=11 mm from the dump plane. A proper distance was selected to obtain the OH radical intensity at which the flame existed under all experimental conditions. Figure 11 shows the radial profiles of the characteristics of OH concentration for different combustor lengths: 1,160 mm, 1,280 mm and 1,400 mm. The OH radical profiles for each length of the combustor in Fig. 11(a) show different shapes, whereas those in Fig. 11(b) show similar characteristics. In terms of the combustion instability phenomenon, the flame strongly vibrated back and forth on the dump plane. On the contrary, a stable flame formed with similar structural characteristics is shown in Fig. 11(a). To compare the structural characteristics of the flame between stable and unstable conditions, the averaged error was defined as the error between sum of the intensity profiles and the average value of the sum of intensities. This error is shown in Fig. 12 with respect to the H2 ratio.
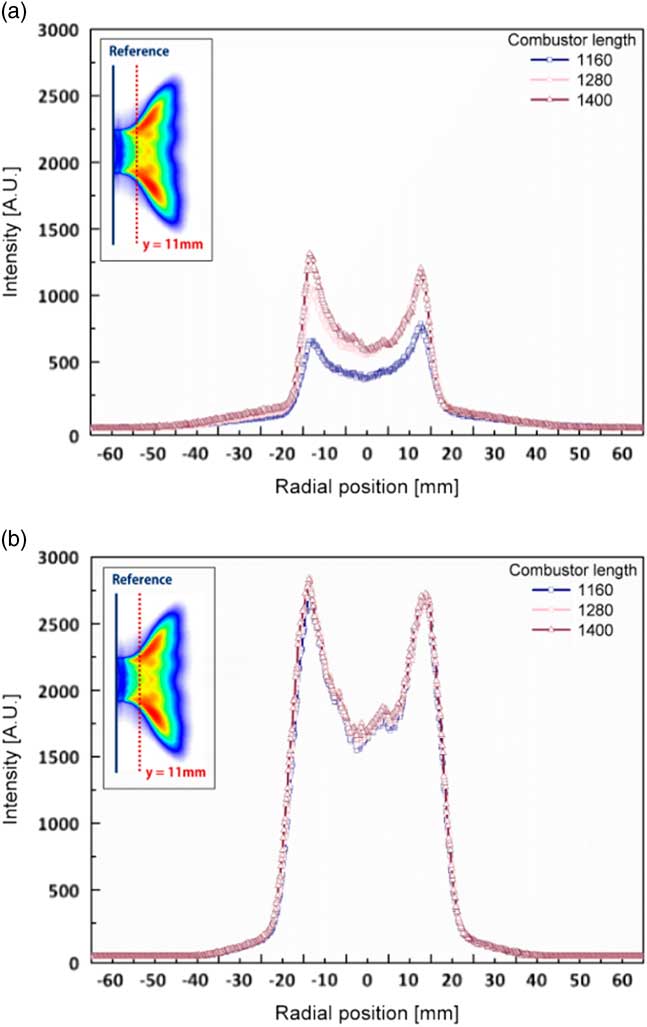
Figure 11 Radial profiles of OH concentration of the flame for different H2 ratios at y=11 mm from the dump plane. (a) H2 ratio=50% and (b) H2 ratio=100%.

Figure 12 Average error of the radial profiles of OH concentrations of flame for different H2 ratios at y=11 mm from the dump plane.
A high value of average error implied that the flame shapes were different for different combustor lengths; that is, as the average error was higher than the stable flames. In other words, a lower value of the average error indicated similar OH radical profiles for each combustor length. The average error was low for an H2 ratio of 0% (similar to that for an H2 ratio of 100%) because the signal of the OH radical was too low to compare among different combustor lengths. In other words, the distribution of the OH radicals and average error were sufficient to distinguish between a stable state and a state of combustion instability, which is confirmed in Figs 9–12.
4.0 CONCLUSION
Emission characteristics, including the relationship among combustion instability mode transition, combustor length, the characteristics of flame shape and the OH radical concentration of the flame, were analysed in this study experimentally under various test conditions in a model gas turbine combustor. The results are summarised as follows:
1. The length of the combustor did not affect eiNOx emission. The combustion reaction zone, where the fuel and the air were mixed and reacted chemically, was shorter than the length of the combustor used in this study. Therefore, the chemical reaction was complete regardless of this length. It was experimentally confirmed that the NOx mechanism was thermal NOx (Zeldovich’s thermal NOx mechanism) because higher NOx emissions were observed when the H2 ratio of the H2/CH4 mixture and the heat load increased, which influenced flame temperature. Moreover, CO emission was less than 3 ppm, as the equivalence ratio varied from 0.4 to 0.6 in all experimental conditions.
2. The frequency of combustion instability shifted to a higher longitudinal mode with an increase in the H2 ratio. The fundamental mode of the longitudinal frequency of the combustor occurred for an H2 ratio 0% in terms of fuel composition, which thus consisted of only CH4, and the frequency mode shifted up to the seventh longitudinal mode with an increase in H2 in fuel composition. This was verified by the theoretical formulation. However, the length of the combustor did not influence mode transition; only a slight frequency change was observed at the same frequency mode. The H2 ratio changed flame length due owing the relative burning velocities of H2 and CH4, and the flame length influenced convection time. To support the results, the speed of the laminar flame was calculated, and it was verified that the frequency of combustion instability was proportional to this speed.
3. Flame length deceased with an increase in the H2 ratio, which was verified using a 7,000-Hz high-speed camera and the Abel inversion process. Using the images of the flame cross section, the occurrence of combustion instability was confirmed based on the radial profiles of OH radical concentration of the flame with the strong vibration of the flame on the dump plane.
In conclusion, an experimental test was conducted to investigate combustion instability and the characteristics of the exhaust gas at various combustor lengths. The emission and combustion instabilities were primarily dependent on the chemical composition, rather than combustor length, and the speed of the laminar flame was used to verify the phenomenon of a shift in the combustion instability mode. Moreover, combustion instability can be distinguished using images of flame images obtained by a high-speed camera. The results of this study are expected to provide fundamental insights into stable gas turbine operation by avoiding combustion instability.
Acknowledgements
This study was supported by a National Research Foundation of Korea (NRF) grant funded by the Korea government (MSIP) (No. 2015R1A2A2A010043), the Ministry of Trade, Industry & Energy (MOTIE, Korea) under the Industrial Technology Innovation Program, (No. 10067074) and the Advanced Research Center Program (NRF-2013R1A5A1073861) through a National Research Foundation of Korea (NRF) grant funded by the Korea government (MSIP), contracted through the Advanced Space Propulsion Research Center at Seoul National University.