


Nomenclature
- ATC
-
air traffic control
- ATM
-
air traffic management
- BADA
-
base of aircraft data
- B-PM
-
baseline point merge
- CPS
-
constrained position shifting
- FCFS
-
first-come first-served
- MAR-PM
-
Multi-Arrival Route-Point Merge
- PMS
-
point merge system
- RNAV
-
area navigation
- wp
-
way point
1.0 Introduction
Various methods are being used for sequencing air traffic flows. The point merge system (PMS) is one of these methods that allows air traffic controllers to sequence and merge arrival flows without vectoring. Moreover, the PMS offers an easy method while providing a balanced trade-off among predictability, flight efficiency, and environmental impact [1].
This paper aims to propose a new operational concept of the point merge system, called the Multi-Arrival Route Point Merge (MAR-PM), which provides flexibility to air traffic controllers by offering alternative routes on the point merge structure and presents a systematic approach for sequencing by providing the predefined route.
The first-come first-served (FCFS) principle is the traditional and the most widely used aircraft sequencing policy at most airports. In the FCFS policy, aircraft are sequenced based on the expected approach time to a runway or a given point. The FCFS is accepted to be a fair method for scheduling aircraft; moreover, a minimal intervention is required by air traffic controllers due to the no-need resequencing. Although the FCFS is a simple and fair method, it rarely minimises the aircraft delay [Reference Brentnall and Cheng2–Reference Sölveling and Clarke3].
Dear [Reference Dear4] first proposed constrained position shifting (CPS) for solving aircraft landing problems. Dear and Sherif [Reference Dear and Sherif5] developed the CPS algorithm, which provides an optimal or close to optimal sequence by shifting aircraft position in a limited number of steps from the nominal FCFS position. The maximum number of positions is determined, and it is not allowed to be exceeded. CPS is based on dynamic programming presented in Psaraftis [Reference Psaraftis6], Neuman and Erzberger [Reference Neuman and Erzberger7], Venkatakrishnan et al. [Reference Venkatakrishnan, Barnett and Odoni8], Trivizas [Reference Trivizas9], and Balakrishnan and Chandran [Reference Balakrishnan and Chandran10].
On the other hand, although the PMS implementation started in the 2010s, the concept and theoretical studies related to merging date to late 1990s. Numerous studies regarding the sequencing of the PMS have been conducted by Hong et al. [Reference Hong, Choi, Lee, Lee and Kim11], Lee et al. [Reference Lee, Hong and Kim12], Yannan et al. [Reference Qi, Wang and Chen13], Christien et al. [Reference Christien, Hoffman, Trzmiel and Zeghal14], Toratani and Itoh [Reference Toratani and Itoh15] and proposed an optimal and practical sequencing and scheduling algorithm to increase the capacity in handling inbound traffic through the PMS and to support the decision-making process of air traffic controllers. In addition, Lee et al. [Reference Lee, Hong and Kim12] recommended an optimal scheduling algorithm of the PMS, also considering a holding pattern based on a Mixed Integer Linear Programming (MILP). Christien et al. [Reference Christien, Hoffman, Trzmiel and Zeghal14] focused on a novel approach to understand and characterise the sequencing of arrivals. The proposed approach, essentially data driven, relied on the analysis of spacing evolution over time between consecutive aircraft. Toratani and Itoh [Reference Toratani and Itoh15] studied the merging optimisation method, which simultaneously optimised the trajectory and sequence of the arrival aircraft while maintaining a sufficient time separation at the merging point to avoid wake turbulence.
Furthermore, a study towards the development of an autonomous system with PMS that performs sequencing, merging and spacing for arrival aircraft in a busy terminal area at Beijing Capital International Airport was conducted by Liang et al. [Reference Liang, Delahaye and Marechal16]. In the case of applying the PMS, reductions in flight time, fuel consumption and CO2 were achieved. Moreover, it was indicated that PMS is allowed continuous descent and a more flexible sequence position shift.
Sahin and Usanmaz [Reference Sahin and Usanmaz17] studied a comparison between vectoring and point merge using real-time simulation. In the paper, a PMS model for converging runways was proposed for the Istanbul Ataturk Airport. Furthermore, another study concerning the PMS for Ankara Esenboga International Airport was performed by Usanmaz et al. [Reference Usanmaz, Sınar and Sahin18]. Real traffic handled by vectoring and a simulation analysis of the recommended PMS model were compared according to the number of instructions (heading, flight level, speed) and frequency occupancy time.
The literature review reveals that the majority of the studies have explored the advantages of the PMS such as fuel and emission reduction, flight efficiency, runway throughput, sequencing and scheduling, etc. These studies also stipulate that the PMS have enabled standardisation in aircraft sequencing; however, additional solutions and methods are required on the congested traffic environment to arrange traffic flow.
In this study, a time indexed linear programming model is presented to minimise the total earliness/tardiness on arrival times of aircraft to the merge point, to achieve optimal sequencing based on route assignment and waypoint allocation for each aircraft.
The remainder of this paper is organised as follows. Section 2 provides the details of the proposed concept. Section 3 provides a time-indexed 0-1 linear programming model. Section 4 contains the results and discussion and in the final part; the conclusions and future research possibilities are explained.
2.0 Multi-arrival routes-point merge system (MAR-PMS)
In this paper, a point merge system with two sequencing legs, separated vertically by 1,000ft (FL110 and FL100) and four entry points to collect traffic from different directions was considered as the baseline point merge (B-PM) procedure. Four arrival routes were connected to sequencing legs from the entry points, which required 900 course changes. Before entering the sequencing legs, safe separation among the arrival aircraft could be provided using a holding procedure that may be completed in approximately 4 minutes (min), corresponding to 20NM flight distance. However, the holding patterns may not always offer the appropriate solution. For instance, performing more holding results in more fuel burn. On the other hand, increased airspace volume requirements and accompanying speed adjustments at higher altitudes can affect airspace planning and adjacent airspace/airport. Moreover, aircraft cannot be held at the same time and at the same altitude, which requires wider airspace volume.
From this perspective, a novel approach called the Multi-Arrival Routes-Point Merge (MAR-PM) is proposed, which allows aircraft to fly either B-PM procedure’s trajectory or on an alternative route that requires a different course change from B-PM to reach the sequencing leg. It is expected that these alternative routes could increase situation awareness of controllers and could give flexibility for managing air traffic.
In order to find an optimal route structure and course change, two different radius turn parameters (7 and 15NM) were chosen [19]. For these parameters, length of turn, turn initiation point and abeam distance values were calculated within the 150 intervals of course change as indicated in Table 1.
Table 1. Calculated values for 7 and 15NM

Figures 1 and 2 depict the 7 and 15NM fixed radius turns (FRT) respectively. While Fig. 1(a) illustrates the 150 course changes, Fig. 1(f) the 900 course changes. Similarly Fig. 2 consists of six different course changes that start with 150 and end 900. For both figures, while red lines are the FRT trajectories, green lines represent the fly-by transition boundaries. Each illustration has its own scale (dimension of each square), and these are detailed under the Figs 1 and 2.

Figure 1. Illustration of 7NM FRT.

Figure 2. Illustration of 15NM FRT.
On the selection of alternative routes, some aspects such as collision avoidance and airspace volume were considered. As depicted on Figs 1 and 2; 150 and 300 course changes could not provide and maintain sufficient separation since it is so close to 900 course changes and triggers the air miss. Also, these options required additional solutions such as holding to prevent conflicts. On the other hand, 600 and 750 course changes could provide and maintain sufficient separation; however these options require additional airspace volume, which may not be feasible for each airspace.
Considering all mentioned factors and the efficiency of the model, the course change for the alternative route was assessed 450. The proposed concept allows aircraft two alternative route options with a course change of 450 and 900. In this regard, while B-PM concept comprises only one 900 course change trajectory, MAR-PM concept comprises two trajectories both 450 and 900 course changes. Six waypoints were defined as a turning point to merge point, and they have placed 3NM intervals that provide minimum radar separation [20]. Also, speed constraints were applied during the procedure. Moreover, a 5% gradient was taken into consideration, and 15NM distance was assumed as the distance between sequencing legs and the merge point. The illustration of trajectories of B-PM and MAR-PM shown in Figs 3 and 4, respectively.

Figure 3. Illustration of a B-PM.

Figure 4. Illustration of a proposed MAR-PM.
Due to their geometry, a 450 course change requires less time than 900 course changes. Under the given assumptions and constraints, quantitative results were achieved in real-time air traffic simulation. The simulation results revealed that flight distance’s correlation between theoretical calculation and practical evolution on simulation was 99.15% for 450 course change and 90.05% for 900 course changes. Similarly, flight time’s correlation was 96.2% and 98.05% for 450 and 900 course changes, respectively. The obtained results also showed that acquisition of executing 450 course change was 7.7NM and 60 seconds. The results revealed that even if the entry time of two aircraft were the same (at different entry points), the 3NM longitudinal separation can be provided automatically on the first waypoint of the sequencing leg if one follows the route having 450 course change and the other follows the route having 900 course changes.
In this regard, a case study that covers six different scenarios, whose distribution were based on European Route Network Improvement Plan [21], was designed, and conducted B-PM and MAR-PM respectively in order to discover the potential benefits and/or drawbacks of both. Additionally, the obtained results from a case study were compared. This comparison is based on route assignment and waypoint allocation for each aircraft to achieve feasible scheduling.
3.0 Time-indexed 0-1 linear programming formulation
This paper proposes a 0-1 linear programming formulation that aims to minimise the total earliness/tardiness on arrival times of aircraft to merge point, to achieve optimal sequencing based on route assignment and waypoint allocation for each aircraft.
MAR-PM was represented in graph, data structure, that consists of two components: (1) a finite set of vertices also called as nodes, and (2) a finite set of ordered pair of directed arcs. Entry nodes were numbered from 1 to 4, and the waypoints on sequencing legs were numbered as nodes from 5 to 16 and 5ˈ to 16ˈ. “ˈ” symbol indicates that aircraft follows the route that is required to 900 course changes. Nodes numbered 5-5ˈto 10-10ˈ and 11-11ˈto 16-16ˈ refer to waypoints in sequencing leg 1 and sequencing leg 2, respectively. Merge point was numbered as a node 17 (Fig. 5).

Figure 5. Graph representation of MAR-PM.
3.1 Sets
- A
-
= set of aircraft
- τ
-
= set of time
-
=
 $\tau \in \left[ {{\rm{AP}}{{\rm{P}}_1},{\rm{A}}{{\rm{T}}_n}} \right]$
- V
-
= set of vertices of graph
- V
-
= {1,2,3,4,5,5′,6,6′,…16,16′,17} ; V = V 1 ∪ V 2∪{m}
- U
-
= set of arcs

3.2 Notation
Let
-
n = number of aircraft
-
$n = |A| $
, (q = 1,…, n ; p = 1,…, n)
-
EP q = entry point for q th aircraft
-
WTC q = wake turbulance category of q th aircraft
-
APPq = entry time of qth aircraft for entry point (seconds)
-
ET q = earliest time of q th aircraft for merge point (seconds)
-
LT q = latest time of q th aircraft for merge point (seconds)
-
TT q = target time of q th aircraft for merge point (seconds)
-
V 1 = vertices for entry points
-
V 1 = {1,2,3,4}
-
V 2 = vertices for way points on sequencing legs
-
V 2 = {5,5′,6,6′,…16,16′}
-
m = node for merge point
-
m = 17
-
G = Graph (V,U)
-
t q = vertice time for q th aircraft
-
V = V 1 ∪ V 2∪ {m}; t q
$\in $
τ (seconds) -
t ij = flight time of q th aircraft from i to j
-
V = V 1∪ V ∪ {m} t q
$\in $
τ (seconds) -
S qp = wake turbulence separation minima between leading aircraft “q” and following aircraft (seconds)
-
g q = penalty unit applied to q th aircraft if landed earlier than its target time
-
h q = penalty unit applied to q th aircraft if landed later than its target time


The time window for an aircraft q is [ET q , LT q ], where ET q < TT q < LT q . Therefore:
-
AT q = actual time of q th aircraft for merge point (seconds)
-
α q = amount of time if q th reaches merge point earlier than its target time (seconds)
-
β q = amount of time if q th reaches merge point later than its target time (seconds)
-
δqp = sequencing of aircraft pairs (q and p)
3.3 Decision variables
 \begin{align}{x_{i,j,q,t}} = \left\{ \begin{array}{l} 1,\quad \textrm{if aircraft}\ \boldsymbol{{q}}\ \textrm{enters arc ( {i,j}) at time}\ \boldsymbol{{t}} \\[4pt] {0,\quad \textrm{otherwise}}\end{array}\right. ;\{x_{i,j,q,t} \in \left\{ {0,1} \right\}\;{\rm{for}}\,\left\{\begin{array}{c} {i,j \in U} \\[3pt] {j \in {V_2}\;\cup\left\{ m \right\}} \\[3pt] {q \in \;A} \\[3pt] {t \in \tau }\end{array}\right. \end{align}
 \begin{align}{y_{i,q,t}} = \left\{\begin{array}{l}1,\quad \textrm{if node}\ \boldsymbol{{i}}\ \textrm{is busy for aircraft}\ \boldsymbol{{q}}\ \textrm{at time}\ \boldsymbol{{t}}\\[3pt] {0,\quad \textrm{otherwise}}\end{array}\right.;\ {y_{i,q,t}} \in \left\{ {0,1} \right\}\;{\rm{for}}\;\left\{\begin{array}{c}{i \in U} \\[3pt] {q \in A} \\[3pt] {t \in \tau}\end{array} \right.\end{align}
 \begin{align}{\rm{A}}{{\rm{T}}_{q\;}} \in {\rm{\;}}\left[ {{\rm{E}}{{\rm{T}}_{q\;}},{\rm{\;L}}{{\rm{T}}_{q\;}}} \right]\end{align}
 \begin{align}{\rm{T}}{{\rm{T}}_{q\;}} \in {\rm{\;}}\left[ {{\rm{E}}{{\rm{T}}_{q\;}},{\rm{\;L}}{{\rm{T}}_{q\;}}} \right]\end{align}
 \begin{align}{E_q} = \max \left\{ {0,\;{\rm{T}}{{\rm{T}}_{q\;}} - \;\left. {{\rm{A}}{{\rm{T}}_q}} \right\}} \right.\;\;\;\end{align}
 \begin{align}{T_k} = {\rm{max}}\;\left\{ {0,\;{\rm{A}}{{\rm{T}}_{q\;}} - \;\left. {{\rm{T}}{{\rm{T}}_q}} \right\}} \right.\end{align}
 \begin{align} \delta_{qp} = \;\left\{ {\begin{array}{l}{1,\quad if\ aircraft\ \boldsymbol{{q}\ }\ \textrm{lands before aircraft}\ \boldsymbol{{p}}}\\[3pt]{0,\quad \textrm{otherwise}}\end{array}} \right.\end{align}
3.4 Constraints
 \begin{align}\mathop \sum \limits_{\textrm{t} \in \tau} \mathop \sum \limits_{\textrm{q} \in \textrm{A}} \mathop \sum \limits_{\textrm{j} \in {V_2}} \mathop \sum \limits_{\textrm{i} \in {V_1}} {x_{i,j,q,t}} = n\end{align}
 \begin{align}\mathop \sum \limits_{\textrm{t} \in \tau} \mathop \sum \limits_{q \in A} \mathop \sum \limits_{i \in {V_2}} {x_{i,m,q,t}} = n\end{align}
 \begin{align}\mathop \sum \limits_{t \in \tau} \mathop \sum \limits_{i \in {V_1}} \mathop \sum \limits_{j \in {V_2}} {x_{i,j,q,t}} - \;\mathop \sum \limits_{t \in } \mathop \sum \limits_{i \in {V_2}} {x_{i,m,q,t}}\;\; = 0\,\left( {q \in A} \right)\end{align}
 \begin{align}\mathop \sum \limits_{q \in A} \mathop \sum \limits_{i \in V\backslash m} {x_{i,j,q,t}}\; \le 1\left( {t \in \;\;\textrm{and}\;\;j \in \;V\backslash {V_1}\;} \right)\end{align}
 \begin{align}\mathop \sum \limits_{q \in A} \mathop \sum \limits_{j \in V} {x_{i,j,q,t\;}}\; \le 1\;\left( {t \in \;\;\textrm{and}\;i \in \;V\backslash m} \right)\end{align}
 \begin{align}{y_{i,p,t + {S_{qp}}}}\; \ge \;\mathop \sum \limits_{j \in V} \mathop \sum \limits_{q \in A} {x_{i,j,q,t}}\end{align}
 \begin{align}{y_{j,q,t\;}} + \;\mathop \sum \limits_{i \in V|(i,j) \in U} {x_{i,j,q,t}}\; \le 1\;\left( {\;t \in \;\tau V,\;j \in V,q \in A} \right)\end{align}
 \begin{align}\mathop \sum \limits_{t \in \tau} \mathop \sum \limits_{i \in {V_2}} ({t_{i,m}} + t){x_{i,m,q,t}}\; = A{T_q}\;\left( {q \in A} \right)\end{align}
 \begin{align}{x_{i,j,q,t}}\; \le \;\mathop \sum \limits_{r \in V} {x_{r,i,q,t - {t_{ri}}}}\end{align}
 \begin{align}E{T_q} \le \;T{T_q}\; \le \;L{T_{q\;}}\;\left( {q \in A} \right)\end{align}
 \begin{align}E{T_q} \le \;{A_q}\; \le \;L{T_{q\;}}\;\left( {q \in A} \right)\end{align}
 \begin{align}\delta_{qp} + {\delta_{pq}} = 1\;\left( {q,p \in A\;;\ p \gt q\;\textrm{or}\;q \gt p} \right)\end{align}
 \begin{align}A{T_q} - \;A{T_p}\; \ge \;{S_{qp\;}}\;\left( {\delta_{qp} = 1\;\textrm{and}\;q,p \in A\;} \right)\end{align}
 \begin{align}\alpha_q \ge \;T{T_{q\;}} - \;\;\;A{T_q}\;\left( {q \in A\;} \right)\end{align}
 \begin{align}0\; \le {\alpha_q} \le \;T{T_{q\;}} - \;\;\;E{T_q}\;\left( {q \in A\;} \right)\end{align}
 \begin{align}\beta_q \ge \;A{T_{q\;}} - \;\;\;T{T_q}\;\left( {q \in A\;} \right)\end{align}
 \begin{align}0\; \le {\beta_q}\; \le \;L{T_{q\;}} - \;\;\;T{T_q}\;\left( {q \in A\;} \right)\end{align}
 \begin{align}A{T_q} = \;T{T_q} - {\alpha_q} + {\beta_q}\;\left( {q \in A\;} \right)\end{align}
Constraint (8) provides that exactly n aircraft are included in the air traffic flow within the scope of the scenario. Constraint (9) guarantees that exactly n aircraft reach the merge point after the air traffic flow. Constraint (10) states that each aircraft included in the air traffic flow from any entry point will return to the merge point using only one waypoint (450 or 900 turn) on the sequencing leg. Constraints (11) and (12) ensure that any node is visited exactly once at a given time t. In this context, a node (entry point, waypoint or merge point) at a certain time t can only be used by one aircraft. These constraints are important in preventing conflict during sequencing. Constraint (13) states that if a node (entry point, waypoint or merge point) is used by the leading aircraft at a certain time t, the following aircraft cannot use that node during the minimum separation time within the specified wake turbulence separation minima. Constraint (14) ensures that if any waypoint on the sequencing leg is used by an aircraft for a specific time (for turning to the merge point), the other routes to the merge point are also used from the same time, with this aircraft leaving that node and heading to the merge point. Constraint (15) gives the actual time of merge point for each aircraft. Constraint (16) is used to determine the exact timing of each arc. While constraint (17) indicates the merge point target time window for each aircraft, constraint (18) indicates the actual time window in which it is at the merge point. Constraint (19) means that for each pair of aircraft (q, p), q will reach the merge point before the p. Constraint (20) ensures that the WTC separation between (q, p) aircraft pair is also maintained at the merge point. Constraint (21) ensures that the early time for each aircraft is equal to or greater than the difference between the target time and the actual time it is at the merge point. Constraint (22) limits the early time for each aircraft between 0 and the time difference between the target time and the earliest time difference. Constraint (23) ensures that the late time for each aircraft is equal to or greater than the difference between the actual time at the merge point and the target time. The constraint numbered (24) limits the late time for each aircraft between 0 and the time difference between the target time and the latest time. Constraint (25) ensures merge time to be equal to the difference between the target time and the early time or the sum of the target time and the late time.
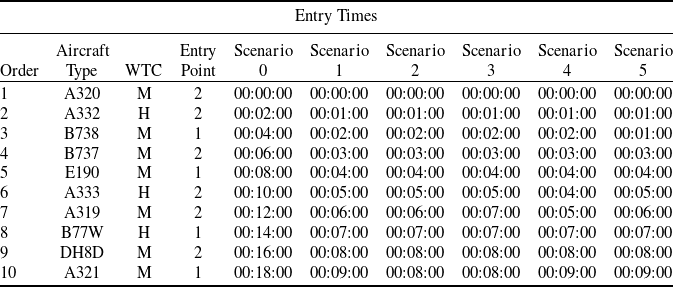
Table 2. Scenario details
3.5 Objective function
 \begin{align*}MIN\;\mathop \sum \limits_{q \in A} {g_q}\ \alpha_q + \;{h_q} \beta_q\;\end{align*}
4.0 Results and discussion
In this part, the results B-PM and MAR-PM based solutions were compared in terms of sequencing, flight distance, flight time and fuel consumption. For any individual aircraft there can be some loses or gains considering the flight time that effects the flight distance and fuel consumption, respectively. However, from flow management perspective, overall flow should be optimised. Therefore, the objective function focuses on total flight time for all aircraft in the scenarios whose detailed are given in Table 2.
This paper aims to create most feasible aircraft scheduling for arrival traffic flow. Minimum separation time can be considered as a key element for separation. Table 3 illustrates the minimum separation time between the successive aircraft concerning two typical aircraft types (heavy and medium).
Table 3. Minimum separation time (seconds)

Considering the successive aircraft pairs at the scenarios and the required separation times, the optimal aircraft sequencing, that takes different wake turbulence categories (Heavy (H), Medium (M)) into account for each scenario is listed in Table 4.
Table 4. The aircraft sequencing results of B-PM and MAR-PM

The results show that in case of B-PM, a holding stack was needed to prevent confliction. The aircraft had to be hold were highlighted with (*) in Table 4. Due to joining holding stack, it was seen that the position shifting occurred. On the other hand, MAR-PM based sequencing eliminated the necessity of holding procedures. Thuswise, MAR-PM bounded up with the FCFS rule, which could be considered the fair sequencing. The route structure for each scenario based on MAR-PM given in Table 5.
Table 5. The route structure for each scenario based on MAR-PM

After route assignment and waypoint allocation were obtained; flight time, flight distance, fuel consumption, and CO2 emissions were calculated both for each individual aircraft and cumulatively for the whole scenario. BADA version 3.14 [22] was used for fuel consumption and the aircraft parameters such as aircraft gross mass, speed, cruise altitude were taken into consideration. The coefficient of CO2 emissions for fuels used was 3.16kg/kg [Reference Anderson, Chen and Blake23–Reference Wormhoudt, Herndon, Yelvington, Miake-Lye and Wey24].
Entry points and merge point are assigned as datum points for computation. Thus, flight time represents the time difference between the merge point arrival time and the entry point time per aircraft. Herewith, total flight time is a make span that indicates the difference between the last aircraft’s arrival time to merge point and the first aircraft’s entry time to the trajectory.
Since the maximum separation time between successive aircraft is 118sn, which is between Heavy-Medium aircraft pair, any time interval less than 118sn requires holding pattern. Scenario 0 was created in order to evaluate and compare the B-PM and MAR-PM performance without holding patterns. All scenarios except Scenario-0 included holding pattern so as to establish and maintain required separation between successive aircraft. In Scenario-0, all aircraft utilised WP-1 throughout the sequencing leg. However, B-PM allowed only 900 turns while MAR-PM gave the opportunity utilisation of 450 turns. All other scenarios compassed both 450 and 900 turns, depending on the entry time and wake turbulence category.
As shown in Table 6, even though without holding patterns, MAR-PM provided 27 minutes gain in terms of total flight time. This also shortened 77NM of the total flight distance. The results also indicated that MAR-PM has more advantages considering the total flight time, total flight distance and total fuel consumption. Besides Scenario-0, composition of 450 and/or 900 turns gave the flexibility not only to air traffic controller but also pilots. From Scenario-1 to Scenario-5, the results were remarkable in favor of MAR-PM concept. In Scenario-1, for B-PM trajectory, the total flight time, total flight distance and total fuel consumption were found to be 105 min., 407NM and 4,601.54kg, respectively. Similarly, these values were found to be 84 min., 307.4NM and 3,689.17kg respectively for MAR-PM trajectories. Moreover, the production of CO2 emissions was 14,536.38 and 11,654.32kg for B-PM and MAR-PM, respectively. Based on the comparison, from a flight time perspective, 21 min. saving in time was obtained from the implementation of MAR-PM trajectories. Moreover, in terms of total flight distance MAR-PM trajectories shortened the distance by 99.6NM. The fuel savings were calculated as 912.37kg, and a reduction in CO2 emissions was obtained by 2,882.06kg. MAR-PM trajectories provided the reduction of 19% in flight time, 23% in flight distance, 19% in fuel burned and CO2.
In Scenario-2, for B-PM trajectory, a total flight time of 106 min., a flight distance of 410NM and fuel consumption of 4,601.54kg were found, with 14,536.38kg CO2 emissions produced. For MAR-PM trajectories, an 85 min. flight time, a 310NM flight distance and 3,689.17kg fuel consumption, with 11,654.32kg CO2 emissions were achieved. The similar time (21min), distance (approximately 100NM), and fuel-saving (912kg) with Scenario-1 were observed in favor of MAR-PM.
Table 6. The Comparison of the obtained results in terms of total flight time, flight distance, fuel consumption and CO2 emission

For the Scenario-3, a time of 108 min., a flight distance of 424NM and 4,565.04kg fuel burned, with CO2 emissions of 14,421.78kg produced, were obtained in the B-PM trajectory.86 min., 318NM, 3,561.94kg fuel burned with 11,252.74kg of CO2 emissions were produced for the MAR-PM trajectories. Twenty-two min. saving in time was obtained from the implementation of MAR-PM trajectories. Furthermore, it was noted that MAR-PM trajectories shortened the distance by 105.9NM. MAR-PM trajectories enabled the reduction of 20% in flight time, 25% in flight distance, 22% in fuel burned and CO2 emissions.
For the other Scenario-4, 105 min., 415NM and 4,431.74kg fuel burned with 14,001.18kg CO2 emissions and 88 min., 335NM and 3,884.81kg fuel burned with 12,272.02kg CO2 emissions were produced for the B-PM and MAR-PM, respectively. The results present that MAR-PM was more advantageous than B-PM. In the Scenario-5, a flight time of 108 min., 87 min, a flight distance of 432, 332NM and 4,857.69, 3,856.06kg fuel burned were found for B-PM and MAR-PM, respectively.
The results of the case study showed that average reduction of 19% in flight time, 23% in flight distance and 19% in fuel burned and CO2 in favor of a proposed concept.
It should be mentioned that practicing time on simulation required a long duration to perform measurement and calculation. On the other hand, should aircraft numbers and complexity increased in the scenarios, a longer duration would be needed. In order to overcome this restraint, the codes were developed by authors to acquire optimal sequencing, including route assignment and wp allocation, in an explicitly shorter time.
In this paper, the case study not only was resolved in real-time air traffic control simulation but also was sorted out by codes which are developed by the authors and Java SE 15 is adopted for programming. The implementation was carried out in the personal computer with Intel (R) Core (TM) i5-2430M CPU@2.40GHz processor and 6GB Ram with Windows x64 based operating system. While the maximum running time of the algorithm was 2,489ms, the minimum value was 1,645ms.
5.0 Conclusion
PMS procedures have been stepped forward to meet the requirements in the operational environment while enabling effectiveness and efficiency. In this paper, the proposed MAR-PM concept, whose objective is to optimise flight efficiency considering flight time, flight distance, fuel consumption and CO2 emission, was introduced to the literature. In this regard, a case study that covers six different scenarios was designed and was conducted B-PM and MAR-PM, respectively, to discover the potential benefits and/or drawbacks of both. Additionally, this paper evaluated and compared the performance of B-PM and MAR-PM in terms of flight time, flight distance, fuel consumption and CO2 emission. This evaluation and comparison were represented in a variety of complex scenarios within ten aircraft. This complexity has revealed that as the density and overlap in the scenarios increases, the acquisition also increases. It would not be appropriate to create a mathematical function between aircraft numbers and acquisition since the acquisitions are based on the distribution of some elements such as aircraft type, aircraft entry time and entry point. However, it should be mentioned that acquisitions are expected to increase cumulatively in dense scenarios which includes more than ten aircraft.
The comparison of B-PM and MAR-PM within the context of flight time and flight distance, as well as fuel consumption and CO2 emissions, is also pivotal when considered multiple aspects. From air traffic controllers’ aspect, two route option that is provided by MAR-PM surpasses the traditional solutions such as holding procedures on congested traffic. On the other hand, MAR-PM decreases inclination to vectoring for the final phase. Moreover, from airspace and airport capacity management aspect, a reduction in flight time and flight distance creates the opportunity to enhance airspace and runway capacity. Additionally, from airline operators’ aspect, solutions based on MAR-PM trajectories also present a reduction of fuel consumption that has a positive economic impact. Finally, from an environmental aspect, reduction of fuel consumption directly affects the CO2 emission; so, MAR-PM trajectories save the fuel consumption and CO2 emissions.
Moreover, the MAR-PM was found to be a fair method for sequencing in contrast to the B-PM. With regards to the simulation results, it was concluded that while MAR-PM trajectories provided the first come first served (FCFS) sequencing technique, the order of aircraft in B-PM had to been shifted to prevent possible conflicts.
Besides the opportunities of MAR-PM concept, it should be mentioned that these opportunities also bring some challenges. Since the MAR-PM creates a novel approach to PMS, the adaptation of air traffic controllers and pilots to this concept should be considered carefully. The alternative route selection may increase the workload of air traffic controller in terms of communication. Air traffic controller should be sure that route allocation is well understood by pilots since any deviation of assigned route may trigger the air miss. From operational perspective this can easily be solved by taking into consideration of route assignment as verbatim instructor. Therefore, pilot to take specific actions and also to confirm the ATC instruction. As the training is the main element for any new procedures presented to air traffic procedures, appropriate training programs can reduce this pseudo negative impact.
It is notable that the MAR-PM concept is adaptable for any airspace. The PMS has opened up horizon for the congestion in the TMA. The MAR-PM concept aims to take this one step further. The dual route structure of the MAR-PM concept may require more airspace volume during the design phase. Therefore, the airspace designers should take into consideration of requirement of more airspace volume.
The contribution of this paper to literature can be sorted as follows. Firstly, MAR-PM concept puts forth a novel approach to the existing PMS procedures in terms of effectiveness and efficiency. Secondly, MAR-PM reduces the utilisation of traditional methods such as holding procedures and vectoring while provides flexibility to the air traffic controller. However, the authors also acknowledge that holding procedures need to be a backup procedure and cannot be omitted. Thirdly, this study has not only run on Java but also practiced on simulation. It has been experienced that simulation practices require more duration, manpower and workload. Lastly, as MAR-PM architecture contains commonly held parameters, MAR-PM trajectories can be adapted in any airspace especially having multiple arrival flows.
The authors would like to stress that this study should be seen as the introduction of MAR-PM and its formulation. As obtained results are indicating, MAR-PM presents benefits from multiple aspects, this outcome is considered encouraging for further studies. Authors continue to study on not only dense scenarios but also different route structure of MAR-PM concept. Therefore, further studies are recommended to assess and compare the MAR-PM to other static and dynamic sequencing methodology looser and denser scenarios.
Funding
The author(s) received no financial support for the research, authorship and/or publication of this article.
Acknowledgments
This study was supported by Eskişehir Technical University Scientific Research Project Commissions (project number 20DRP048) of Turkey.


