NOMENCLATURE
- 2D
two-dimensional
- 3D
three-dimensional
- CFD
computational fluid dynamics
- TVC
thrust vector control
- Ae
nozzle exit plane area
- Ai
internal surfaces area
- Ao
external surfaces area
- As
shadowed area
- At
nozzle throat area
- A0
inlet area
- dT
chamber thrust
- FA
thrust loss
 ${\bar F_A}$
relative thrust loss
- FB
side force
 ${{{\bar F}}_{{B}}}$
relative side force
- h
nozzle exit plane height
 $\dot m$
mass flow rate
- M
mass
- p
pressure
- pe
nozzle exit plane static pressure
- pa
atmosphere pressure
- p0
total pressure
- T
thrust
- T'
pressure force
- T’x
pressure force in x-direction
- Ve
nozzle exit plane velocity
- x
nozzle axis direction
- y+
dimensionless wall distance
- z
direction
- α
nozzle expansion half-angle
- γ
tab gap
- ε
nozzle expansion rate
- σ
shadowed ratio
- τ
characteristic time
1.0 INTRODUCTION
Thrust vector control (TVC) is an old principle encompassing different methods for the control of rocket motor thrust force. One of these methods is generating a lateral thrust component (side force) of the rocket motor, changing the thrust vector direction(Reference Sutton and Biblarz1). The thrust vector must be precisely defined by the direction and intensity in order to generate sufficiently precise side force at the required magnitude. The TVC is useful in the cases when aerodynamic fin controls are ineffective, e.g. when extraordinary manoeuvrability is required for missiles flying at low speeds or high altitudes.
The TVC system described in the present paper is applicable in tactical missiles. The considered missile has a ‘soft launch’ capability and the TVC system as a nozzle exit design type, which can ensure sufficient manoeuverability at a very low launching speed, especially in the initial phase of the flight close to the ground. The considered TVC system is applied on the missile designed as a man-portable weapon, with emphasised requirements for mass optimisation(Reference Ocokoljic, Zivkovic and Subotic2). The missile has a solid propellant sustainer rocket motor with a low mass flow rate and a small nozzle diameter. The jet tabs (nozzle interceptors), the jetavator (nozzle dome deflector) and the movable nozzles are motor/nozzle external thrust vectoring types of the TVC systems(Reference Gal-Or3) most frequently used in these types of tactical missiles(Reference Sutton and Biblarz1). The TVC system with tabs is chosen due to the requirement for a minimum control system hinge moment, which results in the minimum design component weights in comparison to other mechanical TVC systems(Reference Sutton and Biblarz1,Reference Hunter and Deere4) . Despite these advantages, it has a low efficiency of the side force generation when compared to thrust intensity losses(Reference Sutton and Biblarz1).
The TVC characteristic values and their interdependency with the geometry parameters are examined in many theoretical and experimental research works(Reference Jojic, Milinovic, Stefanovic and Blagojevic5). According to the works mentioned, this type of TVC systems generates a maximum value of side forces, when the exit area of the nozzle is shaded by the tabs for nearly 50%. Gas-dynamic drag during the motion of the tabs through the nozzle jet is minimal when the tab surface is perpendicular to the nozzle axis. In such conditions, the expected thrust loss could be higher than 30% of the nominal (undisturbed) thrust(Reference Zivkovic6). In this particular case, in flight conditions that dictate the frequency of the TVC use, total impulse losses can be higher than 20%. The mass of the propellant is about 20% of the total missile mass, so an additional amount of propellant could be required to compensate for the total impulse losses(Reference Gligorijevic, Zivkovic, Subotic, Kozomara, Nikolic and Citakovic7). This leads to the conclusion that the TVC system applied here is not the best with respect to losses, but is still the best regarding the mass ratio of subsystems and components.
During the combustion products expansion through the nozzle, inflicted at the exit area by the insertion of a jet tab, complex disturbed flow inside the supersonic area is generated. The correlation between the gas dynamics and the geometry parameters of the disturbed flow domain and its effects on the thrust vector direction inclination is stressed in the present paper. In order to maximise the efficiency of this type of TVC system, extensive research of the influence of geometry parameters on thrust vectoring was carried out and published earlier by Jojic(Reference Jojic, Milinovic, Stefanovic and Blagojevic5) and Zivkovic(Reference Zivkovic6). The initial examination of the gas dynamic phenomena related to internal flow separation caused by obstacles in the supersonic stream given in those papers is conducted in the supersonic wind tunnel presented in several papers(Reference Jojic, Milinovic, Stefanovic and Blagojevic5, Reference Kozic and Ristic8, Reference Zivkovic, Milinovic and Adamec9). Based on these experimental results, reliable CFD simulations are developed, as described in papers by Gligorijevic(Reference Gligorijevic, Zivkovic, Subotic, Kozomara, Nikolic and Citakovic7), Kozic(Reference Kozic and Ristic8) and Zivkovic(Reference Zivkovic6, Reference Zivkovic, Milinovic and Adamec9), in order to confirm the existing development stage and to facilitate further development of the TVC systems.
2.0 GAS DYNAMIC PERFORMANCES OF SEPARATED FLUID FLOWS
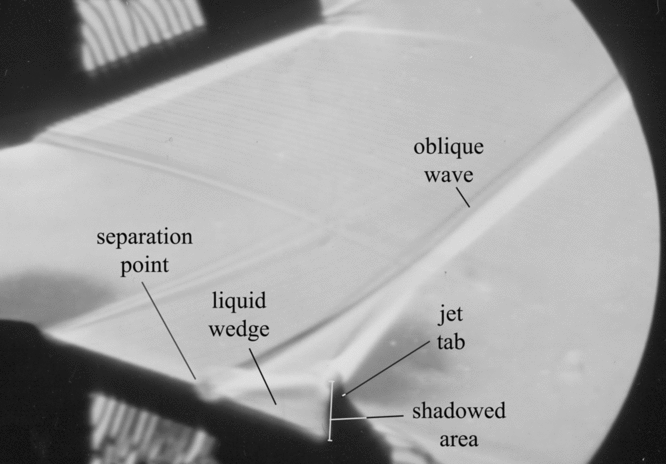
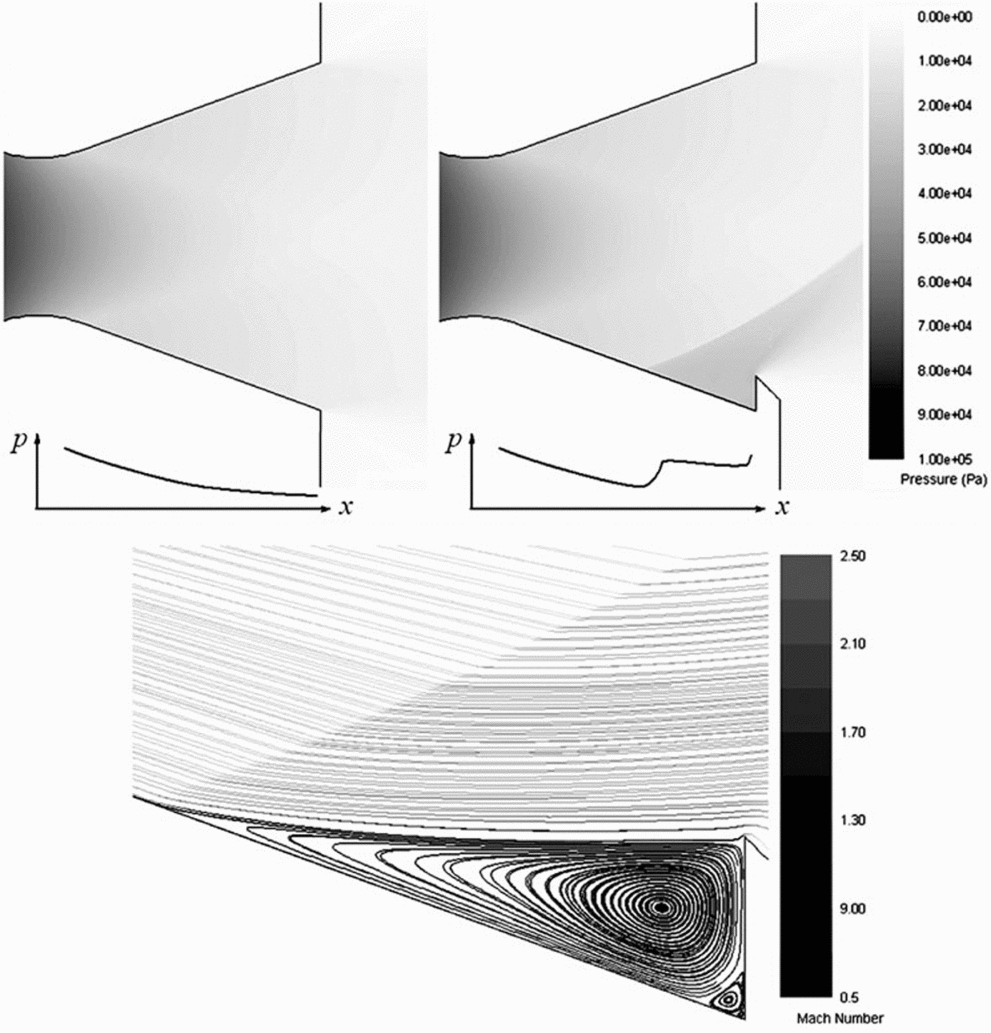
Inserting a tab as an obstacle in a supersonic stream generates an oblique shock wave upstream and a high-pressure recirculation zone below the wave. The supersonic flow downstream the oblique shock wave shapes the recirculation zone in a form of a liquid wedge between the separation point and the top of the tab profile(Reference Chang10), Fig. 1. At the top of the wedge, the boundary layer is separated downstream and the pressure is redistributed, generating an additional pressure force on the nozzle walls and inflicting summary thrust vector direction inclination. The side force depends mainly on the size and the level of the redistributed pressure in the recirculation zone (Fig. 2). On the other hand, thrust losses depend mainly on the size of the part of the nozzle exit plane covered with the jet tab—the so-called shadowed area As (Fig. 1).

Figure 1. Schlieren photography of the two-dimensional nozzle with the tab in the wind tunnel during the cold flow test.

Figure 2. CFD simulation of the two-dimensional cold flow test. Pressure contours and typical pressure distribution on the nozzle lower wall in the nozzle without (left) and with jet tab (right). Streamlines in the recirculation zone (below).
A basic task for the TVC system design is to generate a side force with required intensity and duration based on the explained principles. The best performance of the system is obtained when thrust losses are minimal for the required values of the side forces. The optimum TVC system performances can be determined using the two characteristic values, the side force intensity and the thrust loss, which have to be taken as the prime optimisation criteria:
1. The required value of the generated side force FB, which can be represented as the relative side force, as a ratio to the mean thrust T:
 ${{{\bar F}}_{{B}}}{\rm{ = }}{{{{{F}}_{{B}}}}}/{T}$;
2. The minimum counter-thrust defined as the thrust loss FA, which can be also expressed as the relative thrust loss:
 ${\bar F_A} = {{{F_A}}}/{T}$.
The first step in this research is to discover and evaluate the influence of flow separation and pressure distribution, and to determine the main parameters that could be taken as design elements for the TVC integration with the nozzle as a flow source.
3.0 EXPERIMENTAL AND NUMERICAL RESEARCH OF THE TWO-DIMENSIONAL COLD FLOW
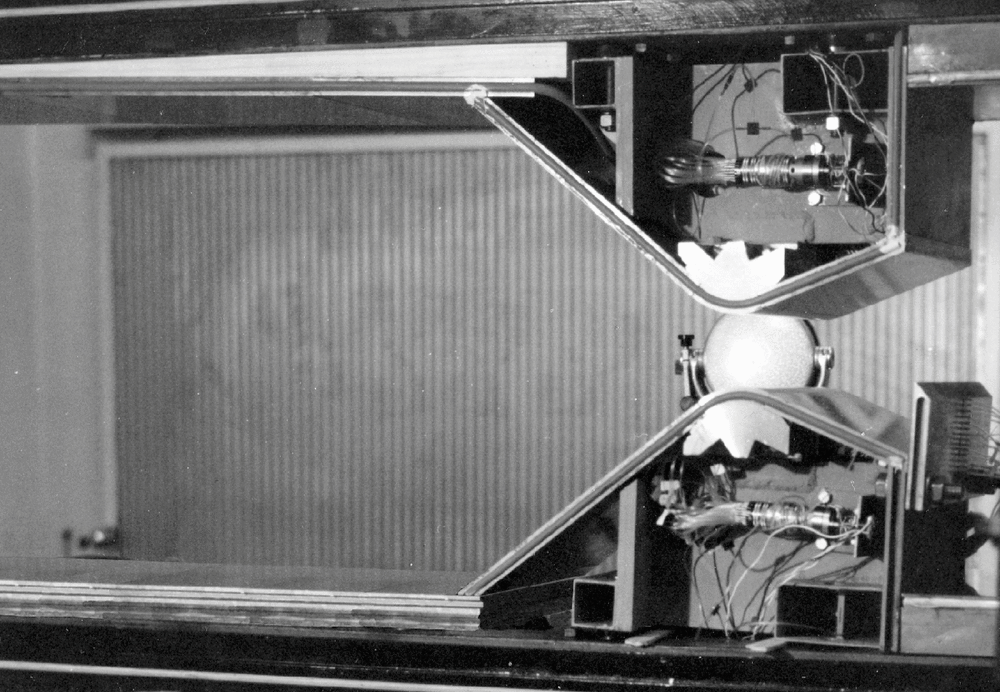
Some of the results from earlier wind-tunnel examinations will be presented in this section to illustrate cold flow gasdynamic phenomena, which is important for the actual research. The experimental model with a test bed, in the test section of the wind tunnel, is shown in Fig. 3. In these cold flow tests, the atmospheric air is used as the working fluid, driven by the vacuum tank at the rear end of the wind tunnel. During increasing of the pressure level in the outlet vacuum tank, from 5 mbar to 50 mbar, the expected testing process was running. Mach numbers of the two tested nozzles were 2.3 and 2.6, with expansion rates values of 1.9 and 2.9, respectively, and both nozzles were under-expanded. Reynolds numbers in those two cases were 9.7E6 1/m and 1.1E7 1/m, respectively. Generally, turbulence of incoming supersonic flow has a strong influence on the separated flows, as stated by Chang(Reference Chang10). He reported that shock waves shape, position, pressure distribution and diversification of boundary layers into the sublayers depend on incoming Re numbers. On the other hand, Ostlund(Reference Ostlund11) described the separation mechanism as insensitive at high Re numbers larger than 105. In those conditions, the author stated, the separation point and pressure distribution in the recirculation zone are dependent only on the incoming Mach number. This is also accepted as the assumption in the present paper.

Figure 3. Experimental model in wind-tunnel test chamber for the two-dimensional cold flow test.
In the cold flow tests, in the divergent part of the nozzle, relatively low static temperature of air (about 150º K) is expected. This is moderate difference, relative to nozzle walls temperature, but heat transfer on the nozzle walls can be neglected, because of the short time exposition during the experiment.
The flow visualisation is enabled with a two-dimensional model of convergent-divergent nozzle with one tab at the exit plane. The shadowed area is principally a segment of the exit area blocked by the involved stream obstacle. Changes in the values of this area are achieved simply by replacing the obstacle position normal to the main stream flow referred to the nozzle axis (Fig. 3). The basic gas dynamic processes are identified and pressure distribution is measured in the separated flow, formed as the recirculation zone. Some relationships can be successfully explained by analysing the Schlieren photography from these experiments (Fig. 1). Based on these experiments, further conclusions can be made:
• Geometry parameters of the divergent supersonic part of the nozzle, together with the tab position, define the recirculation zone shape, size and pressure distribution. Consequently, these parameters have the strongest influence on the effects of the side force generation.
• The shadowed area is the most influential geometry parameter in terms of the recirculation zone size and the generated shock wave position. Increasing the shadowed area increases the recirculation zone size. The shadowed area influence depends on the incoming flow parameters such as Mach number, expansion level, etc. This is noticeable in the test with the nozzle expansion ratio variation (to be explained below).
• The boundary between the recirculation zone of the supersonic stream beyond the oblique wave stretches between the top point of the tab and the separation point of the boundary layer on the nozzle surface (see Fig. 1). Some successful empirical correlations, such as the characteristic point position in the recirculation zone and pressure distribution, are given by Schilling(Reference Schilling12), Jojic(Reference Jojic, Milinovic, Stefanovic and Blagojevic5) and Waithe(Reference Waithe and Deere13).
The observations in these experimental researches were verified by the two-dimensional CFD simulations with the FLUENT program by Kozic(Reference Kozic and Ristic8) using the k-ω turbulent model. Tian(Reference Tian and Lu14) reported better performances of the Goldberg's k-ε-Rt model, and Balabel(Reference Balabel, Hegab, Nasr and El-Behery15) found best performances for similar applications using the transport SST turbulence model, with respect to experimental data. A new CFD testing in FLUENT for two-dimensional TVC nozzle experiments, provided by Zivkovic(Reference Zivkovic, Milinovic and Adamec9), also confirmed most of the mentioned conclusions. In those simulations, the SEGREGATED solver is used with the SIMPLE algorithm and second-order upwind discretisation schemes—terminology taken from(16). The transition SST turbulence model is proved to be the best one for this type of gas flow. This turbulence model is designed to better resolve the transitional processes which lead to the boundary layer separation(16).
Figure 2 shows the particular flow regions observed in the CFD test. The following conclusions can be drawn from the simulation, based on the experimental flow measured data:
• The boundary of the recirculation zone is slightly curved under the supersonic flow downwind of the oblique wave due to the pressure balance of the supersonic stream and the recirculation zone.
• One large and several smaller eddies in the main and secondary recirculation zones are created under the influence of the viscous forces on the boundary of supersonic main flow and recirculation zone stream. Only a few largest eddies are clearly visible in Fig. 2.
• The velocity in the recirculation zone is subsonic and much lower than the velocity in the supersonic stream.
• Jojic(Reference Jojic, Milinovic, Stefanovic and Blagojevic5) stated that for two-dimensional nozzles and for one type of gas, the pressure level in the recirculation zone is approximately constant (the plateau pressure, as also denoted by Chang(Reference Chang10)), and depends only on the pressure and the Mach number at the separation point.
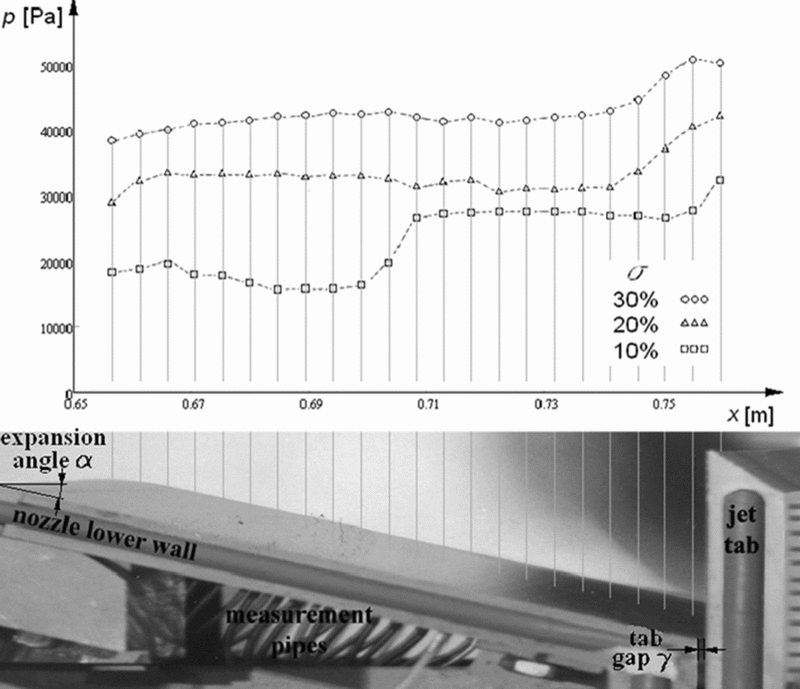
Two-dimensional cold flow tests also show approximately constant pressures in the recirculation zones on the nozzle surfaces (Fig. 4). This is expected because the flow velocity in the recirculation zone is low, and a static pressure level is mainly defined by the shock wave as well as by the vortices total pressure losses(Reference Jojic, Milinovic, Stefanovic and Blagojevic5). Figure 4 shows the pressure distribution (p) at the lower nozzle side, along the nozzle axis position (the x-axis), measured in the experiments, as presented by Zivkovic(Reference Zivkovic, Milinovic and Adamec9). The results are displayed for three experiments, with 10%, 20% and 30% of the shadowed area As relative to the nozzle exit area Ae (the shadowed ratio σ = As/Ae). The lowest curve matches the experiment with the 10% shadowed ratio. The separation point is positioned in vicinity of the middle of the nozzle length. Pressure decreases during expansion, and after the separation point, it suddenly jumps to a constant level in the recirculation zone (plateau pressure). In the other two experiments, the separation point is positioned upwind of the first measured point and both other curve levels correspond to the estimated plateau pressure in the recirculation zone. As expected, the plateau pressure increases with a higher level of the shadowed ratio.

Figure 4. Shadowed ratio influence on the pressure distribution on the lower nozzle wall in the two-dimensional cold flow test (diagram above) and lower nozzle wall configuration (below).
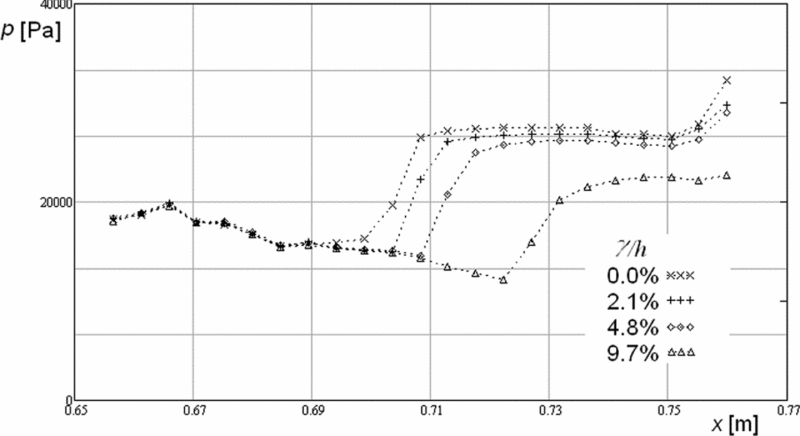
The appearance of a gap between the tab and the nozzle exit plane (the tab gap γ in Fig. 4) also has an effect on the recirculation zone position, which is similar to the effect of the shadowed ratio decrease. This could be an important performance criterion for the thrust vector control system design. Based on the earlier experience with the rocket motor TVC system operation, problems related to the small tab gaps due to thermal dilatation and the combustion products condensation are expected. The larger tested values of relative gaps in the 2D simulations and experiments are examined with the aim of obtaining a broader perspective on the tabs using and the process understanding. Increasing the gap moves the separation point position towards the exit plane, and the pressure level decreases (Fig. 5) due to gas leaking through the gap, i.e. the gap ejects the mass from the recirculation zone. This is the most important experimental conclusion obtained from the final presented data. The mass flow rate through the gap is proportional to the gap size, and it is evident from Fig. 5 that the plateau pressure and separation point position will be also proportional to it. The comparison between the experiments with different expected gaps is shown in Fig. 5. The values of the gaps are expressed by the gap-to-exit-plane height h ratio.

Figure 5. Gap influence on the pressure distribution on the lower nozzle wall in the two-dimensional cold flow test.
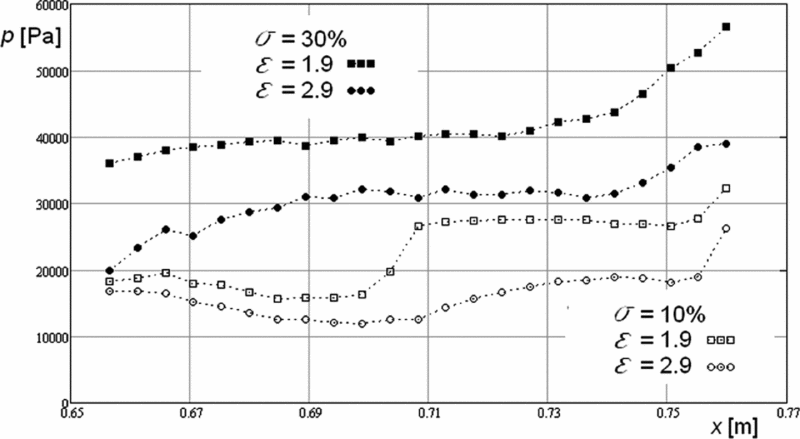
The convergent-divergent nozzle expansion rate ε = Ae/At (the nozzle exit to the throat area ratio) and the expansion half-angle α (Fig. 4) also have significant influence on the recirculation zone. Experimental research in the cold flow tests includes the comparison between two values of the expansion rates 1.9 and 2.9. Comparing those two nozzle configurations at the same shadowed ratio 10% and then at 30%, the nozzle with a lower ε has higher plateau pressure in both cases (Fig. 6). Comparing curves with 10% shadowed ratio as a more obvious case, the curve for the 1.9 expansion rate has a higher pressure level in the entire divergent part of the nozzle; consequently, the separation point pressure will be also higher. As mentioned, this leads to a higher value for the plateau pressure and the separation point position is closer to the nozzle throat (Jojic(Reference Jojic, Milinovic, Stefanovic and Blagojevic5)). Generally, in nozzles with lower expansion rate values, higher plateau pressure values can be generated, and it is considered to be closer to the optimum configuration.

Figure 6. Expansion rate influence on pressure distribution on the lower nozzle wall for two values of the shadowed ratio in the two-dimensional cold flow test.
For the determined gas flow parameters, the considered geometry parameters of the flow domain influencing the separation point position and the recirculation zone shape in the present research are:
• shadowed ratio – σ;
• tab gap – γ;
• nozzle expansion ratio – ε.
Wind-tunnel test equipment does not allow for direct thrust components measurement. The main purpose of this type of research is the analysis of separated flow phenomena. Hypothetically, the expected side force could be calculated like the pressure integral of the recirculation zone area, as a component perpendicular to nozzle axis direction. Axial components of the thrust cannot be calculated from the measured pressure profiles. The measurement of the thrust force components and effects of the mentioned parameters on the side forces and thrust losses were tested on the three-dimensional nozzle geometry. The research is realised by the three-dimensional tests equipment and qualitatively compared with above described two-dimensional cold flow tests.
4.0 THREE-DIMENSIONAL EXPERIMENTAL TEST EQUIPMENT
The second phase of the research was conducted with an experimental three-dimensional TVC system with the flow domain geometry similar to the missile(Reference Zivkovic6). The experimental system is designed to enable a large number of experiments and to vary different design parameters within their threshold origins and values.
The variable parameters influencing the performances are:
• shadowed ratio – σ;
• tab gap – γ;
• nozzle expansion ratio – ε;
• nozzle expansion half-angle – α.
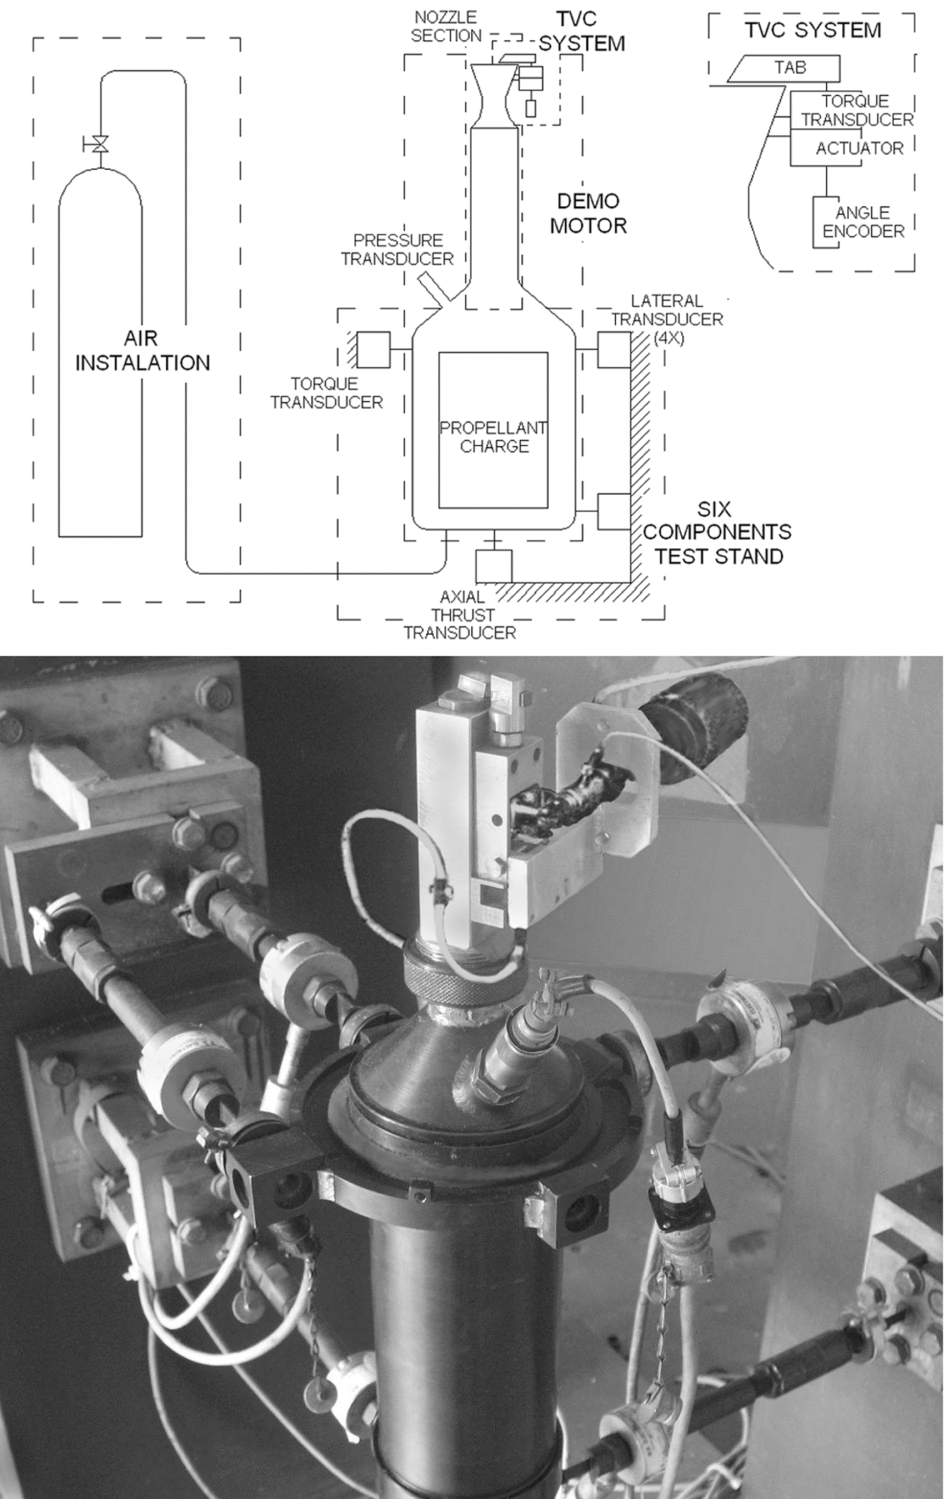
The experimental three-dimensional test equipment is shown in Fig. 7, and main components of this system are:
• six-component test stand, with the acquisition system;
• experimental demo rocket motor;
• experimental TVC system with the command system;
• air supply installation for cold flow tests;

Figure 7. Experimental equipment for three-dimensional tests (below) and functional scheme.
and appropriate components such as nozzles, transducers, encoders, etc. shown in Fig. 7.
The measurements provided data with the next estimated accuracy level:
• thrust components: accuracy of 0.5% for thrust and 1.5% for side force;
• total pressure in the chamber: 0.5% accuracy;
• the tab position: 1.5% accuracy;
• drag of the tab motion through the jet as measured by the torque transducer: 1.5% accuracy.
The system operates optionally as a cold or hot test installation with the same flow geometry. Preliminary performances are selected by cold flow tests, using the high pressure air. The hot flow tests are conducted using combustion products provided by the demo rocket motor with double-base solid propellant charges.
Six component loadings of thrust vectoring are measured, three components of the force and three components of the moment, which are calculated using data from the test stand designed for simultaneous data collecting of the thrust vector intensity and the vector space position(Reference Gligorijevic, Zivkovic, Subotic, Kozomara, Nikolic and Citakovic7). The nozzle section of the demo motor provides a variation of different nozzle geometry parameters: the expansion ratio and the angle of expansion. The experimental TVC system is attached to the nozzle section of the demo motor. The tab support allows axial positioning for the tab gaps testing. The tab operates by a controlled angular motion from the zero position (out from the jet of the nozzle) to a threshold up to 0.5 of the shadowed ratio. The shadowed ratio is part of the blocked exit area made by the tab, which is a circular segment of the exit nozzle surface determined by the tab penetration depth into the main stream. Angular motion of the tab provides required penetration depth and proportional values of the shadowed exit area. This requires a measuring transducer: an angular encoder that controls these values regarding the nozzle and tab geometry with appropriate software and hardware. The tab makes angular motions within given angles and opens the shadowed exit nozzle area. The mean values of the thrust and the side force are adopted from the tab operating cycles.
5.0 THREE-DIMENSIONAL EXPERIMENTAL RESULTS AND ANALYSES
During this research, most of the conducted experiments involved cold flow tests. In the experiments, the air pressure in the RM chamber is maintained at constant level of about 35 bar and the corresponding mass flow rate trough nozzle was about 0.31 kg/s. Estimated flow Reynolds number is 1.7 × 10⁷ regarding semi-empirical calculation for the rocket motor geometry by Dobrovolskiy(Reference Dobrovolskii17).
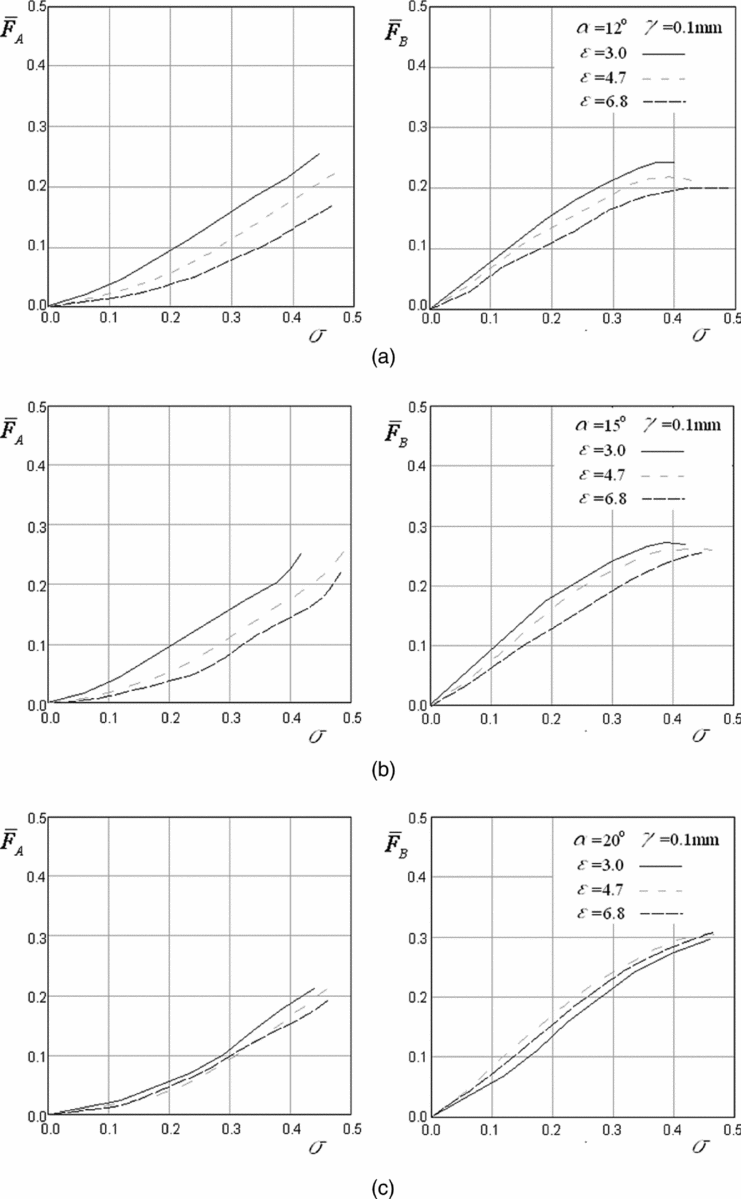
The geometry parameters, which are varied in the cold and hot flow tests within the following ranges of significance for this analysis, are:
• σ = 0 to 0.45;
• γ = 0–0.5 mm;
• ε = 3, 4.7 and 6.8;
• α = 12°, 15° and 20°.
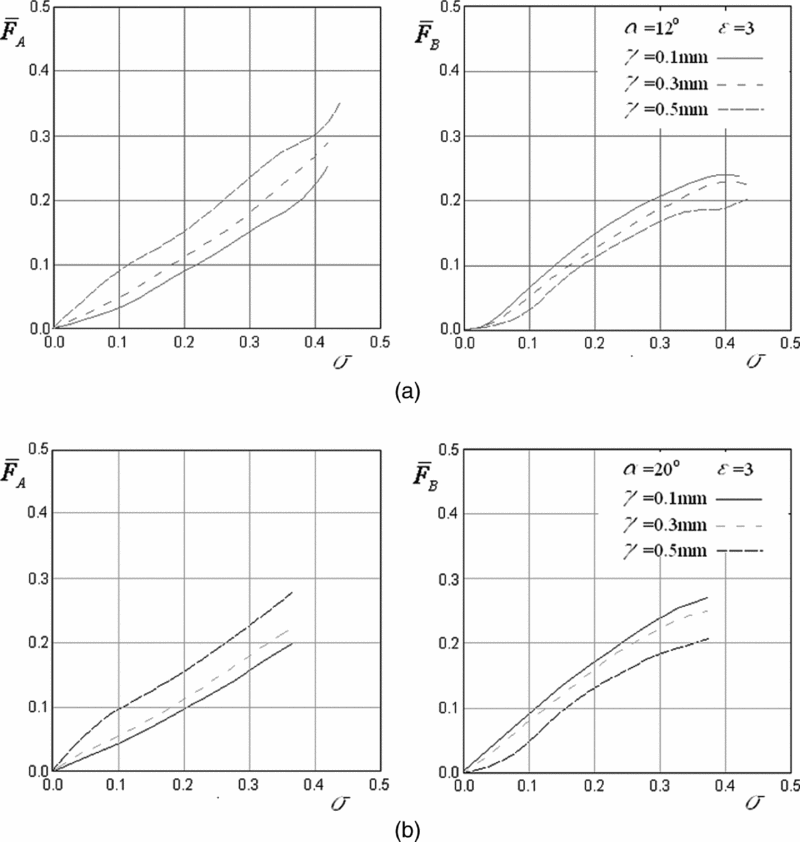
Figure 8 shows the results from six experiments of the shadowed ratio effects on the trust losses and the side force. Different gaps were discovered on the two used types of nozzles; for half-angles of the nozzle divergence α = 12° (Fig. 8(a)), and for α = 20° (Fig. 8(b)), both with the expansion ratio ε = 3. The goal of the experiments was to test the influence of the designed values of the gaps of 0.1 mm, 0.3 mm and 0.5 mm, obtained by tab operations, on the generated loading in the continual process of exit area shadowing. The experiments confirm that the decrease of the tab gap value for the same shadowed ratio produces the increase of the side force. This is in accordance with the two-dimensional experiments presented in Fig. 5. The plateau pressure in the separation zone is highest for the zero tab gaps, which produces the best generation of the side force. The thrust loss is more significant with increasing tab gaps (Fig. 8).

Figure 8. Shadowed ratio influence on the trust losses and the side force for different gaps and two values of divergence half-angles.
Figure 9 shows the results from nine experiments of the shadowed ratio effects on the thrust losses and side forces, with the expansion ratio variation values of 3, 4.7 and 6.8 for three different divergence half-angles of the nozzle. Larger expansion rates show smaller side force values and smaller thrust losses as a function of the shadowed ratio. Increasing the nozzle expansion half-angle from 12° (Fig. 9(a)) to 15° (Fig. 9(b)) diminishes this difference and, at a half-angle of about 20° and greater (Fig. 9(c)), it could be expected that the effect of the nozzle angle increase 'throttles' the expansion rate influence on the side force, analogous to the case of the thrust loss. The principle and the basic 2D conclusions about the generation of higher side thrust forces with a lower expansion ratio (Fig. 5) are proved in these 3D experiments.

Figure 9. Shadowed ratio influence on thrust losses and side force for different expansion rates and three values of divergence half-angles.
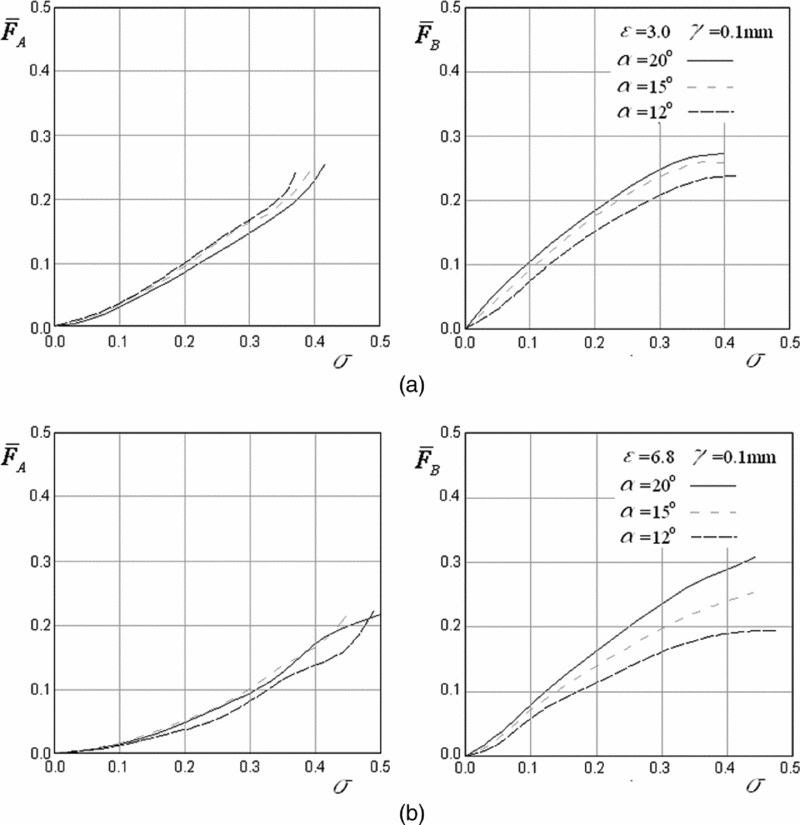
In Fig. 10, a variation of the same basic function of side forces and thrust losses vs the shadowed area is realised by a variation of the nozzle expansion half-angles from 12°, 15° and 20° given for two nozzle expansion ratio values of 3 and 6.8 (Fig. 10(a) and (b), respectively). The side force generally increases with the increase of the half-angle, and the thrust loss is almost insensitive to this change. These results conform to the conclusion about thrust losses discovered in the previous result, shown in Fig. 9, namely that thrust losses are higher at the lower expansion rates. Side forces are less sensitive to the nozzle expansion angle change at a lower expansion rate (value 3, Fig. 10(a)) than at a higher one (value 6.8, Fig. 10(b)).

Figure 10. Shadowed ratio influence on the thrust losses and side force for different half-angles of divergence and two values of the expansion rate.
6.0 CFD SIMULATIONS AND TESTS ANALYSIS
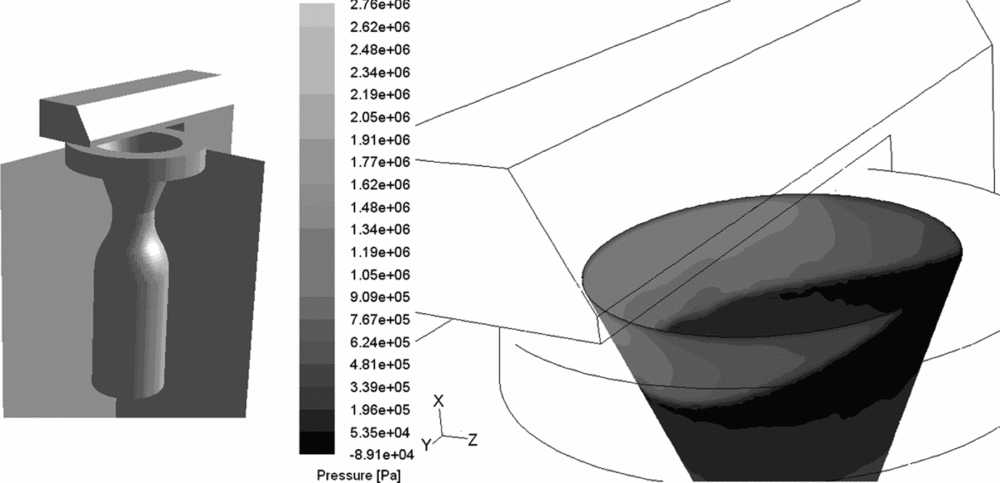
In order to evaluate the quality and quantity of the forces generation processes of a TVC system, additional CFD simulation tests are performed on selected influencing parameters discovered in the mentioned research works as optimal and applicable for a real missile TVC system. The three-dimensional CFD simulation is conducted using the FLUENT program. The model geometry similar to three-dimensional experimental nozzle and the TVC system elements are shown in Fig. 11, prepared for the quasi-steady-state calculation by changing of appropriate geometry parameters. Dynamical CFD testing was not performed.

Figure 11. CFD model geometry and the pressure distribution on the inner surface of the nozzle.
The CFD simulation is verified by the comparison with the three-dimensional experiments with the nozzle geometry parameters of α = 20º, ε = 3 and γ = 0.3 mm. Based on the experience with simulation of two-dimensional tests, the same calculation parameters are used: SEGREGATED solver with the SIMPLE algorithm, second-order upwind discretisation schemes and the transition SST turbulence model.
Pressure distribution on the nozzle internal walls is presented in Fig. 11. Effects of three-dimensionality, such as conically curved shape of recirculation zone, are noticeably conditioned by the conical nozzle wall. The jet tab position generates shock waves covering almost the entire nozzle exit surface in position to generate the maximum available side force.
The ‘pressure inlet’(16) boundary conditions are deployed in simulations: total pressure 28.3 bar, as a mean value of chamber pressure, measured in the experiments; and total temperature 300°K. Necessary turbulence parameters at inlet are chosen as recommended by the FLUENT user's guide(16): the intensity level is 2% estimated by mentioned Dobrovolskiy's(Reference Dobrovolskii17) equation, the hydraulic diameter equal to the inlet diameter is 12.5 mm, and the intermittency factor is 1.
The sphere around the nozzle exit and TVC elements, whose diameter is ten times larger than the nozzle exit diameter, is chosen for the “pressure outlet”(16) boundary. FLUENT default backflow atmospheric values are chosen at the outlet: standard pressure level, temperature 300°K, turbulence kinetic energy 1 m2/s2, specific dissipation rate 1 s−1 and intermittency factor 1.
All other surfaces of the model are the walls, with the default roughness parameters and negligible heat transfer flux.
In the transition SST turbulence model, the boundary layer flow can be calculated applying wall functions or enhanced wall treatment(16). Using fine mesh resolution with the y+ level close to one is preferable for highly accurate modelling of boundary layers, including precision prediction of laminar-turbulent transition. In two-dimensional geometry, it is fairly easy to fulfil this requirement, as well as in simple three-dimensional cases as described by Jaunet(Reference Jaunet, Aymer, Collin, Bonnet, Lebedev and Fourment18) or Zmijanovic(Reference Zmijanovic, Rasuo and Chpoun19). However, in a more complex three-dimensional geometry grid generation, it is very hard to fulfil the recommendations with moderate mesh sizes and acceptable computational cost, as with geometry presented by Tian(Reference Tian and Lu14). The advantage of the SST turbulence model is the flexible approach of near wall treatment using wall function or enhanced wall treatment model. During the iterative process, the solver calculates the local values of y + based on the grid size, flow parameters and fluid properties. The interdependency of y + value software makes the decision which approach will be used. Less accurate estimation of boundary layers separation process is expected with wall functions approach than for the enhanced wall treatment models(16).
The grid dependency is tested on a coarse mesh with about 64,000 cells in a divergent part of the nozzle. The achieved dimensionless wall distance y+ level in the recirculation zone is over 200, the nozzle gap is resolved with four layers of cells, and almost the entire boundary layer is placed in the first row of the cells adjacent to the nozzle walls. Using the adaptation technique in FLUENT, every cell in this zone is divided into four cells. A new mesh has about 510,000 cells in a divergent part of the nozzle, and has y+ level about 100. In the final refinement step, the mesh has 4,100,000 cells and a y+ level of about 50. During calculation, a very low level of residuals is achieved in all models: for turbulence governing equations nearly 10–4, and for other equations even lower than 10–5. Table 1 gives calculated values of the side force and thrust losses in those three cases. There is no large difference between the results for all three models, so it can be concluded that mesh is acceptable in all those cases.
Table 1 Grid dependency testing results

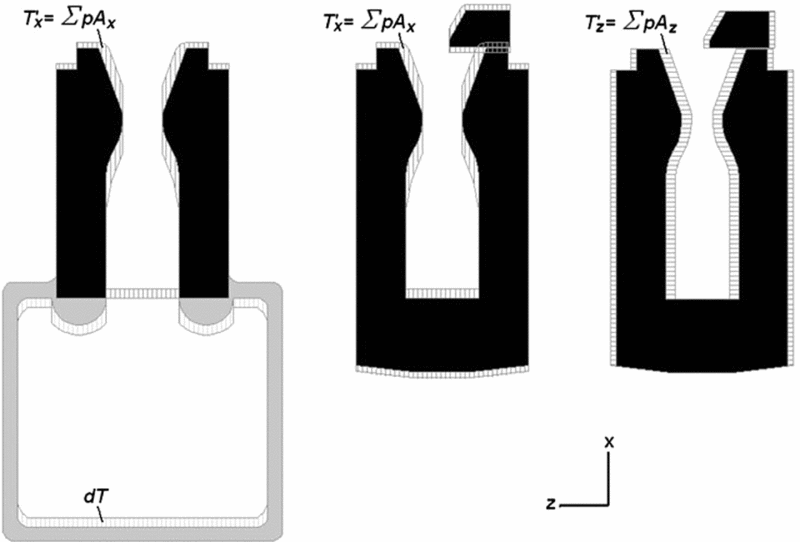
The calculation procedure for the thrust, side force and thrust loss components is based on the standard grid numerical integration in the FLUENT program. The calculation of the thrust components is conducted using force determination as the pressure integral on the nozzle, the jet tab and the motor walls. The side force and the axial thrust are calculated as the pressure force integral components in the z direction and the x direction, respectively (Fig. 11). The computational procedure is described by Zivkovic(Reference Zivkovic6). The calculation is based on the ‘thrust definition approach’(Reference Zivkovic6) using the ‘force report’ tool for pressure force calculation in the FLUENT as:
where motor internal surfaces area is Ai, and external surfaces area is Ao.
As described in the above-mentioned paper, the thrust components can be calculated using the so-called reduced geometry model, where the combustion chamber flow domain is omitted and only the nozzle section and the TVC flow space are considered (Fig. 12). A calculation of undisturbed thrust can be provided using the ‘classical approach’ by the equation:

Figure 12. Scheme of the ‘thrust definition approach’ calculation method using the reduced geometry model.
where mass flow rate is ![]() $\dot m$, mean axial nozzle exit plane velocity is Ve, mean nozzle exit plane static pressure is pe, atmosphere pressure is pa and nozzle exit plane area is Ae.
$\dot m$, mean axial nozzle exit plane velocity is Ve, mean nozzle exit plane static pressure is pe, atmosphere pressure is pa and nozzle exit plane area is Ae.
Using the ‘thrust definition approach’ on a reduced model, a lower value of the thrust will be obtained using Equation (1) (pressure force in the x-direction T ′x – Fig. 12, left), compared to the result obtained with Equation (2), because there is always the pressure force component generated in the combustion chamber-chamber thrust that increases thrust intensity:
Finally, thrust loss can be calculated using a simulation with reduced geometry based on the next equation (Fig. 12, middle):
where chamber total pressure is p 0, flow domain inlet area is A 0.
Calculation of the side force is simpler. Because of the symmetry of combustion chamber, the lateral component of the chamber thrust does not exist in the omitted geometry. The intensity of the side force can be calculated using the force report tool in the z direction directly (Fig. 12, right):
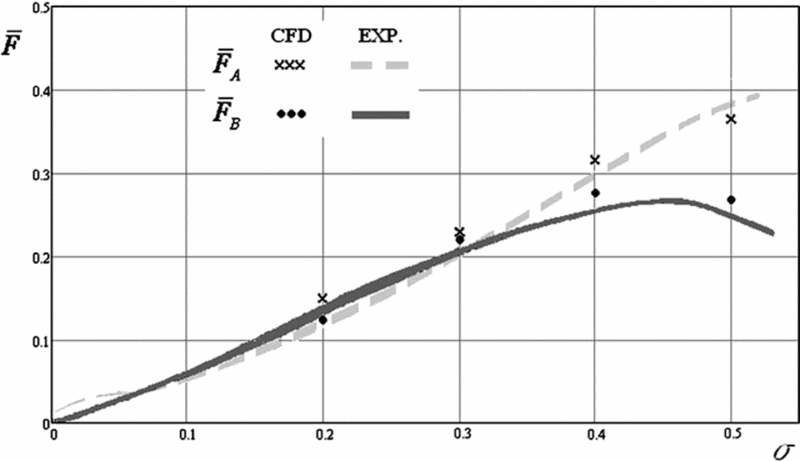
Comparing the results of CFD simulations and experiments (Fig. 13), relatively good agreement is achieved, with an error of several percent in the relative side force and thrust loss estimations.

Figure 13. Shadowed ratio influence on the thrust losses and side force, correlation between the experiments and the CFD simulation.
7.0 DYNAMIC PERFORMANCES OF THE SEPARATION ZONE IN THE REAL THRUST VECTOR CONTROL VARIATION
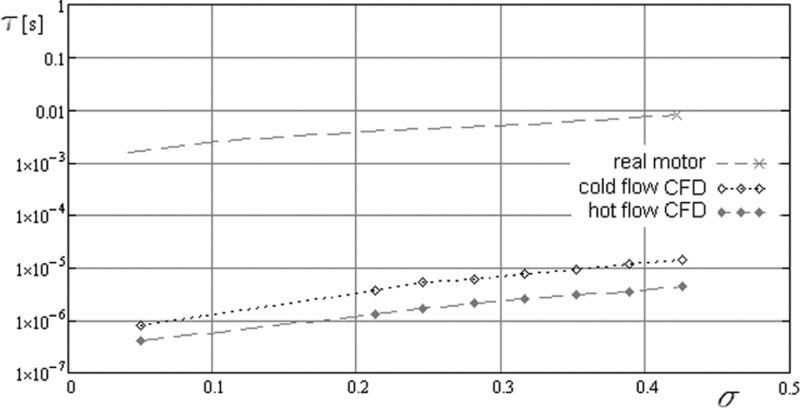
In this part of the research, the dynamic behaviour of separation flow changes was tested in order to find an optimum ratio between the frequency of tab swings and the dynamic response of the separation effect caused by the shadowing of the exit nozzle area. The main performance of the inertial behaviour of the separated recirculation zone in the nozzle is its time response, determined by the nozzle flow performances and an appropriate mass of gas captured in the circulation vortex of the recirculation zone (Fig. 11). The main time characteristic expresses the change of mass in this volume after one tab opening and is taken as a frequency of the gas-dynamic reaction on the tab position changes caused by swinging in the real TVC operation. In Fig. 14, the real-time characteristic of gas flow changes is compared against the frequency period of tabs operation in the real missile. The CFD program calculated the values of the characteristic time:
where M is the mass of the captured gas in the separation zone calculated for the plateau pressure and for other state values of gas and ![]() $\dot m$ is the mass flow rate of products in the rocket motor.
$\dot m$ is the mass flow rate of products in the rocket motor.
Figure 14 shows the changes of characteristic times vs shadowed ratio. The characteristic time of the gas flow is higher by more than two orders of magnitude than the calculated limit of mechanical systems with tabs, which leads to the conclusion that TVC could be successfully applied as a side force generator in real missile guidance conditions.

Figure 14. Shadowed ratio influence on characteristic time of the gas flow process and the mechanical tab system operation (γ = 0.1, α = 20°, ε = 3.0).
Thanks to a low hinge moment, this type of TVC has a more rapid dynamic response than other mechanical systems. The measured dynamic response on a real missile TVC is about 30 Hz, which is a high-end performance for mechanical systems in general(Reference Mangin, Chpoun and Jacquin20).
8.0 DISCUSSION
Some interesting effects of the variable geometry parameters of flow domains on the TVC performances are verified in experiments and compared against numerical simulations.
On the basis of the experimental results, it is proved that the most influencing geometry parameter on the side force generation is the shadowed ratio. A higher shadowed ratio brings the separation point closer to the throat, which means it is positioned at higher static pressures. The plateau pressure level in the recirculation zone is proportional to the static pressure in the separation point(Reference Jojic, Milinovic, Stefanovic and Blagojevic5). It is possible for the generated shock wave to cover the entire exit area and decrease the exit velocity, thereby reducing the thrust force (Fig. 11). In these cases, the maximum side force is achieved and further shadowing is ineffective(Reference Zivkovic6). Also, the shock wave sliding over the boundary layer could touch the throat, thus making a chocking effect in an extreme case. As for thrust losses, they depend on the nozzle flow disturbance, which occurs during a TVC process in the divergent part of the nozzle. A part of the stream lines is deflected in a direction different from the nozzle axis, and as a result the thrust force is decreased. In addition, the velocity of the flow is reduced after the transit through the shock wave. In TVC systems with tabs, the size of the tab surface interacting with the recirculation flow has the greatest influence on thrust loss (Fig. 11).
The level of pressure in the recirculation zone depends largely on the distance between the tab and the nozzle; this distance represents a gap through which fluid flow leaks, resulting in the plateau pressure decrease in this zone. The pressure drop is proportional to the gap size and is more significant with a larger gap increase (see Fig. 5). But even with a smaller gap increase, the separation point moves closer to the tab, so the summary pressure force rapidly decreases. Another consequence of the pressure drop is the increase of the thrust loss (Fig. 8).
The nozzle expansion rate influences the size of the recirculation zone and the plateau pressure level. Two nozzles with the same shadowed ratios, one with a higher and another with a lower expansion rate, cause different side force levels due to different plateau pressures. Nozzles with higher expansion rate have to use a greater shadowed area to achieve the same shadowed ratio.
The influence of the angle of divergence primarily reflects on the position of the oblique shock wave, which is linked with shock flow blocking of the nozzle exit, as above mentioned. Smaller nozzle divergence angles lead more rapidly to the maximum side force and consequently make this type of TVC more sensitive to shadowing. Therefore, the system becomes less effective.
9.0 CONCLUSION
The paper considers the flow chart modelling of combined thrust vector control research based on the generation of the gas dynamic side force. The research deals with two-dimensional and three-dimensional cold flow tests, some aspects of the real three-dimensional hot flow tests, and CFD simulations of particular phenomena of gas dynamic and geometric relations influencing the design of real TVC systems. The model is developed from the physical behaviour of a supersonic flow constrained by an obstacle in the cone flow conditions. The developed behaviour is adapted for the TVC generation and the consequences of its influence on the intensity and direction of the major thrust force is discussed. The dynamic testing shows a good agreement of the characteristic time gas flow in the recirculation zone as the inertial transformations of transient changes compared with transient time initiated by frequent tab disturbances as the main source of the major disturbed flow phenomena. This comparison could be valid as an average estimation of the unsteady state influences on the guidance process by this flow type of coupled controllers aimed for the TVC on small tactical missiles.


