


NOMENCLATURE
- H
incompressible shape factor
- h
height of the microramp
- L
upstream influence length
- M
Mach number
- P
static pressure
- R
radius of the body
- r
radial coordinate
- r+
 ${{rV\tau } \over \nu }$
is the radial coordinate on wall units
${{rV\tau } \over \nu }$
is the radial coordinate on wall units- s
Inter-device spacing along the cylinder surface
- V
Velocity
-
$V\tau $
-
$\sqrt {{\tau \over \rho }} $
is the frictional velocity
- x
Axial/Streamwise Coordinate


- δ
boundary layer thickness measured up to 99% of MInf
- δ *, δ **
displacement and momentum thickness
- ν
kinematic viscosity
- θ
azimuthal coordinate
- c
cylinder
- i
incompressible boundary layer quantities
- Inf
freestream condition
- max
peak or maximum value
- min
minimum value
- MVG
micro vortex generator
- O
stagnation/total condition
- Sep
separation characteristics
- UC
uncontrolled Interaction
- x
quantities measured along the axial direction
1.0 INTRODUCTION
In flare-stabilized rockets and missiles travelling at supersonic/hypersonic speeds, the conical shock wave generated by the axisymmetric compression corner subjects the incoming flow to an adverse pressure gradient. When fluid inside the boundary layer that is growing over the vehicle body is unable to overcome this due to lack of momentum, it is forced to halt and retreat, leading to the formation of a flow separation region(Reference Vishwanath1,Reference Delery2) . Detrimental effects due to such shock-induced separations like high aerodynamic drag, oscillating side-loads and unsteady wall heating etc. not only affect the performance of the vehicle but may very well turn catastrophic by inducing structural fatigue and ultimately failure(Reference Dolling3,Reference Kistler4) . Hence, these interactions are vital aspects that are to be carefully investigated during the design and development of long-range ballistics and launch vehicles having such axisymmetric compression corners. It is also imperative to bring out effective flow control strategies that will mitigate these hazardous effects and ensure a better performance and longevity of such high speed aerospace systems.
Earlier investigations(Reference Kuehn5–Reference Kontis11) in the area of flare-induced shock - boundary layer interactions examined the fundamental nature and characteristics of these interactions. The influence that various flowfield parameters such as Reynolds number, Mach number, flare angle, nose shape and corner bluntness had on the strength, structure and scale of these interactions have been well documented. Comparing these flow features (Fig. 1) with those from the interaction flowfield due to a planar wedge revealed similarities in shock patterns and in pressure and heat transfer rate distributions(Reference Settles, Bogdonoff and Vas12). But, the conical shock produced by the axisymmetric compression corner (flare) is weaker than the oblique shock produced by its planar counterpart due to the three-dimensional relieving effect(Reference Taylor and Maccoll13). Therefore, the pressure rise was observed to be significantly less due to a flare than it was due to a wedge with the same flow turning angle and under the same free-stream conditions. Consequently, flow deflection angle corresponding to incipient separation is higher for axisymmetric compression corners(Reference Coleman and Stollery14). Studies also showed that, in some flowfields with shock-induced flow separations, there is a rhythmic expansion and contraction of the separation bubble due to the mass imbalance between the fluid displaced from the separation region and fluid returned at the reattachment location(Reference Maull15). This periodic change in the size of the separation bubble induces an oscillatory motion of the shock structures in the flowfield(Reference Verma and Koppenwallner16,Reference Priebe and Martin17) that is responsible for the unsteady pressure and heat transfer loads on the structure of the aerospace vehicle.

Figure 1. Schematic representation of the shock-wave - boundary-layer interaction at the vicinity of a compression corner.
Although it is impossible to eliminate shock-boundary layer interactions from these high-speed flowfields, it is essential to alleviate or reduce its undesirable effects for better performance and reliability of these vehicles. Many techniques(Reference Verma and Hadjadj18) have been put forth by researchers in the past to mitigate and possibly eliminate the shock-induced flow separation such as steady(Reference Szwaba19,Reference Chidambaranathan, Verma and Rathakrishnan20) and pulsating(Reference Uzun, Solomon, Foster, Oates, Hussaini and Alvi21) microjet actuators, plasma actuators(Reference Narayanaswamy, Raja and Clemens22,Reference Deshpande and Poggie23) , shock control bumps(Reference Bruce and Colliss24), aerodynamic bleed(Reference Sriram and Jagadeesh25), magnetohydrodynamic systems,(Reference Su, Li, Cheng, Wang and Cao26) etc. A large number of these flow control techniques are employed to energize the low momentum fluid of the boundary layer that is close to the wall, thereby enabling it to better resist the adverse pressure gradient. These are broadly classified into active and passive techniques based on their ability to operate with or without additional power sources. The passive techniques are mostly known for their simplicity and low weight while the active techniques exhibit a greater flexibility during operation and have the ability to be turned on or off based on the flow-field conditions and requirements.
One of the techniques that has seen much interest in recent years is to have an array of micro-vortex generators (MVGs) in the flowfield, ahead of the interaction region(Reference Lu, Li and Liu27 – Reference Titchener and Babinsky29). These devices are sub-boundary-layer versions of regular mechanical vortex generators that are used to delay flow separation in subsonic flowfields. Depending on their design, the MVGs generate co-rotating(Reference Titchener and Babinsky29,Reference Bur, Coponet and Carpels30) or counter-rotating(Reference Babinsky, Makinson and Morgan31 – Reference Holden and Babinsky33) stream-wise vortices that entrain high momentum fluid from the upper part of the boundary layer into the low momentum region close to the wall, thereby enabling the boundary layer to more effectively resist the adverse pressure gradient generated by the shock. Various shapes(Reference Barter and Dolling34 – Reference Lee and Loth39) including standard designs such as microramps(Reference Babinsky, Makinson and Morgan31,Reference Babinsky, Li and Pitt Ford32) and micro-vanes(Reference Bur, Coponet and Carpels30,Reference Holden and Babinsky33) were introduced in different shock-boundary layer interaction flowfields to examine their ability to reduce the flow separation and alleviate its ill effects. The control performance was found to improve with increase in the size of the MVG(Reference Babinsky, Makinson and Morgan31,Reference Martis, Misra and Singh40) but so did the wave drag associated with it. Although micro-vanes offer better flow control(Reference Holden and Babinsky33), their slender shape makes them more susceptible to fracture than microramps which has a relatively robust design. Apart from their shape, the height and upstream position of MVGs from the interaction region also play a significant role in their performance. Previous studies have established that, placing these devices far away from the interaction region caused vortex circulation decay before reaching the interaction(Reference Ashill, Fulker and Hackett41 – Reference Rybalko, Babinsky and Loth44), while bringing them very close resulted in not achieving full entrainment of the boundary layer(Reference Geipman, Schrijer and van Oudheusden45). The optimal upstream location of these devices depends on their height and shape as those are the factors that determine the strength and rate of vortex circulation decay. More recently, these MVGs have been used in combination with other active control techniques such as aerodynamic bleed(Reference Titchener and Babinsky46) and streamwise injection(Reference Vaisakh and Muruganandam47) to tackle the shock-induced flow separation more effectively.
The use of MVGs for controlling the shock-boundary layer interaction due to compression corners have also proven to be fruitful. Experimental investigations(Reference Barter and Dolling34,Reference Verma, Manisankar and Raju48) showed that an array of microramps placed ahead of the compression corner pushed the separation point downstream towards the corner and reduced pressure fluctuations due to shock oscillations in the flowfield. Large eddy simulations by Yan et al.(Reference Yan, Chen, Lee and Liu49) also observed that the microramp reduced the shape factor of the boundary layer, making the flow more turbulent and more resilient to the adverse pressure gradient offered by the shock. They also illustrated that even though the microramp mitigated the boundary layer separation, their usage resulted in a small yet noteworthy reduction in the total pressure recovery. Estruch-Samper et al.(Reference Estruch-Samper, Vanstone, Hillier and Ganapathisubramani50) conducted experiments at hypersonic speeds on a flare-induced shock wave—laminar boundary layer interaction flowfield and introduced a single MVG ahead of the compression corner to locally induce boundary layer transition that will hinder the onset of flow separation. The study used surface heat transfer rate to compare the performance of square and diamond-shaped MVGs with different heights. At larger device heights they were able to obtain an attached flow throughout the interaction region with reduced-shock unsteadiness, but they also witnessed a local shock-boundary layer interaction at the vicinity of the MVG that may turn out to be counter-productive.
Present computational work aims to mitigate shock induced flow separation in a flare-induced shock-boundary layer interaction flowfield using an array of microramp type MVGs. The freestream Mach number was 3.96 and the flow turning angle (flare angle) was 25°. The boundary layer thickness (δ) at the location of the compression corner was 10.4mm (measured in the absence of the flare). A small device height of 2.27mm (h/δ = 0.22) has been chosen for this study to ensure a minimum drag penalty. The microramp array was placed at 5δ, 10δ and 15δ (22.7h, 45.41h and 68.12h, respectively) upstream of the compression corner and the modifications induced in the interaction region were analyzed to determine the optimal streamwise location. Although similar studies have been carried out in the past for planar flowfields(Reference Verma and Manisankar38,Reference Nolan and Babinsky42 – Reference Geipman, Schrijer and van Oudheusden45), to the best of our knowledge no such reports are available for axisymmetric flowfields. As the strength of the conical shock is noticeably less than that of an oblique shock, the shocks generated due to the microramps would be much weaker which may affect the control performance. The paper brings out key alterations induced by microramps in the separation bubble structure along with the changes observed in the upstream influence of the interaction. The variations in the separation bubble’s height has also been evaluated at different locations across the span of the microramp device.
2.0 COMPUTATIONAL METHODOLOGY
STARCCM+, a finite volume based CFD code is used for the numerical analyses. A steady, density-based, coupled implicit, algebraic multi grid (AMG) solver was employed to solve integral form of the Reynolds Averaged Navier Stokes (RANS) equations. The convection and diffusion fluxes were evaluated using advection upwind splitting method (AUSM)(Reference Liou and Steffen51) and their discretization was second order accurate in space. Air is assumed to be an ideal gas and its dynamic viscosity was computed through Sutherland law. The one equation turbulence model developed by Spalart and Allmaras(Reference Spalart and Allmaras52) was used for turbulence closure.
The cylinder/flare configuration that was used in the experiments conducted by Roshko and Thomke(Reference Roshko and Thomke7) was adopted as the baseline configuration for this study. The experiments were conducted in a 4-feet × 4-feet trisonic blowdown wind tunnel that was located at the McDonnell Douglas Aerophysics Laboratory in El Segundo, California. A photograph of the model mounted inside the wind tunnel is shown in Fig. 2. The outer diameter of the cylinder (Rc) was 11.94 inches (151.64mm). A 25° flare was selected for the present computations to ensure a strong flow separation around the compression corner. The distance (xc) between the cylinder’s leading edge and the compression corner was 28 inches (711.2mm).

Figure 2. Hollow cylinder/flare model used for experimental studies by Roshko and Thomke(Reference Roshko and Thomke7).
Computational domain for the present study was cuboidal (400mm × 400mm × 1500mm) in shape. Care has been taken to ensure that results were independent of the domain size. The axisymmetric model is positioned in such a way that the model axis and one of the longitudinal edges of the domain superimpose on one another, thereby placing one quarter of the model inside the domain as shown in Fig. 3. Accordingly, the boundaries AEFIJN and CDGHKL have been set as symmetry planes. Simulations were conducted for an incoming freestream Mach number of 3.96 and a Reynolds number of 30 × 106 (based on xc) [Stagnation Pressure, Po = 0.907 MPa; VInf = 676 m/s]. Stagnation temperature was assumed to be 300 K. Freestream conditions are fed into the boundaries ABCDE, ABMN and BCLM while a pressure outlet condition is given at KLMNJ. Solid boundaries were assumed to be adiabatic walls with no-slip conditions. Boundary layer thickness (δ) was measured along the wall normal direction as distance between the wall and the point where local Mach number equals 99% of the freestream Mach number. In the absence of flare, boundary layer thickness (δ) at xc was 10.4mm (Fig. 4) which is slightly larger than the experimental value of 9mm. Sonic line at that location was at 0.06mm (approximately 0.006δ).

Figure 3. Computational domain.

Figure 4. Boundary layer profile at xc in the absence of the flare.
The control devices are simple microramps that are arranged equidistant from one another in the form of an array along the circumference of the cylinder. These devices had a nominal height (h) of 2.27mm (h/δ = 0.22). As depicted in Fig. 5, other dimensions of the microramps are scaled based on its height (h)(Reference Anderson, Tinapple and Surber53). The arc length (inter-device spacing) between two consecutive microramps has been maintained as 7.5h, which allowed 14 such devices to be placed inside the computational domain. In the present study, this microramp array is located at three streamwise positions viz. 5δ, 10δ and 15δ (which correspond to 22.7h, 45.41h and 68.12h, respectively) upstream of the compression corner to observe its influence on the shock-boundary layer interaction flowfield and to bring out the optimal device location that will inflict maximum reduction of flow separation region.

Figure 5. Microramp geometry.
The flow domain was discretized using predominantly hexahedral cells and a few trimmed polyhedral cells to preserve certain crucial geometrical features. A customized surface mesh with a very high grid density is provided in the region surrounding the compression corner as shown in Fig. 6(a). Fifty prismatic layers with a stretching factor of 1.2 were provided orthogonally within a distance of 10mm over the solid boundaries to ensure that viscous regions at innermost part of the boundary layer were resolved effectively. Minimum cell wall distance in wall units along the radial direction was found to be r+ min = 0.02. A slow growth rate is provided in order to facilitate a smooth transition between the dense mesh in the regions close to the solid surfaces and the uniform mesh in the interior parts of the domain (Fig. 7(a)).

Figure 6. Surface mesh near the compression corner and over the microramps, (a) Uncontrolled; (b) Xmvg = −5δ (−22.7h) Mesh 1; (c) Xmvg = −5δ (−22.7h) Mesh 2 (Mesh 3 is not shown).

Figure 7. Cross section of the mesh depicting the prism layer and the transitory layers. (a) Over plain cylinder; over the microramp array (b) Mesh 1; (c) Mesh 2; (d) Mesh 3.
A grid independence study was conducted for the uncontrolled interaction by modifying surface mesh density in the region close to the compression corner. The prism layer and all other mesh parameters were kept intact. Three different grids were studied and their details are provided in Table 1. The wall static pressure distributions that were obtained through these grids are plotted alongside the experimental data(Reference Roshko and Thomke7) in Fig. 8. Axial position and static pressure are normalized using boundary layer thickness (δ) and freestream static pressure (PInf), respectively. Position x/δ = 0 corresponds to the location of compression corner. The graph shows a very close resemblance between the pressure distributions obtained from the experiment and those from the medium and fine meshes. The coarse mesh appears to have relatively over predicted both the scale and strength of the interaction.
Table 1 Details of the grid independence study for uncontrolled interaction

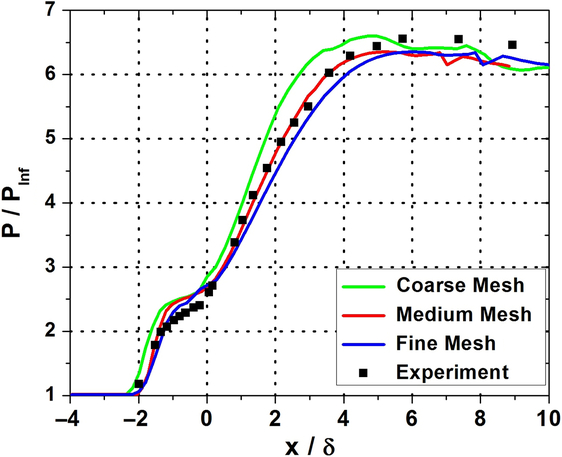
Figure 8. Computed wall static pressure distributions of the uncontrolled interaction under different grid densities with the experimental data(Reference Roshko and Thomke7).
To further quantitatively examine the results obtained from these three grids, upstream influence length on the cylinder and maximum static pressure experienced on the flare were compared with observations made during the experiments. Upstream influence length (L) is the distance from the compression corner to the upstream position where the static pressure starts to rise from the freestream value. This position is marked as the point at which static pressure value increases beyond (PInf + 6σ) on the cylinder, where ‘σ’ is the standard deviation of static pressure on the cylinder surface in the absence of the Flare. Table 2 compares the peak static pressure (Pmax) and the upstream influence data obtained from the computations performed using these grids. Medium and fine meshes predicted the same peak pressure that was 3% less than the experimental value. The axial position of this value matched exactly with the experiments while using the medium mesh but the same had shifted 0.2δ downstream when using the fine mesh. Interestingly, the coarse mesh predicted the magnitude of the peak pressure accurately, but the axial position at which this occurred was 0.8δ upstream of the experimental location. In terms of the upstream influence length, the value predicted by the coarse mesh was 13% larger than what was observed from the experimental data. On the other hand, medium and fine meshes were both in very good agreement with the experiments (2% and 2.5% variation respectively) in terms of the upstream influence length.
Table 2 Comparison of peak static pressure and upstream influence length from different grids

A separate grid independence study on Xmvg = −5δ (−22.7h) configuration was also performed to ensure that the resolution of the grid around the microramps do not affect the numerical solution. Three meshes with different parameters (Table 3) at the vicinity of the microramps were analyzed to determine the optimal grid configuration required in this region. Mesh 1 depicted in Figs. 6(b) and 7(b) had a dense surface mesh of size 1mm on the surfaces of the microramps, while the other two meshes (Mesh 2 and 3) employed an annular volumetric refinement around the microramps as seen in Figs. 6(c), 7(c) and 7(d). The devices were completely submerged inside the annular ring which extended up to 10mm above the cylinder surface in the radial direction and had a 20mm width along the axial direction.
Table 3 Details of the grid independence study for XMVG = −5δ (−22.7h) configuration

The wall static pressure distributions along the device centerline and the device gap region (the midpoint between the centerlines of two consecutive devices) were compared to check for grid dependency. The plots are displayed in Fig. 9(a) and 9(b) and they showed that deviations between the meshes are extremely diminutive (less than 1%) and hence in order to save computational power and time, the surface mesh refinement approach followed in Mesh 1 was used in subsequent simulations.
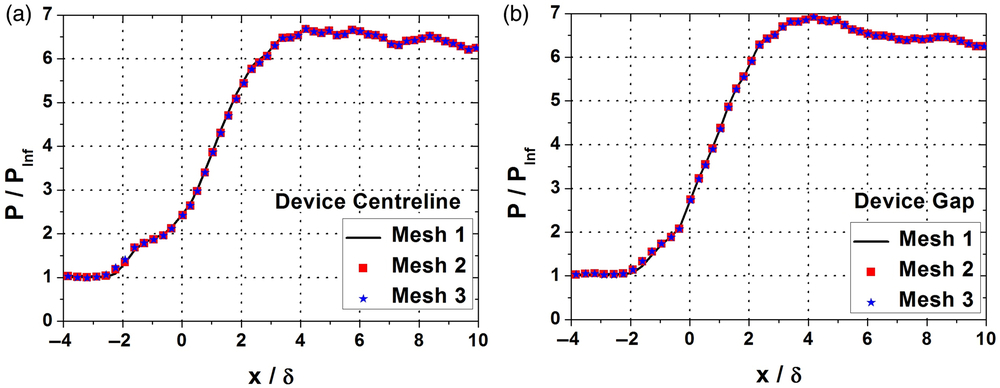
Figure 9. Comparison of streamwise wall static pressure distributions of XMVG = −5δ (22.7h) from different meshes (a) device centerline; (b) device gap.
Ability of the computational code and the turbulence model to accurately predict the interaction in the presence of MVGs had been successfully demonstrated in the previous work(Reference Nilavarasan, Joshi, Misra, Manisankar and Verma54). However, their capability to compute the flow characteristics at intricate regions in the vicinity of microramp devices is documented here by computationally simulating the experiments performed by Herges et al.(Reference Herges, Kroeker, Elliot and Dutton55) and comparing the pressure-sensitive paint (PSP) data acquired in this region with the numerical data. The static pressure distributions along five equidistant probes (P1 to P5 as shown in Fig. 10(a)) across the span of the microramp were compared with the experimental data and the comparative graphs are presented in Fig. 10(b-f).
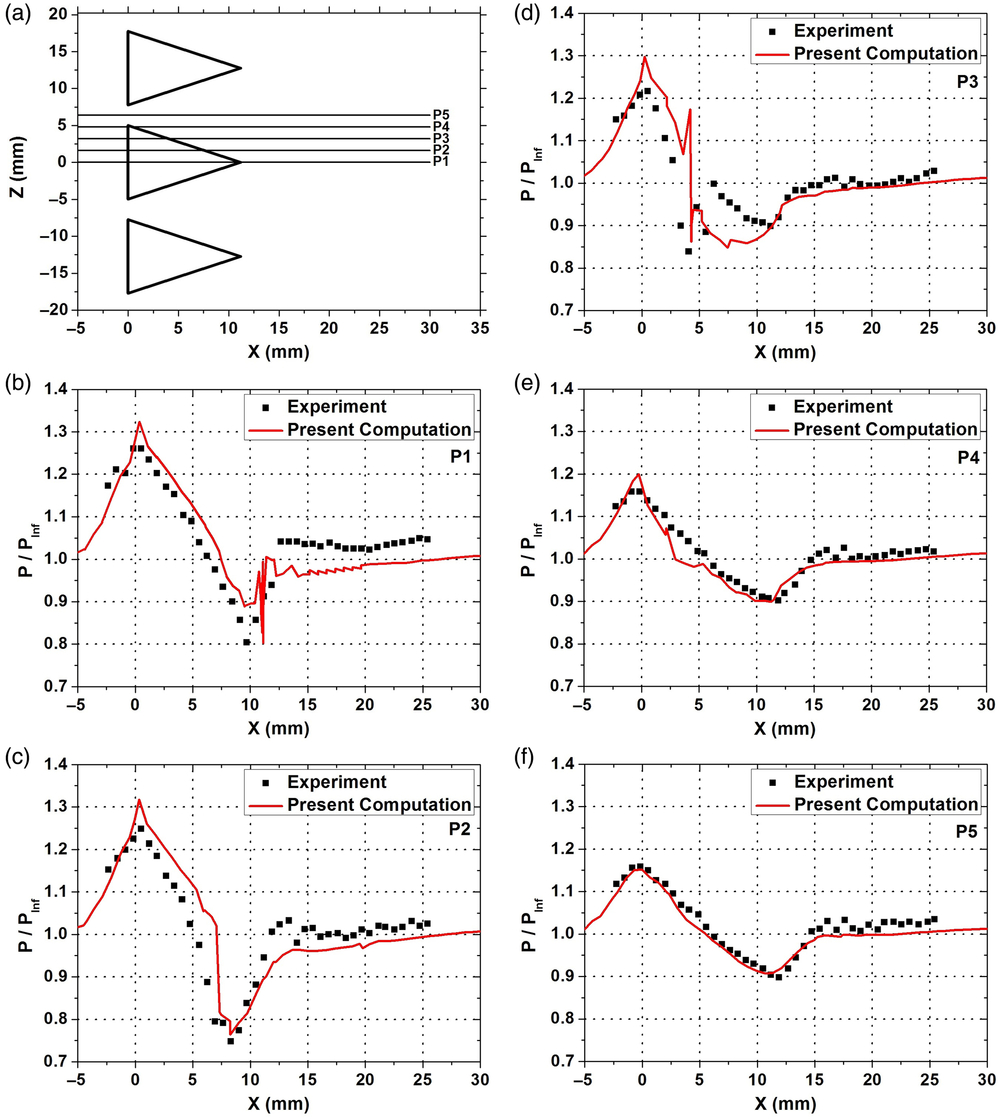
Figure 10. Comparison of experimental(Reference Herges, Kroeker, Elliot and Dutton55) and numerical static pressure distributions in the vicinity of microramps at various spanwise locations.
Present numerical results were found to be in relatively good agreement with experimental measurements except at a very few locations. The maximum deviation in each streamwise probe has been presented in Table 4. From an overall perspective, a maximum deviation of 11% was found in P3 as the simulations under predict the pressure close to the edge of the microramp.
Table 4 Comparison between PSP data and present computations

The above discussions have established the fidelity and reliability of the numerical code and the Spalart-Allmaras turbulence model that has been used in this study. It could be inferred from the above results that this numerical approach is well suited for the task of investigating microramp control of flare-induced shock-boundary layer interaction.
3.0 RESULTS AND DISCUSSIONS
3.1 Static pressure distributions
3.1.1 Surface pressure contours
The flow features at the vicinity of the axisymmetric compression corner with and without the microramp array was inspected through the surface pressure contours displayed in Fig. 11(a)-(d). The pressure plateau observed on the cylinder surface in the uncontrolled interaction (Fig. 11(a)) suggested that the shock foot might be bifurcated, which indicates the presence of a separation bubble around the compression corner. Under the influence of microramp array, (Figs. 11(b), 11(c) and 11(d)), corrugated flow patterns that were roughly sinusoidal in nature were found on the cylinder and flare surfaces. A close examination of these patterns indicated that their wavelengths on the cylinder surface were equal to the circumferential inter-device spacing between the microramps. On the flare surface, even as the wavelength increased linearly along the downstream direction, the angle suspended by the wavelength at the model axis remained constant. It can also be noted from the contours that the pressure rise ahead of the compression corner has been reduced due to the presence of the microramps. On the flare surface, higher pressure is found in the region downstream of the gap between the microramps while comparatively lower pressure is found along the device centerline.
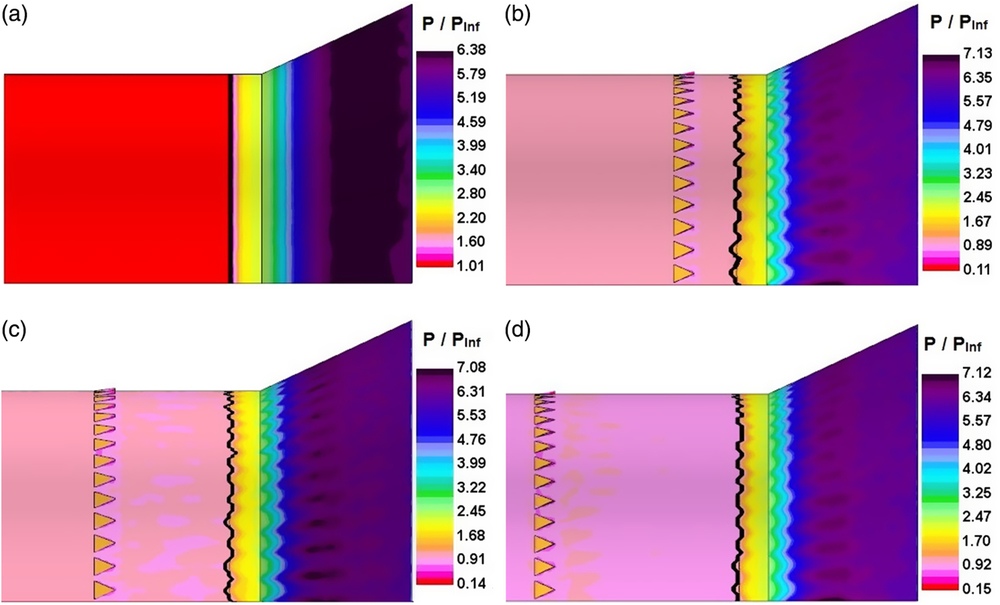
Figure 11. Surface pressures contours depicting the flowfield characteristics in the interaction region. Black line denotes the upstream influence. a) Uncontrolled; b) Xmvg = −5δ (−22.7h); (c) Xmvg = −10δ (−44.4h); (d) Xmvg = −15δ (−68.1h).
Crests and troughs of the sinusoidal pattern on the cylinder surface can be seen to have roughly aligned with the device centerline and the gap between two adjacent devices, respectively. This denotes that the upstream influence length is the longest along the device centerline and it reduces as the spanwise distance from the device centerline increases. Spanwise variation of the interaction length on the flare also seems to be coupled with that of the upstream influence length. As mentioned earlier, the upstream influence is the streamwise distance between the point where the static pressure rises beyond (PInf + 6σ) and the compression corner. In Fig. 11, a black line runs on the cylinder surface in the circumferential direction through all the points at which the static pressure value has just crossed (PInf + 6σ). The spanwise average of the upstream influence length for all the four configurations was calculated and the same is presented in Table 5. The average upstream influence length reduced when the microramps were placed upstream and the maximum reduction was observed when Xmvg = −10δ (−44.4h) and was closely followed by Xmvg = −5δ (−22.7h) configuration.
Table 5 Spanwise average of upstream influence length

3.1.2 Streamwise pressure contours
Streamwise sections of static pressure contours were used to diagnose the interaction flowfield. Three streamwise sections across the span of the microramp has been chosen as shown in Fig. 12. It is to be noted that, these locations have been selected after closely inspecting the repetitive flow structures observed in the surface pressure contours along the circumferential direction and also by taking into account the symmetrical nature of the microramp geometry about its centerline. The first probe (s1 = 0) was located exactly along the device centerline while other probes were located at a distance of one-fourth (s2 = 1.875h) and half (s3 = 3.75h) of the inter-device spacing (7.5h). It is also worthwhile to mention that the location of the probe s3 corresponds to the maximum distance away from the device centerline.

Figure 12. Location of the streamwise probes across the MVG span.
The contours obtained from Xmvg = −10δ (−44.4h) configuration (as this position corresponds to maximum reduction in average upstream influence length) are compared with that of the uncontrolled interaction in Fig. 13. The angle of the main shock was found to be approximately equal to the theoretically calculated shock angle of 31.65° (corresponding to the Mach number of 3.96 and a flow deflection angle of 25°) from the conical shock relations and was unaffected by the presence of microramps. In the region close to the solid surface, all four contours show a bifurcation of the main shock into two shocks confirming the presence of reversed flow in the region surrounding the compression corner. This region serves as an obstruction to the incoming flow inducing the formation of the separation shock. The fluid removed from the separation point hits the flare at an angle and deflects in the direction parallel to the surface by creating compression waves that coalesce together to form the reattachment shock. The interaction between the separation and reattachment shock was identified as a Type VI Shock-Shock interaction(Reference Edney56).
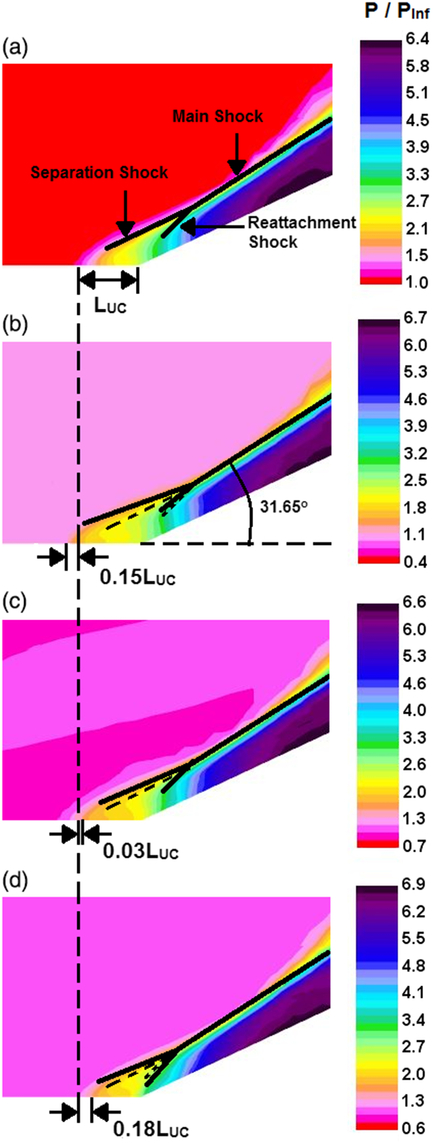
Figure 13. Streamwise sections of the interaction region depicting static pressure. (a) Uncontrolled Interaction; (b) Xmvg = −10δ (−44.4h), s1 = 0; (c) Xmvg = −10δ (−44.4h), s2 = 1.875h; (d) Xmvg = −10δ (−44.4h), s3 = 3.75h.
The local upstream influence length along s1 and s3 from Xmvg = −10δ (−44.4h) case varied noticeably from that of the uncontrolled interaction (LUC). As determined earlier from the surface pressure contours of Fig. 11, the upstream influence length was the largest along the device centerline (Fig. 13(b)), but the streamwise section showed that the value of was even larger (by 15%) than what was observed in the uncontrolled interaction (Fig. 13(a)). In the other two locations (Fig. 13(c) and 13(d)), the local upstream influence was found to be smaller than LUC and the maximum reduction of 18% was achieved at s3 = 3.75h as expected.
The uncontrolled separation and reattachment shock positions are shown as dashed lines in Fig. 13(b-d) for comparison. The separation shock angle was slightly reduced at all sections of Xmvg = −10δ (−44.4h) case resulting in the lower pressure rise that was observed on the cylinder surface in Fig. 11. Interestingly, the reattachment shock angle seemed to have also reduced along the device centerline region (Fig. 13(b)) but it quickly recovers as the spanwise distance from the device centerline increases. The strongest reattachment shock was found along s3 = 3.75h (Fig. 13(d)) where its strength was significantly greater than the reattachment of the uncontrolled interaction.
3.2 Flow separation
3.2.1 Surface flow patterns
Skin friction lines are generated on the cylinder and flare surfaces to observe surface flow patterns and to characterize modifications induced in the structure of separation bubble by Microramp arrays. These lines are generated based on wall shear stress distributions on the surface. Patterns formed by skin friction lines under all the four configurations are depicted in Fig. 14. In the uncontrolled interaction (Fig. 14(a)), the separation and reattachment lines were distinct and there was very little change in the distance between them and the compression corner location along the circumferential direction. As Microramps were introduced into the flowfield, substantial modifications were observed in the region downstream of these devices and the separation region in particular (Fig. 14(b-d)). Skin friction lines immediately downstream of the Microramps seemed to converge into the region close to the device centerline. This indicates a spanwise (circumferential) component in flow velocity from the device gap region and towards the device centreline just above the surface.

Figure 14. Skin friction lines on the cylinder and the flare surfaces. (Flow is from left to right) (a) Uncontrolled interaction; b) Xmvg = −5δ (−22.7h); (c) Xmvg = −10δ (−44.4h); (d) Xmvg = −15δ (−68.1h).
Surface flow patterns in the presence of Microramps illustrated a corrugated separation line and formation of spade shaped patterns on the cylinder surface. These observations were similar to the oil flow patterns reported from previous experimental investigations(Reference Bur, Coponet and Carpels30,Reference Babinsky, Li and Pitt Ford32,Reference Verma and Manisankar38) of normal/oblique shock-boundary layer interaction control using vortex generators. Apexes of these spade structures were roughly aligned along the centrelines of the Microramps. Additionally, striation patterns were observed on the Flare surface beyond reattachment. The number of striations and the circumferential spacing between them are in accordance with those of the Microramp array, indicating a direct association.
Separation topology in the presence of Microramps was interpreted based on the Critical Point Theory (CPT) that is widely employed in the characterization of three dimensional flow separations(Reference Delery57). The Poincare’s formula [Equation (1)] that relates the number of critical points on a two dimensional vector field to the ‘complexity’ of the surface was also used to understand the patterns formed by the skin friction lines and check the consistency of the narrative.
 \begin{equation}\sum\left({Nodes + Foci} \right) - \sum\ {Saddle\ points} = 2 - 2p \label{eqn1}\end{equation}
where ‘p’ is the complexity of the surface.
As per CPT, the complexity of the surface (p) is zero, if a closed curve on the surface could be converged into a point without departing the surface. In the present study, neither the cylinder nor the flare surfaces have any discontinuities such as holes or gaps that may obstruct the shrinkage of any closed curve on it and hence throughout this investigation, the complexity term in the above equation vanishes as shown in Equation (2).
 \begin{equation} \sum\left( {Nodes + Foci} \right) - \sum\ Saddle\ points = 2\label{eqn2}\end{equation}
According to CPT, flow over a body is said to have been separated if there exists more than two nodes and at least one saddle point on the surface flow pattern. All skin friction lines that make up the surface flow pattern must originate and terminate from a node or a focus. A node (N) has a single tangent line passing through it while a focus (F) has no common tangent. Based on whether the skin friction lines are directed inwards (converging) or outwards (diverging), the nodes and foci can be classified as separation type or attachment type respectively. Saddle points (SP) are critical points through which only two skin friction lines (hereafter called as separatrices) pass through, out of which one performs the function of preventing all other skin friction lines from reaching certain parts of the surface.
Figure 15 gives a closer look at the separation region and also depicts the wall shear stress vector fields along with the skin friction lines. The separation and reattachment lines observed in the uncontrolled interaction (Fig. 15(a)) are a series of adjacent node – saddle point combinations(Reference Zheltovodov, Knight, Babinsky and Harvey58 – Reference Lighthill and Rosenhead60). This denotes the presence of Goertler vortices which has been reported in previous compression corner interaction studies(Reference Heffener, Chpoun and Lengrand8,Reference Zheltovodov, Schulein and Yakovlev61,Reference Grilli, Hickel and Adams62) . Two separatrices lines pass through each saddle point — one that prevents the incoming skin friction lines from moving further downstream and the other one that separates the skin friction lines that converge into the nodes located on either side of the saddle point. Structure of the reattachment line is also similar to that of the separation line except that the skin friction lines diverge from the attachment nodes.
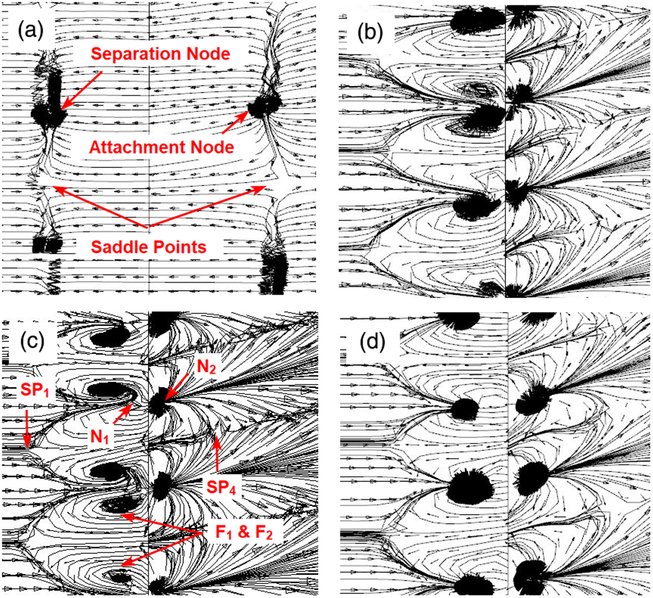
Figure 15. Critical points at the interaction region (flow is from left to right). a) XMVG = −5δ (−22.7h); (b) XMVG = −10δ (−44.4h); (c) XMVG = −15δ (−68.1h).
Figure 15(b-d) depicts the critical points at the interaction region. Each spade had a saddle point (SP1) at its apex (along the device centerline) and housed two separation foci (F1 & F2) inside it. Along the device gap region a pair of separation (N1) and attachment (N2) nodes were observed close to the compression corner on the cylinder and flare surfaces respectively. A saddle point (SP4) was also observed on the flare surface along the device centerline. A total of 14 Microramps were placed inside the computational domain and each of them could be very clearly associated with two saddle points (SP1 and SP4), two separation foci (F1 and F2), a separation node (N1) and a reattachment node (N2). Including the attachment and separation nodes at the beginning and end of the body along with the observed critical points, the Poincare’s formula [Equation (2)] is not satisfied [2 + 14(2) + 14(2) – 14(2) ≠ 2]. It is inferred from the math that, two other saddle points need to be associated with each microramp device to satisfy Equation (2). It is postulated that these saddle points (SP2 and SP3) would be on either shoulders of the spade (illustrated in Fig. 16) although the present visualizations could not exactly pin point their location.
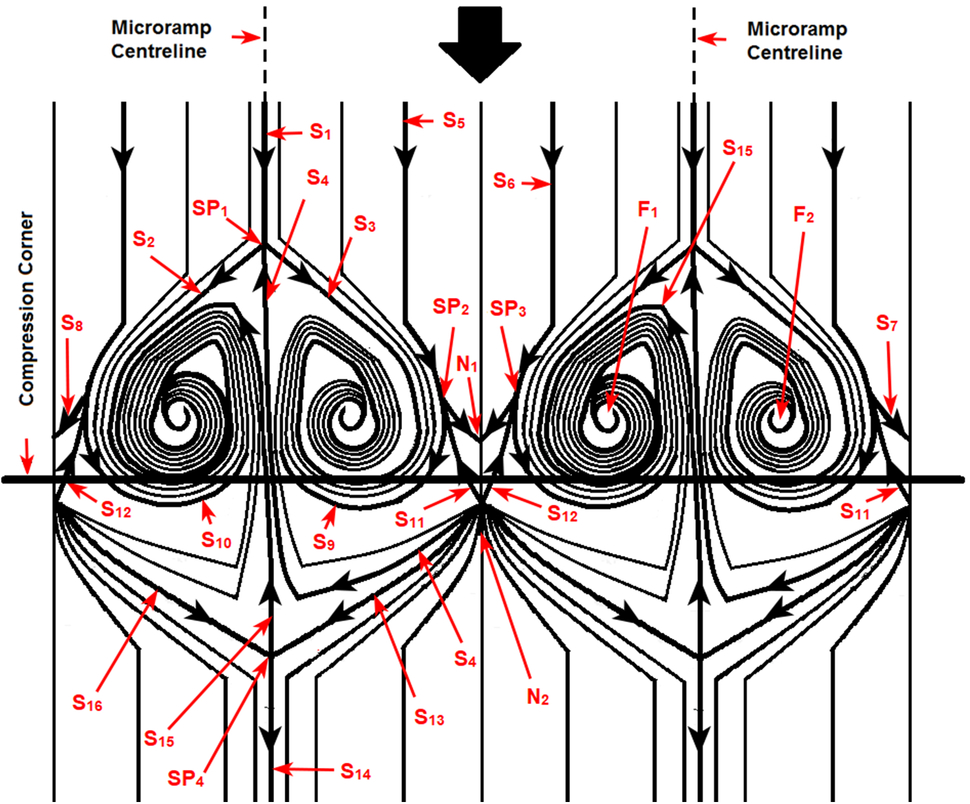
Figure 16. Schematic diagram depicting surface topological features in the separation region under the influence of microramp array.
A line diagram illustrating the various critical points and separatrices in the presence of microramps is presented in Fig. 16. The separatrix S1 arrives along the microramp centerline and reaches the first saddle point, SP1. The two separatrices (S2 and S3) leaving SP1 prevent the adjoining skin friction lines from proceeding downstream. These two separatrices, along with the other skin friction lines, terminate into the two separation foci (F1 and F2). The separatrices (S5 and S6) that pass through SP2 and SP3 would be the last of the ones to terminate at the foci. Beyond, SP2 and SP3, they are termed as S9 and S10 respectively in Fig. 16. S7 and S8 from SP2 and SP3 terminate at the separation node, N1. These two separatrices prevent all skin friction lines in between S5 and S6 from travelling any further downstream and they are all forced to converge at N1. Two separatrices (S11 and S12) that originate at N2 join these saddle points and along with S5 and S6, perform the function of isolating the flow region in between two adjacent spades. On the flare surface, the skin friction lines are seen to diverge from N2 and some of these lines terminate at the separation foci, while some others terminate at N1 on the cylinder surface. The separatrix S4, that separates the two foci also originates from N2 and reaches SP1. The saddle point SP4 on the flare surface roughly aligns with the microramp centerline and is connected to the attachment nodes on either side by S13 and S16. One of the diverging separatrix (S15) from SP4 could be seen moving into the separation region and terminating at one of the foci (F1 in Fig. 16). The other diverging separatrix (S14) performs the function of separating the skin friction lines that originate from adjacent attachment nodes (N2).
The average separation bubble length along the device centerline (between SP1 and SP4) and the device gap region (between N1 to N2) is presented in Table 6. These two locations are chosen because they correspond to the maximum (SBLmax) and minimum (SBLmin) values of separation bubble length (SBL) in the microramp-controlled flowfield. Although, a glance at Fig. 14 may indicate that the separation point along the device centerline has moved upstream, a closer observation will show that the reattachment point also has moved upstream. Measurements presented in Table 6 indicated that, even SBLmax of the controlled interaction, was less than the SBL observed in the uncontrolled interaction. Therefore, it can be shown that, at all locations across the microramp span, a reduction in SBL was observed. The maximum reduction (89%) in SBL occurred between N1 and N2 (along the device gap region) when Xmvg = −5δ (−22.7h) and Xmvg = −10δ (−44.4h). But, the gap between two adjacent spades (across the device gap region) was slightly larger when Xmvg = −5δ (−22.7h).
Table 6 Average separation length along device centreline and device gap regions

3.2.2 Separation bubble height
Streamwise velocity contours at the vicinity of the compression corner along s1 and s3 locations (Fig. 12) are displayed in Fig. 17 along with a contour from the uncontrolled interaction. It is also to be noted that, these locations correspond to the spanwise positions where maximum (SBLmax) and minimum (SBLmin) separation lengths were observed as shown in the previous section. A quick glance at the contours would convey that along s1, the separation bubble is thicker than the uncontrolled interaction while along s3, the bubble height has been drastically brought down. A closer look at the contours from s3 will also make it clear that, the least bubble height was observed when the microramps are placed at Xmvg = −10δ (−44.4h).
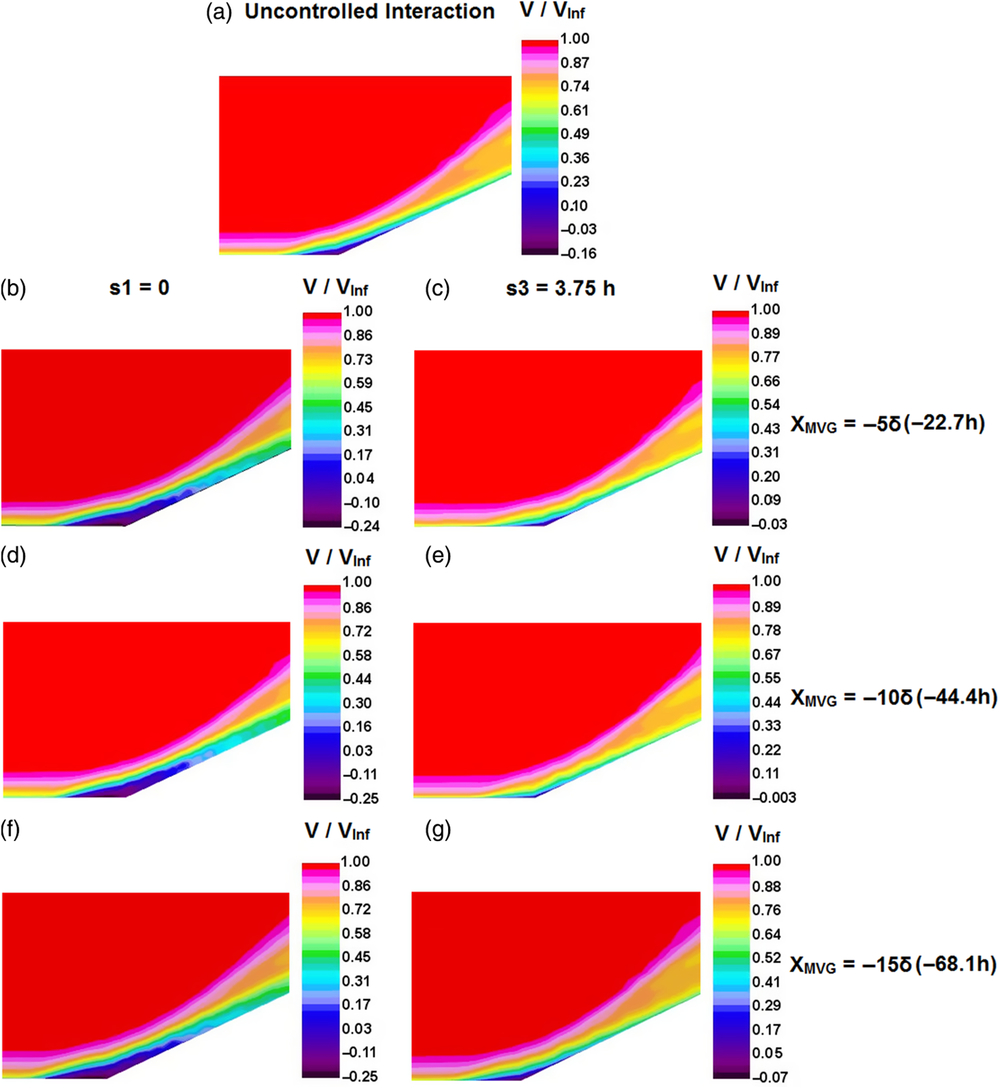
Figure 17. Streamwise velocity contours at the vicinity of compression corner.
A quantitative evaluation of the bubble height at all three spanwise locations, (viz. s1, s2 and s3) was conducted from the boundary layer profiles at the compression corner location (X = 0) and a comparison is presented in Table 7. Both largest and smallest height of the bubble occurred when the microramps were placed at Xmvg = −10δ (−44.4h). The bubble grew 53% taller than the uncontrolled interaction along s1 when the devices where placed at that streamwise position. The bubble height reduced by 85%, 92% and 74% when the microramps were placed at −5δ (−22.7h), −10δ (−44.4h) and −15δ (−68.1h), respectively.
Table 7 Height of the separation bubble at the compression corner (X = 0)

3.3 Boundary layer characteristics
3.3.1 Cross sectional velocity contours
As discussed in the introduction section, the MVGs control shock-induced flow separations by modifying the incoming boundary layer characteristics. In this section, these changes inflicted on the boundary layer by the microramps is analyzed through cross-sectional velocity contours (Fig. 18) at the vicinity of the interaction region. A glance at these contours suggested that the boundary layer experienced a significant velocity redistribution across the span of the microramps. The alternating bands of upwash and downwash regions that can be observed in Fig. 18(e-p) align perfectly along the device centerline and device gap regions, respectively. The downwash causes the higher momentum fluid at upper parts of the boundary layer to entrain into the near wall region, which makes the boundary layer fuller and more resilient towards the adverse pressure gradient offered by the shock. The converse happens in upwash regions along the device centerlines wherein the low momentum fluid in the near wall region is pushed upwards in the direction normal to the surface, making the boundary layer in that region more susceptible to separation.
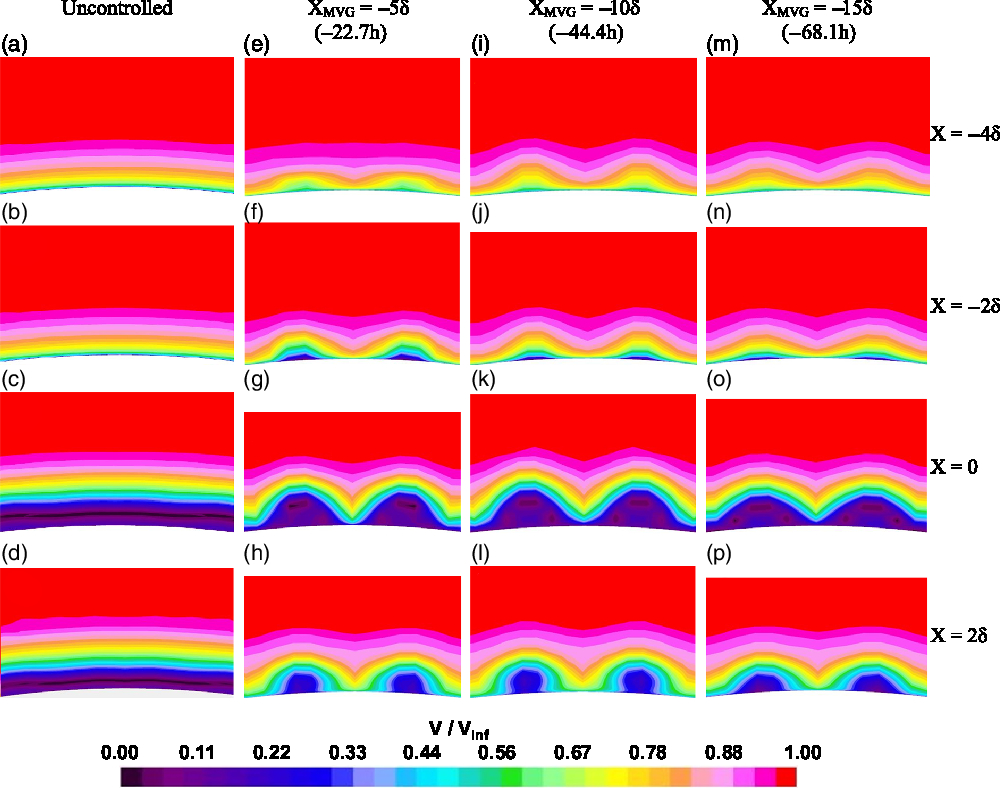
Figure 18. Cross-sectional velocity contours at various streamwise positions.
In all the four streamwise locations in which the contours were analyzed, the greatest entrainment was observed when Xmvg = −10δ (−44.4h) (Fig. 18((i-l)). When Xmvg = −5δ (−22.7h), the entrainment just outside the separation region (Fig. 18(e and f)) was noticeably lower than what was observed when Xmvg = −10δ (−44.4h), but inside the separation region (Fig. 18(g and h)) the entrainment was on par with what was observed when Xmvg = −10δ (−44.4h). When the microramps were moved to Xmvg = −15δ (−68.1h), both the upwash and downwash were consistently lower at the vicinity of the interaction region than what was observed when they were placed in the other two positions (Fig. 18(m through p)). A sole exception was when X = −4δ, where the entrainment under Xmvg = −15δ (−68.1h) was more than what was observed when Xmvg = −5δ (−22.7h) (Fig. 18(e and m)). This may be because, this location is very close to the microramp (at a distance of δ) when Xmvg = −5δ (−22.7h) and the changes had just started to appear.
3.3.2 Incompressible shape factor
Health of the incoming boundary layer and fullness of the boundary layer velocity profile is generally quantified based on the incompressible shape factor (Hi). It is defined [Equation (3)] as the ratio of the incompressible displacement thickness (
 $\delta^{\ast}_{i}$
) [Equation (4)] to the incompressible momentum thickness (
$\delta^{\ast}_{i}$
) [Equation (4)] to the incompressible momentum thickness (
 $\delta^{\ast\ast}_{i}$
) [Equation (5)]. A higher shape factor indicates that the boundary layer is more likely to separate in the event of experiencing an adverse pressure gradient.
$\delta^{\ast\ast}_{i}$
) [Equation (5)]. A higher shape factor indicates that the boundary layer is more likely to separate in the event of experiencing an adverse pressure gradient.
 \begin{equation}{H_i} = \frac{\delta^{*}_{i}}{\delta^{**}_{i}}\label{eqn3}\end{equation}
 \begin{equation}{\mathop \delta \nolimits^* _i} = \int\limits_{\mathop R\nolimits_X }^{\mathop r\nolimits_{\max } } {\left[ {1 - {V \over {\mathop V\nolimits_{Inf} }}} \right]} dr\label{eqn4}\end{equation}
 \begin{equation} \delta^{**}_{i} = \int\limits_{R_X }^{r_{\max}} \frac{V}{V_{Inf}} \left[ {1 - \frac{V}{V_{Inf}}}\right]dr\label{eqn5}\end{equation}
where, RX is the radius of the cylinder/flare body at a given axial position and rmax is the radial distance from the axis of the body to the end of the computational domain. It is to be noted that, because the domain had a square cross-section, the rmax value varied slightly across different locations of microramp span. These variations do not reflect on the results as rmax is extremely far away from the interaction region.
The incompressible shape factor (Hi) of the undisturbed incoming boundary layer at xc (location of the compression corner) was found to be 1.27 which denotes that the boundary layer is turbulent. The value of Hi was obtained for the uncontrolled and controlled interactions at five different streamwise positions at the vicinity of the interaction region viz. X = −4δ, −2δ, 0, 2δ and 4δ. The changes in the flow characteristics across the micoramp span was also documented by acquiring these values along s1, s2 and s3, and the comparative plots are provided in Fig. 19.
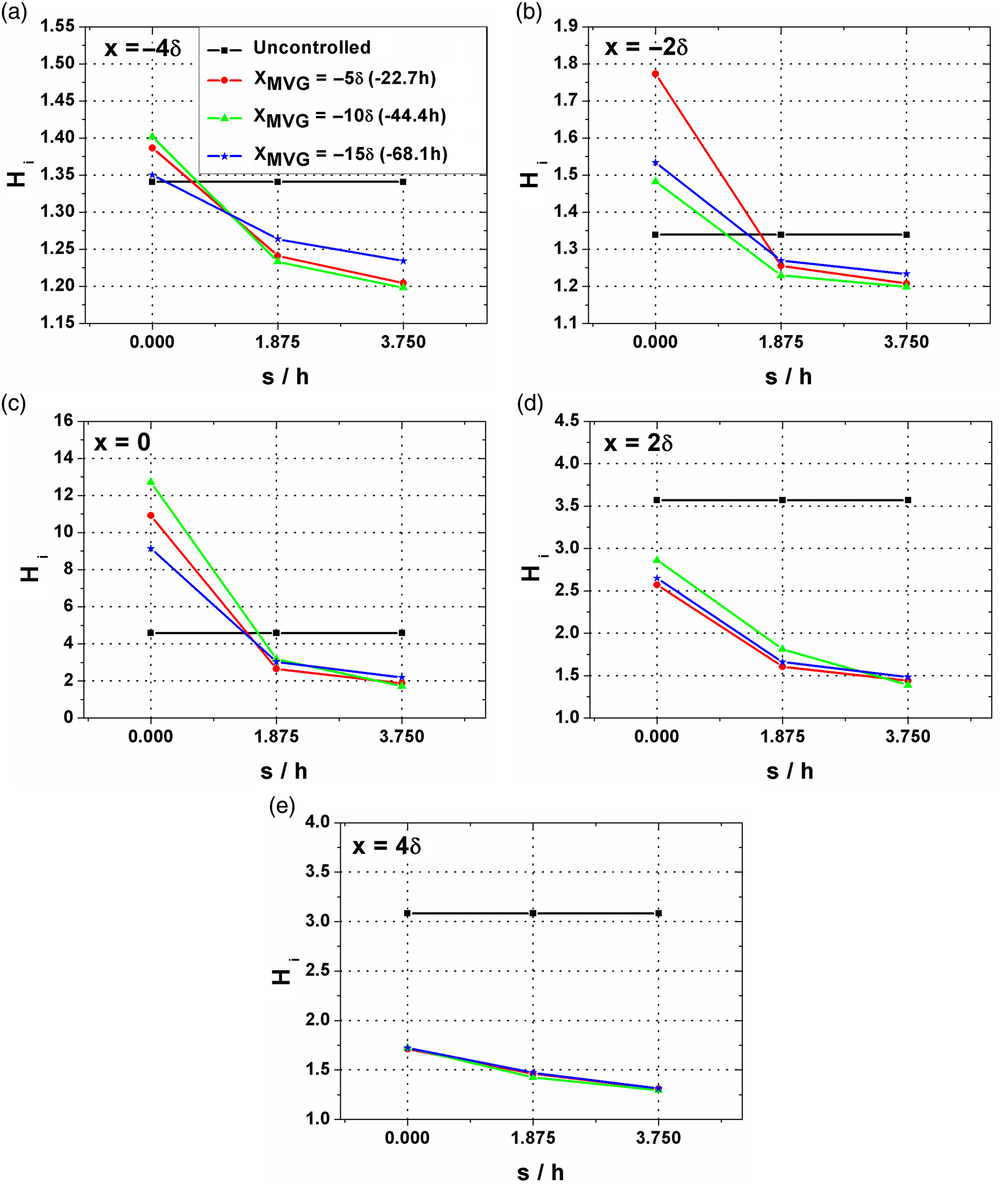
Figure 19. Variation in incompressible shape factor across the microramp span. a) X = −4δ; b) X = −2δ; c) X = 0; d) X = 2δ; e) X = 4δ.
It can be clearly observed from these plots that in the controlled cases, the boundary layer health improves as the spanwise distance from the microramp centerline increases. The value of Hi for the controlled interactions has consistently been less than that of the uncontrolled interaction along s2 and s3 locations indicating that the boundary layer has become more robust in these regions due to the downwash induced by the microramps. Along the microramp centerline, the value of Hi was greater for the controlled interactions until the compression corner (Figs. 19(a), 19(b) and 19(c)) indicating that the boundary layer in this region is more likely to separate. But at the same time, on the flare surface it can be seen that, even along s1, the value of Hi in the presence of microramps has dropped significantly from that of the uncontrolled interaction (Figs. 19(d) and 19(e)). This suggests that the presence of microramps resulted in an overall stronger and sturdier boundary layer in the post interaction region.
With respect to the effect of streamwise positioning of the microramps, it can be seen that, along s3, in all the five axial positions the lowest value of the incompressible shape factor was recorded when Xmvg = −10δ (−44.4h). This is quite comprehensible as it directly aligns with the observations made during flow separation characterizations presented in the previous section that showed a maximum reduction in separation bubble size (both in terms of length and height) when the microramp array was placed in this streamwise position. Also, the position Xmvg = −15δ (−68.1h) was found to be the least effective position among the three positions that were investigated.
3.4 Counter-rotating vortex pairs
The alterations induced in the flowfield by these microramp devices can be attributed to a pair of counter-rotating vortical structures that emanate from them. A typical illustration of this structure can be seen in the cross-sectional streamline visualization provided in Fig. 20. The streamlines are color coded based on local velocity magnitude that clearly shows the direction in which the fluid is entrained. The low momentum fluid could be seen being lifted up along the microramp centerline, while the high momentum fluid is simultaneously brought down closer to the surface along the device gap region. The presence of these vortical structures may also explain the accumulation of the skin friction lines along the device centerline as observed in Figs. 14 and 15.
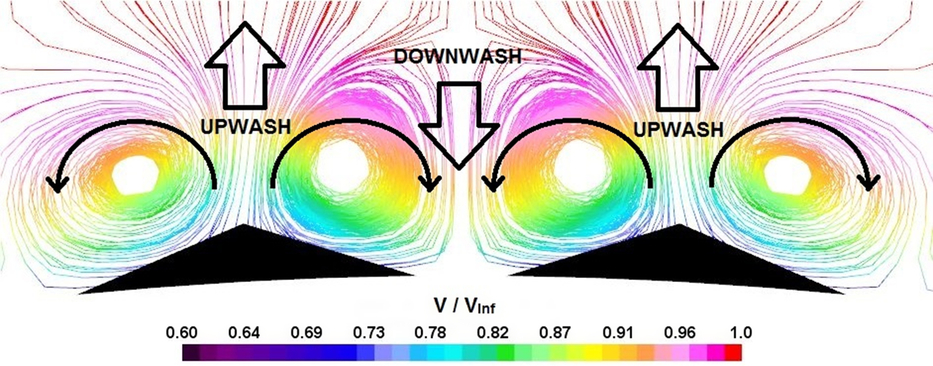
Figure 20. Cross-sectional streamline visualization showing the counter-rotating vortex pairs. (Xmvg = −10δ (44.4h); X = −4δ).
The mechanism through which these vortical structures are generated is illustrated in Fig. 21. Since the sonic line is extremely close to the surface in a turbulent flow, most of the microramp geometry protrudes above the sonic line into the supersonic part of the boundary layer. As a result, small shock waves are formed in front of the microramps, increasing the static pressure of the flow directly over the microramp. Meanwhile, the freestream flow entering through the gap between these devices possess a comparatively lower static pressure. This pressure difference across the microramp span triggers the flow to roll over the device edges from high pressure zone to low pressure zone as depicted in Fig. 21. This rolling motion of the fluid leads to the formation of a counter rotating vortex pair from each device that get advected downstream towards the interaction region. As explained earlier the entrainment caused by these vortices are responsible for the alternative downwash and upwash regions that vary the ability of the boundary layer flow to push through an adverse pressure gradient. Therefore, the separation region that is relatively uniform in the spanwise direction undergoes topological changes in the presence of these devices as described in the previous sections.

Figure 21. Schematic diagram depicting the flowfield modification induced by the microramp array.
4.0 CONCLUSIONS
A computational study has been conducted to investigate the effect of a microramp array placed upstream of an axisymmetric compression corner. The array was placed at three different locations viz. −5δ, −10δ and −15δ (−22.7h, 44.4h and 68.1h, respectively) upstream of the interaction region and the changes that ensued in the flowfield were recorded and compared. Irrespective of their streamwise position, these devices made recognizable changes in the interaction flowfield. Following are the important observations from the study.
1. The microramps produced a pair of counter-rotating vortical structures that formed upwash and downwash regions along the device centerline and the device gap region, respectively. This created spanwise alterations in the incoming boundary layer’s ability to resist the adverse pressure gradient offered by the shock. The boundary layer became fuller and more robust along the downwash region enabling it to resist flow separation to a greater extent in this area.
2. In the presence of microramps, surface pressure contours exhibited a roughly sinusoidal pattern with a wavelength of 7.5h which matches with the inter-device spacing between two adjacent microramps. Streamwise cross sectional pressure contours showed that local upstream influence increased beyond the uncontrolled value along the device centreline (upwash), but dropped as the spanwise distance from the device centerline increased. The least upstream influence was found along the device gap (downwash) region, and it was significantly less than what was measured in the uncontrolled interaction. A reduction in the separation shock strength (both in terms of shock angle and static pressure rise) was observed. The spanwise average of upstream influence length decreased in the presence of microramps and the maximum reduction of 7.9% was achieved when Xmvg = −10δ (−44.4h).
3. Surface flow patterns showed significant modifications in the separation region due to the presence of the microramps. A corrugated separation line forming spade shaped patterns was observed, with the apex of each spade aligning directly with a microramp centerline. The spade’s apex was a saddle point, and a pair of separation foci were found inside the spade structure. Additionally, a separation node was also found along the device gap region. The presence of two more saddle points on either shoulders of the spade have been postulated, but the present visualizations could not exactly predict their location. The reattachment line was also corrugated, but had only attachment node- saddle point combinations.
4. The separation length reduced at all locations across the microramp span. The minimum separation length in the controlled interaction flowfield was found along the device gap region and was measured as the distance between the separation and attachment nodes. The maximum reduction in the separation bubble length with respect to the uncontrolled interaction was observed when the microramps were placed at both Xmvg = −5δ (−22.7h) and Xmvg = −10δ (−44.4h).
5. Along the device centerline, the separation bubble grew taller than the height observed in the uncontrolled interaction. As spanwise distance from the device centerline increased, the height of the bubble reduced and the minimum height was observed along the device gap region (at maximum spanwise distance from the device centerline). A quantitative analysis of the minimum height through boundary layer velocity profiles at the compression corner revealed a maximum reduction of 85%, 92% and 74% from the uncontrolled interaction when the microramps were placed at −5δ (22.7h), −10δ (44.4h) and −15δ (68.1h), respectively.
6. Among the three streamwise locations investigated in this study, the microramps were most effective when placed at Xmvg = −10δ (−44.4h).
ACKNOWLEDGEMENT
The authors would like to thank Mr. Bhushan Lokhande, Mr. Mandar Mate, Mr. Vaibhav Gonjari and Mr. Gabriel Joseph of the Department of Aerospace Engineering, Defence Institute of Advanced Technology for their unwavering and constant support. The first author would also like to acknowledge the financial assistance (Institute fellowship) he received from the institute.


