NOMENCLATURE
- f
-
frequency, Hz
- L
-
duct length from nozzle exit to flap throat, mm
- q∞
-
dynamic pressure, kPa
- δ
-
flap angle, deg
- H
-
height of the duct, mm
- X
-
horizontal distance from the nozzle exit, mm
- Mave
-
average Mach number
- θ
-
nozzle divergent angle, deg
- dP/dX
-
pressure gradient [(PW/P 0 ∞)/(X/L)]
- P'rms
-
root mean square of unsteady pressure (Pa)
- P 02
-
stagnation pressure at flap throat, kPa
- P 0 ∞
-
tunnel stagnation pressure, kPa
- PW
-
wall static pressure, kPa
- W
-
width of the duct, mm
- Re
-
reynold's number
- AR
-
Aspect Ratio
- DMRJ
-
Dual Mode Ramjet Engine
- SWBLI
-
Shock Wave Boundary-Layer Interaction
Abbreviation
1.0 INTRODUCTION
Dual Mode Ramjet Engines (DMRJ) encounters many practical and functional difficulties such as optimised air-intake, fuel-air mixing, flame-holding and stable combustion. A duct/isolator is one of the critical components in DMRJ that directly contributes to the performance as well as the operability range of the engine in terms of Mach number and dynamic pressure. Generally, the duct/isolator is located between intake and combustor (Fig. 1) and its primary function is to protect the air intake from the disturbances produced by combustion instability and sudden back pressure rise due to combustion.
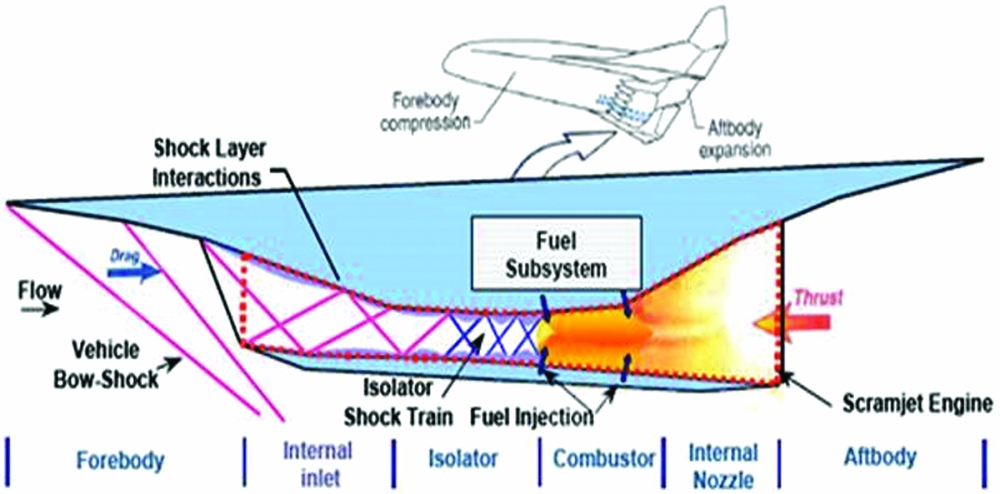
Figure 1. Schematic of a typical Scramjet engine(Reference Chung and Lu19).
The flow features in a typical duct/isolator involve series of shocks known as shock train and its function is to continuously increase the pressure in the duct/isolator by heat release in the combustor. This is in contrast to the inviscid flow, where, a single normal shock (1-D flow) appears due to back pressure rise. But in reality, pressure rise across the shock train is lower than that of a single normal shock (inviscid condition) due to the presence of boundary layer. The formation of a pseudo-shock system or a normal shock train occurs because of the rise in back pressure. The associated strong adverse pressure gradient fully separates the flow and delays the engine to become fully un-start as compared to a single normal shock. Once the back pressure reaches its critical value, the un-start phenomenon occurs at the inlet. An empirical correlation is derived(Reference Waltrup and Billig1) to estimate the length of the pseudo-shock system in a duct/isolator as a function of pressure rise and momentum thickness. The strength of the pseudo-shock system depends on its equivalence ratio(Reference Donbar2) while its size depends upon the wall temperature and stagnation temperature(Reference Fischer and Olivier3). However, the length of the shock train remains constant if the ratio between stagnation temperature to duct/isolator wall temperature is maintained. Generally, the normal (λ-type) and oblique (x-type) shock train terminates with subsonic and supersonic flow, respectively. In fact, it is observed that the pressure rise across the normal shock train(Reference Matsuo, Miyazato and Kim4) due to boundary layer is more or less equal to a single normal shock (inviscid). Thus, the boundary layer plays a predominant role in shock train studies. The effect of approaching boundary layer thickness(Reference Carroll and Dutton5) for various Mach numbers show multiple normal shocks (pseudo-shocks) below M = 1.86 and multiple oblique shocks (oblique shock train) between M = 1.86 and M = 2.6. Some of the results(Reference Om and Childs6) show that a rapid increase in the slope of wall static pressure leads to low pressure recovery, and, increases the momentum and displacement thickness in the region close to shock wave boundary layer interaction. Other important features of duct/isolator are the start and un-start characteristics. Detailed studies on start/un-start characteristics of a duct/isolator(Reference Chang, Yu, Bao, Fan and Shen7) at different Mach numbers exhibit gradual decrease in freestream Mach number which is responsible for the flow to un-start, and, the gap between start to un-start and vice-versa is minimised by boundary layer bleeding. The un-start of a duct/isolator(Reference Wagner, Yuceil, Valdivia, Clemens and Dolling8,Reference Wagner, Yuceil and Clemens9) is mainly due to rise in back pressure where the shock system moves upstream followed by a flow separation and oscillation. The nature of the flow oscillation in the duct/isolator(Reference Carroll and Dutton10) shows negligible turbulent kinetic energy in the core. The studies on the mean and fluctuating velocity field and skin friction coefficient(Reference Sajben, Morris, Bogar and Kroutil11) in the presence of a single terminal shock reveals the displacement thickness is 15–20 times its initial value and the flow is fully attached. The perturbation frequencies(Reference Bruce and Babinsky12) show a λ-type shock, which becomes strong during upstream propagation. The frequency of the pseudo-shock system under various back pressures(Reference Su and Zhang13), exhibit steady flow, if the ratio between back pressure and freestream static pressure is less than 50. However, the flow field becomes unsteady beyond 70, causing the flow to un-start. On the other hand, the frequency of the pseudo-shock system is very high once the hot flow is used. The duct/isolator experiences series of shocks, its interaction with the boundary layer and corresponding unsteadiness in the flow depending upon the back pressure. Hence, the duct/isolator under certain circumferences becomes un-start and its performance will be degraded. To alleviate this, investigations are carried out to reduce the boundary layer separation by vortex generation(Reference Tichener and Babinsky14) and pressure losses by boundary layer suction(Reference Weiss and Olivier15). Studies on a divergent duct/isolator(Reference Wei, Wang, Guo, Puorkashanian, Ma, Insham, Luo, Lei and Liu16) to account for boundary layer growth show sharp decrease in static pressure along the centreline owing to strong expansion fans that originate from the nozzle. Also it is noticed that the performance of the duct/isolator(Reference Birgit, Reinartz, Carsten, Herrmann and Koschel17) can be enhanced by suitable design of the external compression configuration. Further, it is reported(Reference Varadarajan and Roe18) that long duct/isolators are capable of handling additional back pressures with improved performance. Hence, it is vital to understand the behaviour of the shock train and the associated effects to improve the performance of the engine.
The scope of the present study is to experimentally investigate the characteristics and performance of a typical duct/isolator. The behaviour of the Ramjet duct/isolator is brought out through steady/unsteady pressure measurements and instantaneous Schlieren flow visualisation. The performance of the duct/isolator is characterised by varying flap angles (δ) to generate back pressure effect and freestream dynamic pressure (q∞) to enhance the boundary-layer edge momentum. Further, parameters such as pressure recovery and pressure gradient are derived to correlate duct/isolator performance.
2.0 EXPERIMENTAL SET-UP
Figure 2 shows the details of the low-aspect-ratio duct/isolator (height-to-width ratio, 1:0.75) of slenderness ratio 9.1 (L/H) used in the present studies. The duct height and width are 53 mm and 40 mm, respectively. In order to simulate the back pressure, a movable flap is attached at the bottom end of the duct/isolator. A motorised mechanism (Fig. 3) is used to adjust the flap angles (δ) to generate different pressures. The flap angle is measured by a potentiometer through resistance change and a provision is given for back pressure measurement at the flap throat. The potentiometer is calibrated using a digital inclinometer of 0.1° resolution.
Figure 2. Schematic of the duct/isolator.
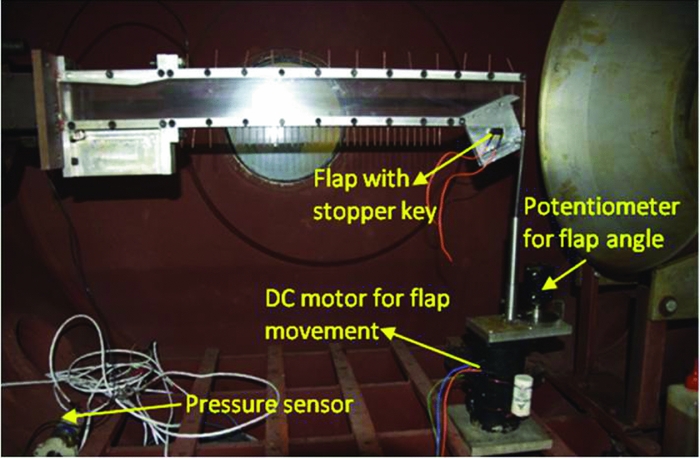
Figure 3. Experimental set-up.
In order to generate the realistic supersonic flow (Mave = 1.7), a two-dimensional nozzle is fabricated and attached to the duct/isolator. The top wall of the nozzle has a convergent-divergent shape with a divergent angle of 4.3° and the bottom wall is flat. Once the flow is established, it is expected that a lip shock will be generated from the exit of the nozzle on top wall as a consequence of compression corner produced by nozzle-duct/isolator interface. On the other hand, full expansion occurs at the bottom wall. Hence, it is anticipated that the flow at the exit of the nozzle is an asymmetric supersonic flow. The other end of the duct/isolator is attached to a vacuum chamber to maintain the plenum pressure well below the back pressure to ascertain the flap throat is chocked irrespective of downstream pressure. In the present case, the back pressure is measured at 9.1 H (flap throat) downstream of the nozzle exit.
3.0 FACILITY DETAILS
Experiments are carried out in a pressure-vacuum driven blowdown facility (Fig. 4). One end of the duct/isolator is connected to the tunnel settling chamber to draw the compressed air from the storage vessel (40 bar) and the other end is connected to a vacuum chamber of volume 272 m3 with a vacuum level of 10−2 mbar via a scoop. The compressed air is allowed through a fast response solenoid valve, which is an ON-OFF type electro-pneumatic disc valve. A Pressure Regulating Valve (PRV) is used to regulate the required pressure in the settling chamber. This is an electro-pneumatic valve and pressure regulation is controlled by current drawn from a power supply. Vacuum isolation valve is used to isolate tunnel plenum chamber from vacuum vessel for model setting. The duct/isolator set-up is mounted inside the plenum chamber and either sides of the plenum chamber are provided with window glasses for optical access.
Figure 4. Pressure-vacuum driven blowdown facility.

5.0 MEASUREMENT DETAILS AND UNCERTAINTIES
The Data Acquisition System (DAS) has a facility to excite the sensors, sampling analog signals, signal processing unit, Analog to Digital Convertor (ADC) and data storage in PC (Fig. 5). A 12-channel DAS (National Instrument, USA) with a 16-bit resolution ADC card is used in the present case. Duct/isolator wall static pressure (steady) is measured using a 32-port Electronic Pressure Scanner (EPS) of the 30-PSID range. Wall static pressures are measured at 12 locations on the top wall (X/L = 0.03, 0.13, 0.21, 0.29, 0.37, 0.45, 0.53, 0.61, 0.69, 0.77, 0.85 and 0.93) and 21 locations (X/L = 0.03, 0.11, 0.2, 0.26, 0.3, 0.38, 0.46, 0.56, 0.58, 0.6, 0.62, 0.64, 0.66, 0.68, 0.7, 0.72, 0.74, 0.76, 0.78, 0.93 and 1.0) on the bottom wall. Since the pressure scanner is a differential type, plenum chamber pressure is used as a reference pressure. During test, plenum chamber pressure is measured separately and added to the differential pressure to get the absolute pressure. The plenum chamber pressure is measured by a 100-kPa capacitance-type vacuum gauge. The sensor is calibrated for its full range and check loading is done using tunnel measurement chain. Tunnel stagnation pressure is measured using a 50-PSI pressure transducer. The transducer is calibrated for its full range and the nonlinearity is found to be less than 0.2%. Signal conditioner and Analog to Digital Converter (ADC) are calibrated independently and the errors are ±0.02% and ±0.03%, respectively. The overall chain accuracy is better than 0.5%. Based on the six repeatable tests, dispersion band (3σ) is established as ±0.03 for Pw/P0∞. The unsteady pressures are measured by 15 PSID (Kulite-make) fast-response Piezo-resistive pressure transducers. The sampling frequency and cut-off frequency are 4 kHz and 1 kHz, respectively. Unsteady pressures are measured at X/L = 0.03 (top and bottom wall) and X/L = 0.53 (top wall).

Figure 5. Instrumentation chain.
6.0 RESULTS AND DISCUSSIONS
6.1 Mach number distribution
Typically, asymmetry flow prevails in the duct/isolator entry during flight, leading to the generation of lip shock and expansion fan. Hence, the vehicle performance is limited by multiple shock reflections and shock wave boundary layer interaction. By keeping the flight scenario in mind, experiments are carried out to characterise the duct/isolator under such entry conditions. Figure 6 shows the Mach number distribution at the nozzle exit, which is asymmetric in nature.

Figure 6. Mach number variation at the duct/isolator entry.
The bottom wall (Y/H = 0.24) experiences maximum expansion from the characteristic waves originating from the nozzle throat and hence, the Mach number is maximum at this location. On the other hand, as Y/H is increased, its effect is less pronounced and hence, gradual reduction in the slope of the Mach number is observed up to Y/H = 0.6. Beyond this, a sudden decrease in the slope is observed up to Y/H = 0.68. This is because of the coalesces of Mach waves to form a re-compression shock. At Y/H = 0.84, increase in Mach number occurs due to relieving effect. In the present case, the Mach number at the nozzle exit is asymmetric and varies from 1.61 to 1.72 with a dispersion of ±0.02.
6.2 Schlieren flow visualisation
Instantaneous Schlieren images are captured at 500 fps with a shutter speed of 0.2 ms to study the effect of back pressures and dynamic pressures on shock train inside the duct/isolator. Since the duct is large, two images are captured to cover the entire duct. For 85 kPa dynamic pressure and δ = 0° (Fig. 7), a lip shock (point 1) is seen on the top wall. This is generated because of the compression corner at nozzle-duct interface. The shape of the lip shock (point 2) is observed to be curved(Reference Lee and Lee22) indicating that a series of compression waves from the interface coalesces to form the lip shock. This shock after multiple reflections (~7 times, points 3 and 4) from top and the bottom walls disappears downstream of the duct shows the pressure inside the duct equals the freestream pressure. It is observed that the nature of the reflected shocks near the duct/isolator inlet is stationary and becomes unsteady further downstream. This is evident from the sharp images near the inlet and the smeared images much downstream of the duct. In the present experiments, the boundary layer is turbulent and hence, the reflected shocks in the duct appeared to be adhered to the wall. However, to make the flow parallel to the wall, Mach reflection (point 5) from each of the reflected shock (dotted circle on the bottom wall shown in Fig. 7) takes place which is a normal shock. It is presumed that the height of this normal shock is an indicator of the boundary layer thickness (point 6) which is plotted in Fig. 8. From Fig. 7, it is obvious that the boundary layer growth both on the bottom and the top wall is not uniform. The growth of the boundary layer is large on the bottom wall as compared to the top wall. Though these values are approximate, the trend shows that the boundary layer thickness is due to the progressive adverse pressure gradient during shock reflections. The included angle between incident and reflected shocks on bottom wall is 88°, 76° and 65° at X/L = 0.1, 0.3 and 0.47, respectively. This shows the flow gets decelerated and gradually becomes parallel to the wall. The shock locations in the Schlieren images are in line with the pressure measurements which will be discussed in the subsequent section.

Figure 7. Schlieren image at δ = 0 (no flap deflection).

Figure 8. Boundary layer thickness at δ = 0°.
Once the back pressure is increased (δ = 8°), the flow is chocked at the end of the duct/isolator which in turn affects the flowfield inside the duct. This is presented in Fig. 9(a) where a series of normal shocks (normal shock train) are formed at the end of the duct. The starting point of this normal shock train is at X/L = 0.75. Ahead of this normal shock, the flow features are quite similar to δ = 0° as explained in Fig. 7. It can be observed that the distance between the successive normal shocks decreases. The structure of the first normal shock appears to be a bifurcated shock system where the middle portion of the shock (point 7) is normal and becomes λ shape (point 9 and 8) near the wall. Due to the un-symmetric nature of the boundary layer, the normal shock train appears to be inclined towards the top wall and hence, the λ shock (point 9) on the top wall becomes smaller in size as compared to bottom side (point 8). Further increase in back pressure (δ = 11°) reduces the length of the supersonic region in the duct/isolator (Fig. 9(b)) where the flow is separated (point 11) from the starting point of the normal shock train (point 10). Although the normal shock train is truncated in the present case compared to δ = 8°, it contains a cluster of normal shocks with alternate expansion and compression regions marked as “a” and “b” and the distance between the successive normal shocks is found to be decreased. The core flow in this case accelerates to supersonic speed due to the fact that the boundary layer between the shocks acts as a convergent divergent passage. Like the earlier case (Fig. 9(a)), the first normal shock is a bifurcated shock system contains λ shock both on top and bottom wall. Also it should be noted that the presence of normal shock train makes the reflected shocks unsteady (evident from the smeared images of the reflected shocks) which is indicative of the upstream propagation of the disturbance through the boundary layer that energises the large-scale structures and initiates the un-start process. By increasing the back pressure further (δ = 12°), the normal shock train moves upstream (Fig. 9(c)) and the reflected shock system disappears. The number of normal shocks in the shock train also decreases in this case. Similar observation is valid for δ = 12.5° as shown in Fig. 9(d). In both cases, the first normal shock is a bifurcated shock system (point 7, 8 and 9) located near the duct/isolator inlet.

Figure 9. Schlieren images for various back pressures and 85 kPa.
It can be concluded that the rate at which the un-start process takes place depends on the back pressure. The lower the back pressure, the slower the un-start process, which is true for certain back pressures (δ < 11°); beyond this, the un-start process is very fast due to strong upstream influence of disturbance through boundary layer.
The effect of the increase in dynamic pressure (105 kPa) on the duct/isolator flowfield for a typical case (δ = 12°) is shown in Fig. 10. Unlike the earlier case (Fig. 9(c)), the increase in dynamic pressure (105 kPa) generates supersonic flow in most part of the duct/isolator except the rear end. However, the normal shock train is quite similar to the cases which are already discussed. The starting point of the normal shock train in the present case is at X/L = 0.35 against X/L = 0.1 in the earlier case. From this, it is clear that an increase in dynamic pressure delays the un-start process.

Figure 10. Schlieren image, δ = 12°, 105 kPa.
6.3 Steady pressure measurements
6.3.1 q∞ = 85 kPa
Distribution of non-dimensional wall static pressure (Pw/P0∞) along the length of the duct/isolator (top wall) is presented in Fig. 11 for 85 kPa dynamic pressure. Based on gas dynamic relations (inviscid flow), the pressure jump across the lip shock is 0.29 which is observed in the present case for δ = 0° at X/L = 0.13. Unlike the inviscid solution, the pressure rise is gradual due to shock wave boundary layer interaction. The behaviour is valid up to δ = 8° between the stations X/L = 0.03 to X/L = 0.13. At X/L = 0.21, a rise of 0.35 in Pw/P0∞ could be seen due to the impingement of the reflected shock from the bottom wall. Subsequently, at X/L = 0.28, the flow recovers owing to expansion which is marked by a decrease in the pressure ratio (Pw/P0∞). The alternate compression and expansion process can be observed up to 0.29 < X/L < 0.62. Beyond X/L = 0.62, continuous expansion takes place to match the back pressure. Similar observation is valid for δ = 4°, 8° and 11° except for the fact that the location of the normal depends on back pressures. Increasing the back pressure causes the normal shock train to move upstream and become strong which is in line with the Schlieren images (Fig. 9(a)–(b)). Behind normal shock, the flow is found to be subsonic which is evident from Fig. 11 where the formation of normal shock is seen at X/L = 0.85 and 0.78 for δ = 4° and 8°, respectively, whereas a shock train is observed beyond X/L = 0.5 for δ = 11° which is marked by a continuous rise in the pressure ratio. On the other hand, once δ > 12°, the flow becomes unstart beyond X/L = 0.1 due to the fact that the back pressure reaches its maximum value and hence, the maximum blockage. In such conditions, the shock train system vanishes and a strong normal shock appears between X/L = 0.03 and 0.11.
Figure 11. Wall (top) static pressure distribution (q∞ = 85 kPa).
Unlike the shock reflection, normal shock train cannot be characterised fully by wall static pressure. This is mainly due to the fact that the oblique shock system corresponds to the attached flow and the pressure jumps for each shock are reflected in wall static pressure measurement. On the other hand, normal shock train is generated in the separated flow where the wall static pressure continuously increases till the flow become subsonic and hence, no information about the number of normal shocks. Nevertheless, this is captured in the Schlieren images (Fig. 9(a)–(d)).
On bottom wall (Fig. 12), for δ = 0°, the pressure rise at X/L = 0.11 is found to be 0.32 due to lip shock impingement and its reflection. Since the shock reflection is governed by pressure rise and drop (compression and expansion), maximum pressure jump at X/L = 0.61 is 0.37, which is 27.5% higher than the initial pressure jump of 0.29. After X/L = 0.61, a continuous decreasing trend in pressure can be seen due to flow acceleration which is similar to the top wall measurements. For other flap deflections (δ = 4°, 8° and 11°), the trend is quite similar to top wall pressure measurements (Fig. 11). At high values of flap deflection (δ = 12 and 12.5°), the flow becomes unstart between X/L = 0 and 0.1 due to the formation of normal shock.

Figure 12. Wall (bottom) static pressure distribution (q∞ = 85 kPa).
6.3.2 q∞ = 105 kPa
The objective of increasing the dynamic pressure from 85 kPa to 105 kPa (by 23.5%) is to study the effect of freestream boundary-layer edge momentum (effect of Reynolds number) on duct/isolator behaviour. The plot of wall static pressure under different flap angles is shown in Figs 13 and 14 for the top and bottom wall, respectively. The nozzle lip shock impinges on the bottom wall at X/L = 0.13 (Fig. 14) and strikes at X/L = 0.2 on the top wall (Fig. 13) after reflection. This shock again gets reflected and is incident on the bottom wall at X/L = 0.3. The change in pressure due to successive shock impingement both on top and bottom walls at X/L = 0.35, 0.45, 0.5 and 0.6 are quite similar to the earlier case (Figs 11 and 12). However, in this case, decrease in the slope is seen up to X/L = 0.13 due to increased boundary layer momentum. The present case can hold the supersonic flow up to δ = 12° resulting in 9% increase in the blockage as compared to the 85 kPa case. Since the boundary-layer edge momentum is enhanced by 23.5%, it can overcome large adverse pressure gradient induced by shock train. In this process, the boundary layer separation is delayed due to exchange of excess momentum to overcome adverse pressure gradient. It is understood that the maximum back pressure ratio to sustain supersonic flow in both cases (q∞ = 85 kPa and 105 kPa) is similar. Since the strength of the shocks is same, the pressure ratio is also found to be similar in both cases.

Figure 13. Wall (top) static pressure distribution (q∞ = 105 kPa).

Figure 14. Wall (bottom) static pressure distribution (q∞ = 105 kPa).
It observed that for δ < 8°, the pressure ratio at X/L = 0.03 (near the duct/isolator inlet) varies monotonically (Figs 11–14) whereas it remains unaltered in the reflected shock regions (0.03 < X/L < 0.8). In order to understand this, pressure measurements are carried out for δ = 0° at three locations (X/L = 0.03 and 0.53) for different dynamic pressures varying from 80 to 105 kPa and plotted in Fig. 15. It is observed that at X/L = 0.03, the distribution of pressure is linear with increase in freestream dynamic pressure both at the top and bottom wall. However, at X/L = 0.53, the pressure ratio is constant due to the fact that the strength of the shock as well as its sensitivity to the boundary layer remains unchanged irrespective of the dynamic pressures. The reason for the marginal variation at X/L = 0.03 is attributed to the sensitive nature of the boundary layer near the duct inlet to the tunnel dynamic/stagnation pressure during blowdown. The point to be emphasised is the pressure variation at X/L = 0.03 is not a phenomenon but occurs due to the perturbation in pressure regulating valve. Nevertheless, the variation in pressure ratio at X/L = 0.03 is well within the uncertainty range. However, there is certainly a change in the pressure ratio beyond δ = 8° which is addressed (Fig. 16) in the subsequent section through unsteady pressure measurements. From Figs 11–14, the pressure jump across the shock increases with the increase in flap angle. This is a clear indication of increasing shock strength due to flap deflection.

Figure 15. Variation of Pw/P0∞ with dynamic pressure.
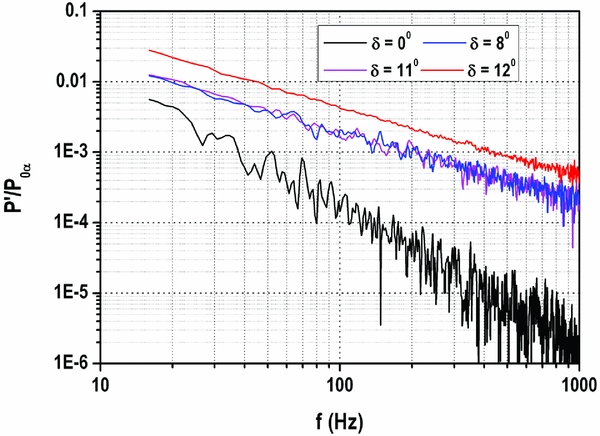
Figure 16. Pressure spectrum at X/L = 0.03 (Top wall), q∞ = 85 kPa.
6.4 Unsteady pressure measurements
Figures 16–18 show the unsteady pressure spectrum at three locations namely X/L = 0.03 (top and bottom wall) and X/L = 0.53 (top wall) for different flap angles (δ = 0°, 8°, 11° and 12°) for 85 kPa dynamic pressure.
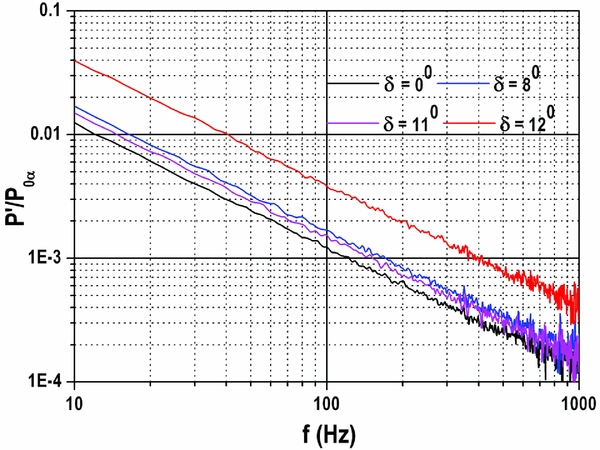
Figure 17. Pressure spectrum at X/L = 0.03 (Bottom wall), q∞ = 85 kPa.
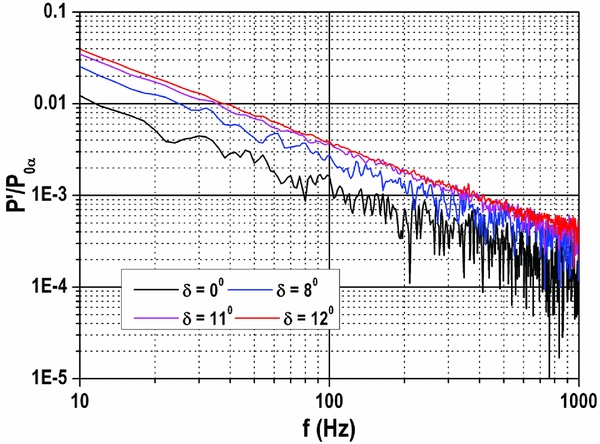
Figure 18. Pressure spectrum at X/L = 0.53 (Top wall), q∞ = 85 kPa.
Figure 16 shows the existence of eddies in the boundary layer for δ = 0°, 8° and 11° which is evident from the fluctuation in the signal beyond 50 Hz due to shock wave boundary layer interaction. Once the flap is deflected (δ = 8° and 11°), fluctuation becomes small due to increased boundary layer thickness where the eddies may probably be deteriorated. However, on the other hand, for δ = 12°, the fluctuations are nearly diminished due to un-start process where the flow is separated and the unsteadiness is probably washed away in the shear layer. In this case, a jump in the mean value of the pressure is seen due to un-start process caused by normal shock. On the other hand, bottom wall spectrum does not show the fluctuation (Fig. 17) where the favourable pressure condition exists and the flow may be laminar. In this case, the mean values are similar to top wall (Fig. 16).
Figure 18 (X/L = 0.53, top wall) shows increase in the mean pressure with increasing back pressure due to the communication of disturbance through boundary layer. At δ = 0° and 8°, the pressure signal contains low frequency oscillations (<50 Hz) indicating the existence of large scale eddies in the boundary layer. This causes the reflected shocks to oscillate (unsteadiness of the reflected shocks), which is captured in the Schlieren images (Figs 8, 9(a) and 9(b)) where smeared nature of the shocks could be seen at X/L = 0.53. This oscillation forces the disturbances to propagate upstream through boundary layer(Reference Beresh, Clemens and Dolling21). At δ = 11° and 12°, the pressure fluctuations are not seen in the spectrum owing to the fact that the flow becomes unstart.
The effect of increasing dynamic pressure (q∞ = 105 kPa, top wall) on pressure spectrum is shown in Fig. 19 for different flap angles at X/L = 0.53. In this, low-frequency oscillations (<40 Hz) are not seen; hence, the reflected shocks are not oscillatory in nature. This is because the boundary layer contains high momentum which suppresses the shock wave boundary layer interaction. Unlike δ = 11° (Fig. 18), the flow is started in this case due to high dynamic pressure that causes the boundary layer to attach to overcome the adverse pressure gradient generated by the back pressure. For further rise in back pressure (δ = 12°), un-start could be seen due to strong adverse pressure gradient.
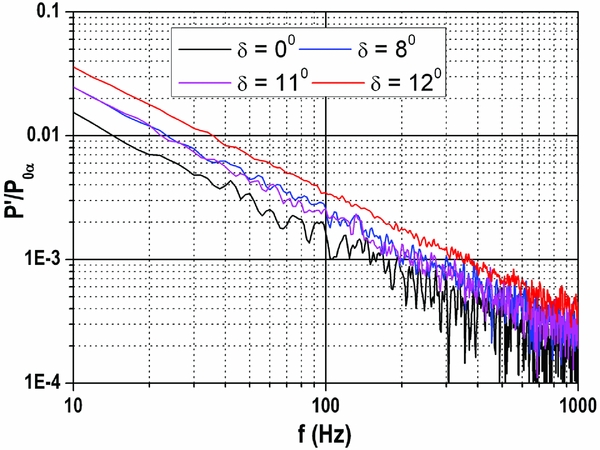
Figure 19. Pressure spectrum at X/L = 0.53 (Top wall), q∞ = 105 kPa.
The unsteady pressure measurement indicates different scales of eddies above 80 Hz (with and without flap deflection). At X/L = 0.03 (close to the entry of the duct), under zero flap deflection, the maximum fluctuating component is 0.01% of the stagnation pressure. Once the flap is deflected to 8° (increasing the back pressure), eddies are decayed by one order. On the other hand, for un-started condition, eddies disappeared. Similar observation holds good at X/L = 0.53 except the maximum fluctuating component. In this case, the maximum fluctuating component is 0.1% of the stagnation pressure. The reason for the above behaviour could be due to upstream movement of shock train which makes the boundary layer to become thick (decaying of eddies) and subsequently causing it to separate the boundary layer (disappearance of eddies). Up to 11° of flap deflection, the upstream propagation of the shock is slow and the duct is partially un-start. Once the flap angle is increased beyond 11°, the shock moves very fast towards duct/isolator inlet and the flow becomes fully un-start (Figs 11–14). This behaviour is due to upstream communication of disturbances through boundary layer. The communication is slow up to δ = 11° beyond which, it is very fast. This is evident from the eddy characteristics presented in Figs 16–19.
6.5 Effect of dynamic pressures on start/un-start characteristics
In the present case, how an un-start condition (δ = 12.5° at 105 kPa) of the duct/isolator is altered due to increase in freestream dynamic pressure (q∞ = 105, 126 and 151 kPa) is studied. Towards this unsteady pressure measurements are carried out at two locations namely X/L = 0.03 (bottom wall) and 0.53 (top wall). Pressure spectrum plot at X/L = 0.03 (Fig. 20) shows three different dynamic pressure conditions viz un-start (105 kPa), partially start (126 kPa) and fully start (151 kPa). The pressure spectrum of the un-start case (105 kPa) is similar to the earlier case (Fig. 17). Increasing the dynamic pressure to 126 kPa makes the duct/isolator flow to become locally supersonic which is marked by a reduction in the pressure ratio. However, large oscillations could be observed at low frequencies indicating that the shocks are unsteady. Further increase in dynamic pressure (151 kPa) causes the shock train to move downstream and reduces the unsteadiness. In this case, the flow is fully started.
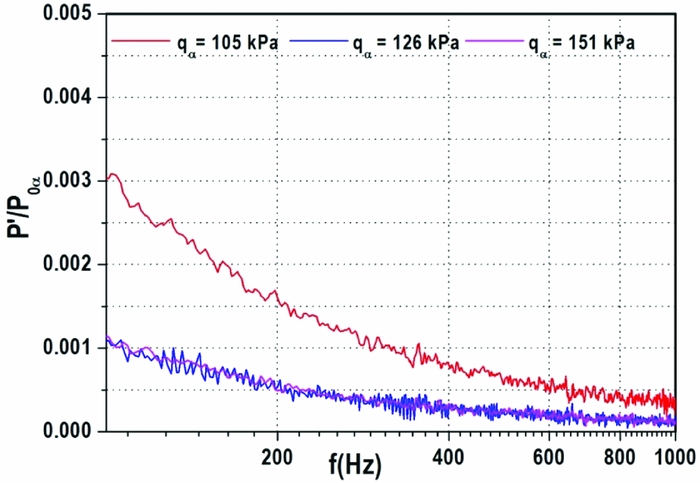
Figure 20. Pressure spectrum at X/L = 0.03 (bottom wall).
The unsteady pressure spectrum at X/L = 0.53 shown in Fig. 21 reveals no trace of eddies at q∞ = 105 kPa. For 126 kPa dynamic pressure, the mean value in the pressure decreases owing to cancellation of upstream communication through boundary layer. Once the dynamic pressure is increased to 151 kPa, the flow attaches, which is marked by large scale oscillation and the mean value of the pressure comes down indicate the flow is fully started.
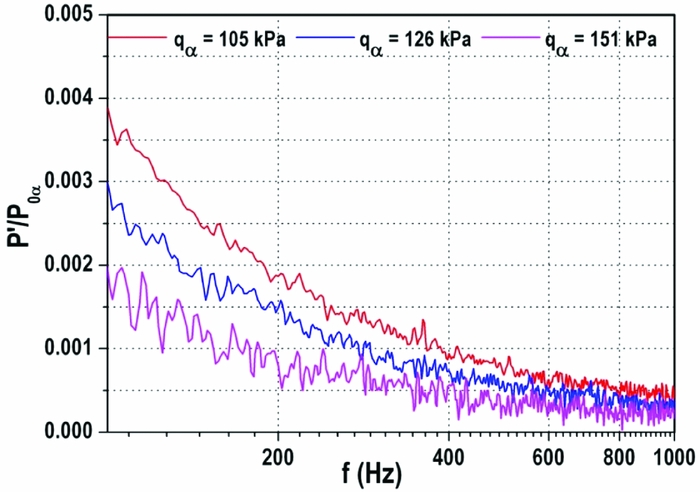
Figure 21. Pressure spectrum at X/L = 0.53 (top wall).
6.6 Estimation of pressure recovery
Pressure recovery in a duct/isolator is the indication of its efficiency and performance. In order to estimate the pressure recovery, it is necessary to calculate the losses associated with shocks and skin friction. The total pressure loss incurred due to shocks can be calculated through Pitot pressure measurements. But, it is difficult to estimate the skin friction loss due to the requirement of boundary layer profile. Hence, it is a challenging task for an experimenter to estimate them from tunnel measurement.
In the present case, a methodology is adopted to calculate the pressure recovery based on chocked flow condition (second throat at flap) at the duct/isolator exit for large flap angles (above 8°). However, this is not valid for low flap deflections, where the flow in the duct/isolator exit is supersonic. Thus, the measured wall pressure at flap throat (minimum flow passage) is used to estimate stagnation pressure loss by applying chocked flow condition. The pressure recovery is computed by taking the ratio between stagnation pressure at the exit of duct/isolator and the settling chamber pressure.
In the present case, as a result of fully accelerated flow, a strong normal shock is formed just ahead of duct/isolator exit (X/L = 0.8) for δ = 8°. Since the flow is fully attached throughout the duct, the losses due to the skin friction and multiple shock reflection are predominant. The pressure recovery for this case is 62% (Fig. 22). However, on the other hand, for δ > 8°, the losses due to shock reflections and skin friction are reduced due to the fact that the entire shock system moves upstream and hence, improved pressure recovery (70–73%) could be achieved. It may be noted that the theoretical pressure recovery based on inviscid normal shock theory is 85%, compared to the experimental value of 70–73%. It is difficult to distinguish pressure recovery for various dynamic pressure conditions, as the values are in the same range. If the flow is assumed to be three dimensional (low aspect ratio duct/isolator), the losses due to walls are high as compared to two-dimensional inlet (high-aspect ratio duct). The pressure recovery in the present investigation fairly matches with the result obtained for axi-symmetric duct(Reference Lee and Lee22).

Figure 22. Pressure recovery for different test conditions.
6.7 Effect of adverse pressure gradient
Figure 23 shows the pressure gradient plot for q∞ = 85 kPa. For δ = 0°, the maximum adverse pressure gradient of 2.6 occurs at the duct/isolator inlet (X/L = 0.03) due to the presence of lip shock. Adverse pressure gradient decreases gradually for successive reflections due to decrease in the strength of the reflected waves (X/L = 0.35 and 0.55). Beyond X/L = 0.6, expansion takes place, which leads to a favourable pressure gradient. For δ = 8°, positive pressure gradient exists at X/L = 0.8 due to normal shock as a consequence of chocking. Once the flap angle is increased to 11°, large zone of adverse pressure gradient exists beyond X/L = 0.45 due to shock train. For δ = 12°, beyond X/L = 0.2, subsonic condition exists while, a strong adverse pressure gradient is observed ahead of X/L = 0.2 due to the presence of normal shock. The pressure gradient plot for q∞ = 105 kPa shows similar trend (Fig. 24). It is observed that the similar adverse pressure gradient is seen at 105 kPa dynamic pressure as compared to 85 kPa for small flap deflections.
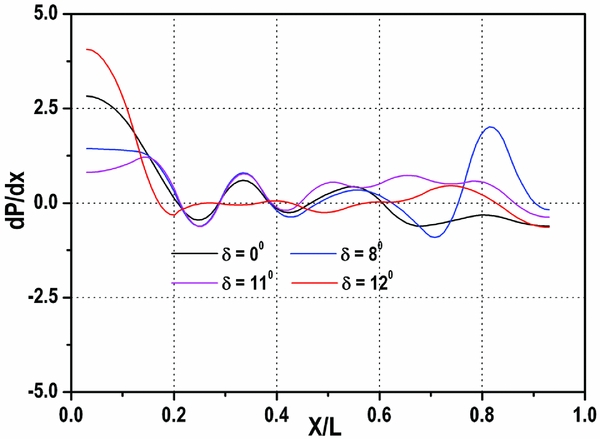
Figure 23. Pressure gradient distribution at q∞ = 85 kPa.
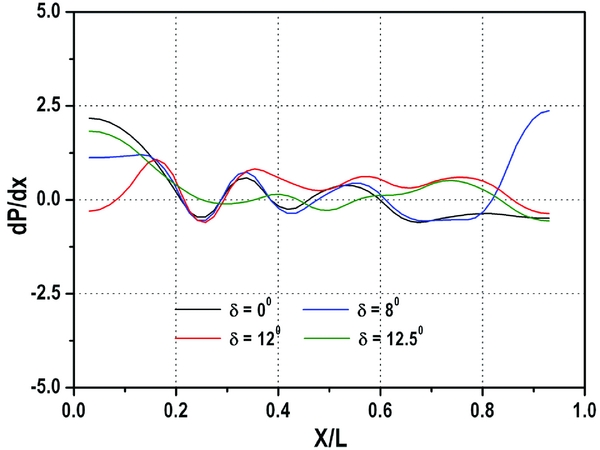
Figure 24. Pressure gradient distribution at q∞ = 105 kPa.
7.0 CONCLUSIONS
Comprehensive experimental studies are performed on low-aspect-ratio Ramjet engine duct to investigate flow unsteadiness during start/un-start process and shock train characteristics under various back pressure using steady and unsteady pressure measurements. The flowfield is captured using instantaneous Schlieren flow visualisation. The salient features of the present studies are as follows:
-
• The steady reflected shocks at the initial portions of the duct becomes oscillatory (unsteady) downstream of the duct.
-
• Steady pressure measurements indicate alternate compression and expansion process in the duct/isolator (0.29 < X/L < 0.62) at δ = 0°. Beyond X/L = 0.62, continuous expansion takes place to adjust the back pressure.
-
• When the back pressure is low (δ < 11°), the un-start process becomes slow whereas un-start process is observed to be fast beyond δ = 11°.
-
• For 85 kPa freestream dynamic pressure, the effect of increasing back pressure (δ = 8° to 11°) leads to push the shock train towards the duct inlet where the normal shock train becomes stronger. Beyond δ = 11°, un-start phenomena are seen due to maximum blockage generated by the flap.
-
• Increasing freestream dynamic pressure (105 kPa) by 23.5% delays un-start process and makes the flow to become supersonic over large portion of the duct/isolator for δ = 12° with the benefit of 9% increase in the blockage.
-
• Pressure spectrum indicates the existence of eddies in the boundary layer up to δ < 11° and the fluctuations are found to be dominant. Beyond δ > 12°, the fluctuations disappeared more or less due to un-start process. On the other hand, increase in mean pressure is observed for increasing back pressures.
-
• The large-scale eddies in pressure spectrum (X/L = 0.53) indicate that the reflected shocks are oscillatory and is responsible for the un-start process.
-
• Based on the pressure recovery calculation, the proposed duct/isolator configuration possesses 70%–73% pressure recovery.
-
• Maximum adverse pressure gradient occurs at duct/isolator inlet (X/L = 0.03) which gradually decreases in the reflected shocks region.
-
• The main outcome of the present study is the early prediction of unstart behaviour viz. decaying of eddies through unsteady pressure measurement. This would certainly help in adopting suitable control mechanisms to avoid unstart process and take appropriate mitigation steps to control the back pressure of a typical Ramjet engine.
-
• For efficient operation of Ramjet engine, a trade-off is required between pressure recovery and start/unstart characteristics that can be optimised by various duct configurations.
ACKNOWLEDGEMENTS
Authors would like to express their sincere gratitude to K. J. Sajitha, Aneesh Kumar, K.Suresh, Binu, Peter Jijo, Sineesh and Muthu Ramalingam for data acquisition and model fabrication. The support we received from N.Chandrasekar and Shiju for model fixing and smooth conduct of the tests in the facility is greatly acknowledged. Authors would like to place a record of gratitude to all the reviewers for their valuable suggestions and recommendation for publishing our work in this journal.