


NOMENCLATURE
- AF
alternate fuel
- ANAC
National Civil Aviation Agency of Brazil
- CGH
Congonhas Airport, São Paulo
- DMAIC
define, measure, analyse, improve, control
- FAA
Federal Aviation Administration
- FR
final reserve fuel
- GE
General Electric
- IATA
International Air Transport Association
- LCL
lower control limit
- Q
minimum fuel quantity
- S1
standard deviation before improvement
- S2
standard deviation after improvement
- SDU
Santos Dumont Airport, Rio de Janeiro
- SPC
statistical process control
- TF
trip fuel
- UCL
upper control limit
- Xbar1
average before improvement
- Xbar2
average after improvement
1.0 INTRODUCTION
1.1 Theory behind Six Sigma
By definition, Six Sigma is a disciplined, data-driven approach and methodology for eliminating defects (driving towards six standard deviations between the mean and nearest specification limit) in any process. It asserts that continuous efforts to achieve stable and predictable process results (e.g., by reducing process variation) are vital to business success, and achieving sustained quality improvement requires commitment from the entire organisation, particularly top-level management( Reference Pande, Neuman and Cavanagh 1 ).
The features that set Six Sigma apart from previous quality improvement initiatives include the following: a clear focus on achieving measurable and quantifiable financial returns from any Six Sigma project, increased emphasis on strong and passionate management leadership and support and a clear commitment to making decisions based on verifiable data and statistical methods, rather than assumptions and guesswork( Reference Nair, Malhotra and Ahire 2 , Reference Pysdek 3 ).
Moreover, Six Sigma provides a set of management techniques intended to improve business processes by significantly reducing the probability that an error or defect will occur, leading to greater customer satisfaction and increased profit margins( Reference Antony, Kumar and Madu 4 ). It was initiated in the 1980s by the Motorola company to improve the quality level of its products, making it a more competitive company against Japanese electronic industries( Reference Pande, Neuman and Cavanagh 1 ) and thereby achieving monetary gains( Reference Nair, Malhotra and Ahire 2 ).
Since the 1990s, the Six Sigma methodology has been spread among companies from different sectors. Although it was originally tied to traditional concepts of quality, its evolution moved beyond the minimalist context of seeking compliance. Currently, Six Sigma can be defined as a means of aiding companies in making money by improving efficiency and bringing value to customers( Reference Pysdek 3 ).
1.2 Background of Six Sigma application in refuelling process
Air transportation is a sector comprising high operating costs and strong competition. By improving efficiency and offering value to customers, it enables companies to pursue new management strategies and innovation techniques for operational departments continually, which are dynamic tools for aircraft maintenance( Reference El Moudani and Mora-Camino 5 ).
The literature offers further definitions for Six Sigma, namely, that the focus is on risk reduction and not only defects( Reference Harry and Schroeder 6 ) but also that companies aim to leave no room for error so that they meet the end customer needs or internal client requirements, making it possible to achieve Six Sigma( 7 ). Furthermore, Six Sigma can be applied to numerous types of activities; for instance, General Electric (GE) was recognised globally for its gains obtained using the application of Six Sigma to review the business unit of aircraft engines( Reference Henderson and Evans 8 ).
A total of 22 articles were found to relate to this issue to an extent, namely, analysis of the application of Six Sigma in the refuelling process. The selection criteria in this study were the presence of any airline company using the application of Six Sigma and the improvement of certain processes involving the aviation fuel. However, articles that focused on the benefits of biofuel or those that addressed the procedure of refuelling aircraft in flight for military practice were disregarded, as they were not aligned with the cited issue.
Nevertheless, several studies exist involving Six Sigma in aviation( Reference Henderson and Evans 8 – Reference Thomas, Mason-Jones, Davies and John 11 ) or reporting the improvement of processes with a focus on jet fuel( Reference Abdelghany, Abdelghany and Raina 12 – Reference Shackel and Klein 14 ). Moreover, the results of all of these were presented according to single case studies. In the case of Akbulut-Bailey et al.( Reference Akbulut-Bailey, Motwani and Smedley 9 ), an aircraft manufacturer was able to improve its quality by deploying a combination of Six Sigma and another approach. However, according to Henderson and Evans( Reference Henderson and Evans 8 ), the aeronautics division of GE has been achieving the highest levels of Six Sigma, thereby encouraging a culture of continuous improvement. According to Maleyeff and Krayenvenger( Reference Maleyeff and Krayenvenger 10 ), Six Sigma contributed to the required tolerance in the vanes of aircraft engines, which was achieved in the laser machining process. In the case of Thomas et al.( Reference Thomas, Mason-Jones, Davies and John 11 ), Six Sigma was used to organise and reduce the amount of storage and, consequently, cause the aircraft engines to require fewer days for repair. Moreover, Abdelghany et al.( Reference Abdelghany, Abdelghany and Raina 12 ) developed a fuel management model that determines whether it is worth supplying an aircraft with home-based gas or flying further elsewhere to fuel the aircraft with a lower-priced gas. However, Babic( Reference Babic 13 ) presented a model that allows for using the lowest amount of tankers, ensuring that the refuelling process occurs without causing flight delays. Meanwhile, Shackel and Klein( Reference Shackel and Klein 14 ) presented the consequences of improving the fuel supply controller workplace and considered flight delays regarding the refuelling process.
According to Ryerson and Hansen( Reference Ryerson and Hansen 15 ), aircraft fuel accounts for the largest share of operating costs, and according to Narangajavana et al.( Reference Narangajavana, Garrigos-Simon, Garcia and Forgas-Coll 16 ), the price of fuel is highly volatile, and bad decisions may have a negative effect on the financial health of the airline. However, the scenario is even more complex in Brazil, where the price of fuel is substantially higher owing to taxes( 17 ).
As stated by Muller and Chatterji( Reference Muller and Chatterji 18 ), airlines started to pay increased attention to the impact of flight delays when they were required to disclose these statistics. In 1999 alone, flight delays totalled 22.5 million min in the United States, resulting in costs of 3.2 Bn USD, which is equivalent to 27% of profits in that year. The fuel supply, along with other events taking place on the ground, such as boarding, luggage space and unscheduled maintenance, are the main factors resulting in flight delays.
In contrast, in 2015, the fuel price reduction promoted a record in profit margins for North American airlines of 7.5%. However, the Brazilian market did not benefit from this; on the contrary, it continued to regress, as the country had the highest fuel price in the world because of its high tax policies( 17 ).
Airline profits depend mainly on the extent to which companies can keep an aircraft flying. However, lengthier on-the-ground handling tasks result in greater opportunities for losses( Reference Davies 19 ). Aircraft refuelling is a type of handling task and is required for an aircraft to fly safely( Reference Kinnison and Siddiqui 20 ).
As no articles were identified that deal with the application of Six Sigma in airline maintenance processes, the aim of this study is to analyse this aspect in order to reduce flight delays, the main cause of which is fuel supply. Thus, a question to bear in mind is the manner in which to apply Six Sigma in the refuelling process so that flight delays are minimised.
This study considers standard International Air Transport Association (IATA) delay codes; for example, 31: aircraft documentation late or inaccurate, weight and balance, general declaration, pax manifest; 36: fuelling, refuelling and fuel supplier; and 62: operational requirements, fuel/load alteration( 21 ).
The objective of this study is to make use of the application of Six Sigma to reduce flight delays. Changes are made to the refuelling process, starting with a fuel supply at the minimum level and, when an order for fuel arrives, a load with the requested remaining amount is filled. The referenced minimum level is the one performing the shortest flight by the airline: in this case, the Sao Paulo–Rio flight.
The remainder of this paper is organised as follows: Section 2 provides a literature review and develops propositions; Section 3 introduces the methodology and data collection method; Section 4 presents the results and a discussion of a case study; and Section 5 concludes the paper and suggests topics for future research.
2.0 LITERATURE REVIEW AND PROPOSITIONS DEVELOPMENT
2.1 Literature review
In the literature review, 22 related articles were identified, and these were divided into two frameworks. For the first, 14 articles that discuss the application of Six Sigma in the aviation sector are presented in Table 1. For the second, eight that discuss the relationship between aviation fuel and airlines are presented in Table 2.
Table 1 Application of Six Sigma in aviation

Table 2 Relationship between aviation fuel and airlines

Considering the 14 articles mentioned above, several categories were determined, taking into account the logic of macro to micro and generalised to specific. For example, articles that studied the application of Six Sigma in military aviation or focused on aircraft manufacturers were considered as macro. This is because the research did not conduct in-depth analysis on this segment regarding the application of Six Sigma in the refuelling process. However, articles that analysed the application of Six Sigma in airlines, such as airline aircraft maintenance, were considered as micro for the opposite reason.
Therefore, in the table below, among the 14 articles identified, 6 were more related to the issue in question, while 5 had an application in airlines. Only one studied the application of Six Sigma in airline maintenance.
In accordance with the eight articles cited above regarding the relationship between jet fuel and airlines, categories were similarly determined considering the logic of macro to micro and generalised to specific. For example, articles that analysed fuel costs without an action plan were considered as macro, while articles that analysed fuel costs and operational process improvements were considered as micro. It is important to note that none of these articles applied Six Sigma.
Therefore, certain articles were identified. Three of these included actions that allowed airlines to reduce the impact of the jet fuel price on the companies; however, only two articles implemented a change in the fuel supply process without making use of Six Sigma at this time, as it had not yet been created.
2.1.1 Application of Six Sigma in aviation
Motorola’s initiative of investing money to improve quality resulted in greater profitability. However, this was not considered common sense for American companies at the time, which believed that investing in quality was expensive and the return on investment was doubtful. After the company received the Malcolm Baldrige National Quality Award and disclosed earnings of 2.2 Bn dollars through its initiatives, the term Six Sigma gained fame and consistency( Reference Pande, Neuman and Cavanagh 1 , Reference Nair, Malhotra and Ahire 2 ).
Simultaneously with Motorola, GE became famous for its results obtained through Six Sigma. In the first year of its implementation, the company reported 300 m dollars earned. In addition to economic gains, GE was recognised as a disseminator of Six Sigma, multiplying training for its suppliers and any company interested in following in its footsteps( 7 ).
One of the first GE business units that introduced Six Sigma was the revision of aircraft engines. As it was necessary to improve service quality and decrease rework as well as reduce the amount of time required for repairing engines, the company could become more efficient( Reference Henderson and Evans 8 ).
Thereafter, maintenance, repair and overhaul facilities or manufacturers of aircraft parts implemented Six Sigma, seeking to reduce the total time of parts in the facility. An example of this is a company that was responsible for engine part production through laser, so that tolerance could be met in pursuit of zero defect production( Reference Maleyeff and Krayenvenger 10 ), which is a characteristic of the Six Sigma features. However, the airline company did not take advantage of this concept to make Six Sigma available for its operation( Reference Thomas, Mason-Jones, Davies and John 11 ).
Moreover, articles( Reference Blokland, Waard and Santema 22 – Reference Chang, Huang and Torng 26 ) citing Six Sigma as a tool enable companies to achieve the following: service level contracts, training and standardisation of processes, safety culture and flight safety. Furthermore, it is worth noting that Six Sigma is present in the supply chain of aeronautical components( Reference Akbulut-Bailey, Motwani and Smedley 9 ) and military aviation( Reference Weber 27 , Reference Wong, Halim and Tan 28 ). However, these articles were not considered as relevant to this study.
In the process of airline maintenance, one means of applying Six Sigma is to focus on reducing high costs with maintenance; that is, the replacement of premature worn-out parts, transport and storage of parts, anticipated task planning for the life cycle of parts and undone tasks owing to a lack of specialised labour( Reference Shanmuganathan, Haran, Ragavendran and Gayathri 29 ).
2.1.2 Relationship between aviation fuel and airlines
Regarding expenses, the highest portion of operating expenses for an airline consists of the jet fuel cost( Reference Ryerson and Hansen 15 ). This item is so critical that may affect the financial health of airlines( Reference O’Kelly 30 ). In addition to high costs, a major challenge for companies is the volatility in the price of aviation kerosene( Reference Narangajavana, Garrigos-Simon, Garcia and Forgas-Coll 16 ).
In the 1990s, the fuel cost in the US accounted for 12% of operating costs( Reference Swan and Adler 31 ). The same figure was determined in a large European airline during the same period( Reference Seristo and Vepsalainen 32 ). However, the fuel cost tripled between 2004 and 2008, encouraging airlines to promote improvements in processes and investments in innovations in order to reduce fuel consumption( Reference Ryerson and Hansen 15 ).
To achieve this, airlines have been taking action and transforming their processes in seeking more cost-efficient use of fuel, such as adopting routes that consume less fuel at airports with lower prices. However, aircrafts with more fuel than required become overweight, increase fuel consumption, and may increase the need for maintenance( Reference Abdelghany, Abdelghany and Raina 12 , Reference Jupp 33 ).
As the price range of fuel varies significantly among different locations and represents numerous aspects, this becomes a key factor in determining where future operations centres should be located( Reference O’Kelly 30 ) in terms of airline operation costs. This is so important that the impact on expenses even justified investments in an oil refinery by a major American airline( 34 ).
In 2015, despite the impact of JET-A1 fuel on company financial statements, the reduction in fuel price promoted a record of profit margins for North American airlines estimated at 7.5%. The worldwide average was not as high, at only 4%, but it almost doubled the value achieved in the previous year. However, Latin America exhibited a 1.8% profit, the main reason for which was that the Brazilian market continued to regress, as the country had the most expensive fuel in the world owing to high taxes( 17 ).
Thereafter, because of this scenario, the price of a domestic flight ticket in Brazil could cost 50% more than that of international flights within the same distance. For example, it is significantly more expensive to travel from the city of Sao Paulo to Aracaju city than to travel from Sao Paulo to Buenos Aires( 35 ).
Apart from fuel prices, one factor that has attracted the attention of Brazilian airlines is the control of flight delays. For example, major delays occurred in the United States in 1999, which was the year that airlines were required to disclose flight delay statistics. During 1999 alone, North American flight delays accounted for 22.5 m min, approximately 3.2 m dollars, which was equivalent to 27% of the airlines. In Brazil, this became mandatory in 2014. It is worth noting that fuel supply, along with other events taking place on the ground, is the main factor resulting in flight delays( Reference Muller and Chatterji 18 ).
In a similar way to the Federal Aviation Administration (FAA) establishing penalties for airlines that did not comply with flight delay goals in Brazil, the Agência Nacional de Aviação Civil (ANAC), a similar agency to the FAA, also established penalties, such as the loss of flight slots if the airline does not fulfil timeliness goals.
Fuel supply is the most time consuming process that takes place when the aircraft is on the ground. If any problems occur during refuelling, the chance of flight delays increases significantly. When a major delay occurs, the airline in question may be fined and penalised; moreover, flight delays generate customer dissatisfaction( Reference Babic 13 ).
It is important to note that the completion of aircraft fuelling is a stressful process for everyone involved. This may be owing to the time pressure exerted by the airline itself so that the flight takes off on time, or operational security that involves the entire process( Reference Shackel and Klein 14 ).
2.2 Development of the study propositions
Although studies have already been carried out on improving fuel supply processes on the tarmac( Reference Babic 13 , Reference Shackel and Klein 14 ), the application of Six Sigma in the process of airline maintenance was only identified with a focus on component reliability( Reference Shanmuganathan, Haran, Ragavendran and Gayathri 29 ). Furthermore, Brazil has the most expensive aviation fuel in the world( 17 ) and airlines may be penalised if they do not meet the punctuality goals( Reference Muller and Chatterji 18 ). It should be noted that the aviation sector is quite regulated, particularly regarding aircraft maintenance( Reference Shanmuganathan, Haran, Ragavendran and Gayathri 29 ).
However, maintenance is still viewed as a process that consumes airline resources and is not profitable( 36 ). Moreover, significant intra-airline pressure exists between flight operation and aircraft maintenance; that is, between making planes available to market flights and retaining aircraft to perform maintenance activities( Reference Davies 19 ).
Therefore, the proposition (P1) of this study is to reduce the amount of flight delays through the application of Six Sigma in the aircraft supply process in two manners:
∙ It is possible to measure flight delays as the main cause owing to standard IATA delay codes 31, 36 and 62.
∙ It is possible to measure flight delays according to two steps: fuel supply at a minimum level and, when an order for fuel arrives, a load with the requested remaining amount is filled.
3.0 METHODS
3.1 Research methods
The method adopted in this study is inductive, through which the relationship between the studied facts reflects reality and not simply an accidental similarity( Reference Eisenhardt and Graebner 37 ). Moreover, this study uses both qualitative and quantitative approaches, relying on figures and subjective variants( Reference Yin 38 ) and ranks in exploratory research, as it paves the way for future studies on this topic( Reference Eisenhardt 39 ). Thus, as an exploratory study, it is justified to be a single case study( Reference Yin 38 ).
The selection of a case study is suitable as little literature is available on this issue and owing to the opportunity to present new findings in line with the reality of companies. The case study procedure consists of the presentation of the company, research protocol, data collection, data analysis and conclusions. The selected data collection technique is a semi-structured interview with open questions, allowing respondents to submit arguments based on their daily on-service reality( Reference Yin 38 ).
3.2 Six Sigma method
Six Sigma was implemented using the concepts of DMAIC, a strategic tool that assists in implementing the structure. The adoption of DMAIC is to fulfil its five stages according to its acronym, namely, define: problem identification, structuring the improvement project; measure: define the criteria and data collection; analyse: generate reports and investigate causes; improve: deploy actions and mitigate the problem; and control: check the efficiency of the actions taken( Reference Pysdek 3 ).
In order to assist with the analysis, the author applied Student’s t-test, a famous hypothesis testing method that was designed to evaluate the differences between the means of two groups by using statistical concepts to reject or not reject the null hypothesis. In order to achieve this, a sample with statistical significance should be taken into account; that is, one obtained from a population belonging to their origin and, thereby, their observed differences are those originating from normal fluctuations( 40 ).
Student’s t-test is most commonly applied when the test statistics follow a normal distribution and do not allow anyone to know the population variance. Moreover, Student’s t-test table was used in this study to determine the critical t-value, while the following equation was applied to calculate the practical t-value( Reference Pysdek 3 , 40 , Reference Privitera 41 )”:
 $${ t{\equals}}{{{\rm Xbar1{\minus}Xbar2}} \over {\sqrt {{{S1^{2} } \over {n1}}{\plus}{{S2^{2} } \over {n2}}} }}$$
Furthermore, statistical process control (SPC) was used to measure and control quality during the refuelling process, analyse the output parameters, achieve and maintain a state of statistical control, and improve the process capability. In terms of statistics, SPC allows for the calculation of a reasonable range and is set by control limits. A reasonable value is likely to occur given a natural variation. The upper and lower control limits indicate the maximum and minimum reasonable values, respectively( Reference Pysdek 3 – Reference Privitera 41 ).
The measurement system analysis of this case study was conducted during two non-sequential months. Randomised research was carried out by means of field observations, semi-structured interviews, document analysis and systems analysis, in addition to considering the researcher’s point of view on the study( Reference Yin 38 ). The data collected were the amount of fuel supplied in each aircraft, flight delay reasons, aircraft identification codes, names of on-duty handlers, among others. This was only possible through personal and in loco interviews. A total of 200 events were considered to reach the goals of repeatability and reproducibility.
In-depth interviews were carried out using open-ended questions, enabling the respondents to feel free to state which type of service they provided as valuable information for decision making regarding the results achieved( Reference Yin 38 ). The interviews that allowed for data collection were developed according to the following three documents. The first regarded job position and length of experience; the second allowed for the collection of numerical data; and the third document was composed of a series of questions regarding the process quality and subjective issues.
All of the data collected were digitised and analysed. The study considered quantitative and qualitative bias with the airline representatives, and an action plan was introduced to reduce flight delays and improve the quality level.
3.3 Case method
The case study was carried out at Congonhas airport in the city of Sao Paulo, which is the airport with the highest volume of domestic flights per day for the studied airline. This airport has the most direct flights to the Santos Dumont airport in the city of Rio de Janeiro, every 30 min on average, totalling approximately 30 daily flights, corresponding to over 30% of take-offs, which is an impressive statistic.
As refuelling requires approximately 30 min, and this process involves the handler, this may result in flight delays, involving airline punctuality and efficiency. However, this is not the only process responsible for causing flight delays because it takes a long time. Other problems may occur during refuelling and may involve minutes of delay. Thus, when aircraft refuelling causes flight delays, it does not aid in identifying other possible at-risk tasks for delays.
The main cause for flight delays owing to fuel supply is awaiting the arrival of bureaucratic paperwork. Within this paperwork is the amount of fuel required for the aircraft; this information is not generated by the maintenance department itself, but rather originates from the operations department.
Therefore, in order to reduce these flight delays, certain ground handlers have suggested starting to fuel the aircraft even without having received an official written request (order), with a minimum amount of 6,000 kg of fuel, the minimum required to perform shorter flights. Thus, if what was requested (any amount over 6,000 kg of fuel) arrived late, the remaining quantity would be fuelled, minimising flight delays. However, the amount of fuel required for each domestic flight involves the equation below:
 $$Q{\equals}{\rm taxifuel}{\plus}{\rm TF}{\plus}{\rm AF}{\plus}{\rm FR}$$
where Q is the minimum level required. Taxi fuel is the necessary fuel for performing operations on the ramp prior to take-off and after landing; TF is the level of fuel required for the flight between the airports; AF is the required fuel for the alternate airport in case, for example, the target primary airport is closed owing to bad weather; and FR is the residual end of fuel amount that should be sufficient for flying at least 45 min under normal cruise conditions( 42 ). Thus, it is worth mentioning that procedure changes were since agreed to by the chief pilot.
It is important to note that the company considered in this case study is the largest air company in Latin America, with more than 300 aircrafts and the most flights to 25 countries. No other air company group exists with more destinations in the same region. Although this study considers only one company, the relevant fact is that this company is the largest in the continent.
3.4 ‘Before-and-after’ procedure
The data collection used in this study followed a two-stage process known as the ‘before-and-after’ procedure. This is depicted as follows: prior to making any type of change or improvement in the aircraft refuelling process, and with flight delays in mind, the project leader collected five distinct events – those related to following the refuelling procedure – in the early morning, and five in the early evening, totalling 10 events per day. Bearing in mind the aim of eliminating trends and seasonality, the study considered every day of the week; however, not consecutively. Following this, the data were collected on 10 non-consecutive days. Thus, the total number of events was 100, through which the project leader confirmed the inaccuracy of the refuelling process prior to the improvements. The ‘after’ procedure involved another 100 events, collected to measure flight delays in a similar manner to that demonstrated in the ‘before’ procedure mentioned above.
Probable measurement and process errors may occur owing to a lack of full attention by the observer, weather conditions (heavy intermittent rains), human factors (motivation and commitment to the process) and intervention by federal police (surveillance). These may influence the results and should therefore be taken into account. Considering the 100 events cited above, any study applying this method should rely on a confidence interval of 95% so that it can preview these drawbacks existing during the process as well.
4.0 RESULTS
It can be confirmed that the application of Six Sigma to the aircraft refuelling process in a Brazilian airline is of significant value. In accordance with Nair et al.( Reference Nair, Malhotra and Ahire 2 ), general companies that apply Six Sigma seriously yield a remarkable improvement in the levels of quality of their products or services. Moreover, in aviation, this is not different. Its application at GE, as studied by Henderson and Evans( Reference Henderson and Evans 8 ), demonstrates that companies in the aviation industry can also apply Six Sigma and improve their quality. After all, GE is an example to be followed in terms of application with success and enviable results regarding Six Sigma.
In order to verify whether it is possible to reduce the amount of flight delays through the application of Six Sigma in the refuelling process, using proposition P1 as previously defined, two hypotheses were prepared to be tested:
∙ P1.1: Is it considered a preferable choice if operations department information is awaited to start refuelling of the aircraft without interruption?
∙ P1.2: Should they start the supply of aircraft with 6,000 kg of fuel regardless of whether the operations department has not yet informed the necessary amount?
A total of 100 observations were made for each hypothesis. For such large samples, it is not necessary to check the normality. Equation (1), cited above, allowed us to calculate the practical t value. The critical t value was 1,984. This figure was obtained considering two-tailed test tables for a significance level of 5%. A low significance level was considered to mitigate decision errors( Reference Pysdek 3 , Reference Privitera 41 ).
As illustrated, the practical t value was found to be 38.5656, which is substantially higher than the critical t value of 1.984 provided in Student’s t-test table for a confidence interval of 95% and sample size of 100 observations. Therefore, it was demonstrated that there is a significant difference between the fuelling processes before and after improvement.
Following are three graphs illustrating the ‘before’ refuelling process in Fig. 1, the ‘after’ in Fig. 2 and a comparison between the two scenarios in Fig. 3. Bear in mind that axis x represents events, while y indicates the minutes of flight delays. Figure 1 presents the application of SPC in the ‘before’ refuelling process for the data analysis. As it is possible to collect and analyse these data, the P1.1 proposition is tested. As a result of the study, the 100 measured events averaged flight delays of 14.19 min, a standard deviation of 19.44 min and upper control limit (UCL) of 72.50 min.
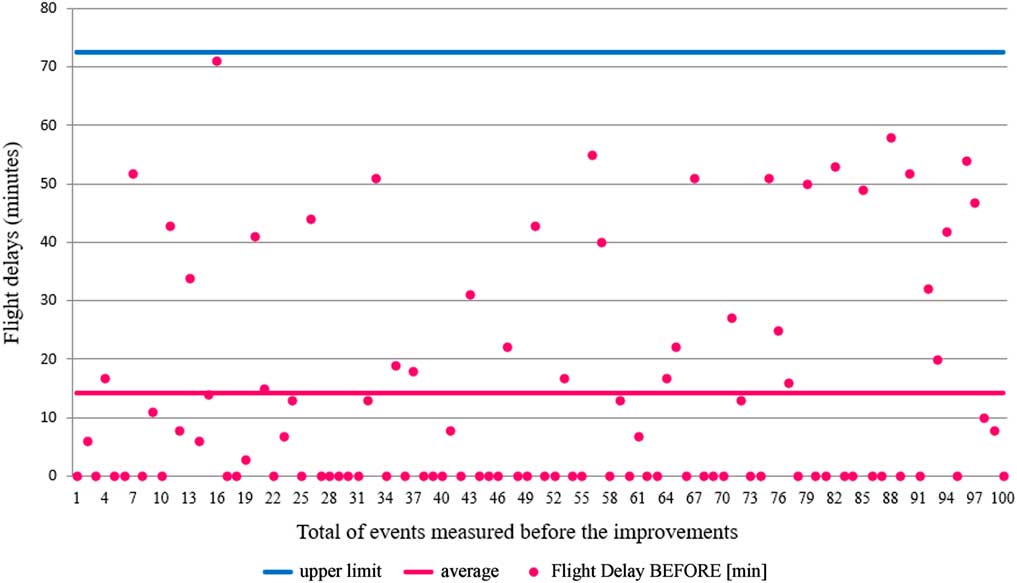
Figure 1 Statistical process control (SPC) for current process.
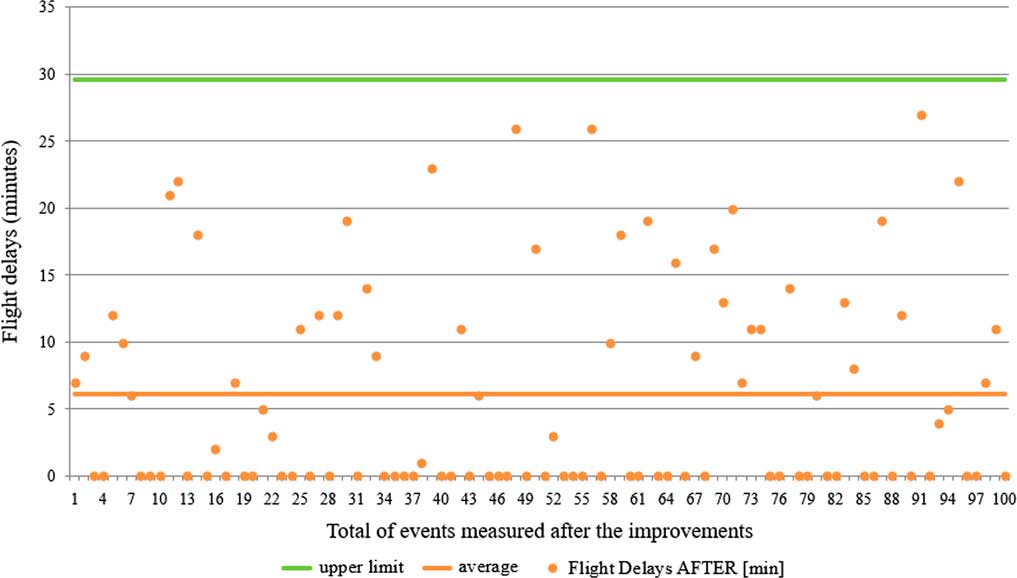
Figure 2 Statistical process control (SPC) for refuelling in two steps.

Figure 3 Comparison between before and after improvement.
In the same manner, Fig. 2 presents the application of SPC in the ‘after’ refuelling process for the data analysis. As it is possible to collect and analyse these data, the P1.2 proposition is tested. The results from the 100 measured events averaged flight delays of 6.11 min, a standard deviation of 7.82 min and UCL of 29.58 min.
In the same manner, Fig. 3 presents a comparison between the two scenarios (Figs 1 and 2). The results from the 100 measured events demonstrated the extent of the reduction: an average flight delay reduction of 57%, a standard deviation reduction of 60% and an UCL reduction of 59%. It is possible to observe that these reductions were significant to noticing the improvement between the ‘before’ and ‘after’ processes. It can also observed here that the dispersion in the ‘after’ process is substantially more concentrated than that in the ‘before’ process.
5.0 DISCUSSION
One factor influencing the increased number of flight delays is the occurrence of more complex incidents that occurred during the ‘before’ process; for example, problems that require maintenance actions with material supply, ground time, and qualified labour. The occurrence of problems of this type caused the studied company to experience lengthier flight delays. This result corroborates the work of El Moudani and Mora-Camino( Reference El Moudani and Mora-Camino 5 ) and Kinnison and Siddiqui( Reference Kinnison and Siddiqui 20 ), who stated that maintenance problems can result in flight delays. They stated that if a task is not executed at the time, it should be planned again, increasing the risk of an unresolved maintenance problem, which may result in new flight delays. Therefore, this study contributed from the moment it reduced the amount of flight delays.
The study did not consider all of the activities involving ground services for the analysis of flight delays; for example, it did not address airline catering services or cleaning. The application of Six Sigma improved the level of service quality offered, mitigating the risks of passengers experiencing long delays and the airline being fined. This result is aligned with the work of Muller and Chatterji( Reference Muller and Chatterji 18 ), in which it was found that flight delays can result in fines and penalties for airlines. In Brazil, there events were reported by the media that resulted in the application of penalties and fines in the order of millions of dollars. This usually occurred when there was a lack of control in the management of departure and arrival times. Therefore, this study represents a breakthrough considering that improving the aircraft refuelling process will reduce flight delays, minimise the risk of receiving fines and penalties, and provide a service with a higher quality level.
6.0 CONCLUSIONS
By means of the implementation of Six Sigma in the refuelling process of an aircraft in a Brazilian airline, a framework based on the literature review was established. In this manner, it was possible to test the proposition, reducing flight delays by a significant average of 57%. Moreover, fines and penalties have been issued by ANAC – the Brazilian agency, forcing air companies to minimise flight delays as a means of improving the process. This resulted in an improvement in the quality of services provided by the company studied when comparing the ‘before’ and ‘after’ refuelling processes.
The objective of this study was achieved: the application of Six Sigma in the refuelling process was satisfactory. As mentioned previously, in order to reduce flight delays, a change was made in this process, starting with a fuel supply of the minimum amount and, when an order for fuel arrived, a load with the requested remaining amount was filled. The referred minimum amount of fuel was the one to perform the shortest flight by the airline.
Furthermore, it should be noted that no investment was required for the changes made to the process in the study. It is noteworthy that, in this literature review, there were no studies that addressed the application of Six Sigma or even the reduction in flight delays with the refuelling process.
One limitation of this research is the fact that this is an exploratory study; therefore, the results presented here cannot be generalised. However, the method used here can be replicated for catering services, cleaning or any other relevant areas.


