


NOMENCLATURE
- Eij (i, j = 1, 2, 3, i = j)
young's moduli
- Gij (i, j = 1, 2, 3, i ≠ j)
shear moduli
- νij (i, j = 1, 2, 3, i ≠ j)
poisson's ratios
- XT
longitudinal tensile strength
- XC
longitudinal compressive strength
- YT
transverse tensile strength
- YC
transverse compressive strength
- S 12
in-plane shear strength
- G lamIc
laminate-level fracture toughness
- Pc
critical loading
- ΔL max
fibres’ maximum elongation
- Gc
mixed-mode interlaminar fracture toughness
- GIc
mode I interlaminar fracture toughness
- GIIc
mode II interlaminar fracture toughness
- GIc|ft
intralaminar fibre-dominated tensile fracture toughness
- GIc|fc
intralaminar fibre-dominated compressive fracture toughness
- GIc|mt
intralaminar matrix-dominated tensile fracture toughness
- GIc|mc
intralaminar matrix-dominated compressive fracture toughness
- GIIc|ms
intralaminar shear fracture toughness
- ci (i = 1, 2, 3)
coefficients for defining non-linear shear properties
- η
benzeggagh–Kenane coefficient
- d T/C11
failure indices for fibre-dominated tensile/compressive damage
1.0 INTRODUCTION
Due to their superior specific mechanical properties and corrosion resistance, carbon-fibre reinforced composites have been widely used in the manufacturing of modern aerostructures(Reference Falzon1). As an important material property, the intralaminar tensile fracture toughness is relevant not only to material qualification for the design of composite aerostructures, but also to the definition of the softening laws used in the computational models for predicting the behaviour of composite structures(Reference Catalanotti, Xavier and Camanho2). There is still no agreed standard for intralaminar fracture toughness testing of composite plies. The accurate measurement of intralaminar fracture toughness associated with fibre-dominated tensile failure is arguably more challenging than measuring interlaminar fracture toughness(Reference Middleton3). Moreover, the development of a new generation of high-tensile-strength carbon-fibre presents several challenges to the measurement of the intralaminar tensile fracture toughness of composite laminates.
A number of studies(Reference Catalanotti, Camanho, Xavier, Dávila and Marchques4-Reference Marchchetti, Barbera and Morganti9) have been carried out on the fracture toughness associated with fibre-dominated tensile failure. Vaidya and Sun(Reference Vaidya and Sun10) studied the fracture characteristics of composite laminates and developed a fracture criterion which showed that the critical stress intensity factor for fibre failure is a material constant. Blanco et al(Reference Blanco, Trias, Pinho and Robinson11) investigated different geometric configurations of the CT specimen for the characterisation of the tensile intralaminar fracture toughness of woven composite laminates. Based on analysis, a methodology was proposed for the design of an appropriate CT specimen. Donadon et al(Reference Donadon, Falzon, Iannucci and Hodgkinson12) proposed a new geometry for an Over-height Compact Tension (OCT) specimen for testing hybrid plain weave laminates. The OCT test was also used by Li et al(Reference Li, Hallett, Wisnom, Zobeiry, Vaziri and Poursartip13) to investigate the formation and propagation of the process zone for large structures and to gain insight into the effect of dispersed and blocked plies on the intralaminar fracture toughness.
It is necessary to point out that the reference CT test(Reference Laffan, Pinho, Robinson and McMillan14) was originally designed for isotropic materials, mainly metals, and the determination of fracture toughness relies on the accuracy of the measured crack length. The new generation of high-strength fibre-reinforced composite materials presents some difficulty to the measurement of intralaminar fracture toughness, primarily for two reasons; (i) the specimen may develop damage, away from the crack tip, during loading, and (ii) a reliable visual measurement of the crack length cannot always be obtained.
To ensure the validity of the test, the basic requirement of the various proposed derivative testing methods for composite laminates, is that a crack can be made to propagate along the central cross-section of these cross-ply test samples(Reference Pinho, Robinson and Iannucci15,Reference Laffan, Pinho, Robinson, Iannucci and McMillan16) , fracturing fibres aligned longitudinally (i.e. parallel to the loading direction). While unidirectional composites exhibit excellent performance in tension, they are comparatively poorer in compression and shear. This may lead to unexpected failure prior to the desired crack growth, which presents a considerable challenge in the determination of ply-level tensile fracture toughness(Reference Laffan, Pinho, Robinson and Iannucci17). These include failure at the back edge of the specimen, at the lower and upper edges where they are in compression and bearing failure at the load introduction points. In the present work, an external fixture is developed, using computational analysis, to prevent the appearance of unexpected failure prior to crack growth in the CT specimens. Grooves on either side of the CT specimen were used with the twofold purpose of promoting the fracture propagation along the crack plane, and reducing the peak load, thus lowering the probability of invalid failure mechanisms.
Generally, the crack growth is optically monitored by a digital camera which assumes that fibre-dominated crack growth is synchronous with visible crack growth. However, even if high-quality optical devices are used, measuring the crack length presents several challenges: (i) the location of the crack tip is not impartially determined (except for the case when numerical algorithms are used for the determination of the crack tip(Reference Catalanotti, Camanho, Xavier, Dávila and Marchques4); (ii) the ‘visible’ crack tip does not correspond to the ‘true’ crack tip (because crack tips within each ply may be located at different positions or because the crack growth is not self-similar); and (iii) the high strength of the fibre promotes pull-out and splitting which affects the accurate location of the crack tip and consequently a reliable measurement of the crack length(Reference Underwood and Lloyd18).
It is worth mentioning that some methods do not require the direct measurement of the crack length, such as those based on the size-effect method where a series of specimens with the same aspect ratio but different planar dimensions are tested, and from which a resistance curve is subsequently constructed(Reference Catalanotti, Xavier and Camanho2,Reference Bergan and Dávila19) . Nevertheless, the direct measurement of the crack length represents a very important piece of information especially when dealing with long cracks developed in large composite structures for which the use of the size effect method(Reference Catalanotti, Xavier and Camanho20) would be prohibitive. Therefore, here, a new method, based on the fibre elongation and C-scan technique is proposed, for locating the crack tip. It is worth mentioning that, to the authors’ best knowledge, this is the first time that a C-scan system is used to determine the crack tip location, and that, differently from what has been done in(Reference Catalanotti, Camanho, Xavier, Dávila and Marchques4), the proposed methodology can also be effectively used in the presence of grooves. The determination of the fibre-dominated fracture toughness was achieved using the compliance calibration method and area method, for comparison. SEM investigation was carried out on the tensile fracture surface to gain insight into the damage mechanisms. Additionally, the measured toughness value was entered into a finite element model, with an in-house VUMAT composites damage subroutine for Abaqus/Explicit, to verify the applicability of experimental approach in the development of composite damage model.
2.0 MATERIALS AND METHODS
2.1 Specimen manufacturing
The material system used in this work is an IMS60/epoxy unidirectional carbon fibre/epoxy laminated composite. The specimens had a cross-ply symmetric lay-up ((90/0)s)4 and were manufactured using Resin Infusion under Flexible Tooling (RIFT) with flow media(Reference Williams, Summerscales and Grove21) (Fig. 1). During manufacturing, the preformed carbon fibres were placed on a rigid panel and sealed by a flexible vacuum bag. The air was pumped out from one side of the tooling and the vacuum-driven resin was drawn from the other side. Consequently, the resin filled in the tooling and infiltrated all fibres. A flow distribution medium was used on the upper and lower surfaces of the preform for complete wetting. To ensure good-quality specimens, all panels were subsequently inspected using a C-scan system to make sure the pristine specimens were free of any major defect. The resolution and scan frequency were set as 0.08 mm × 0.08 mm and 5 MHz, respectively. The mechanical properties of a single composite ply were measured using standard test methods and these are given in Table 1.
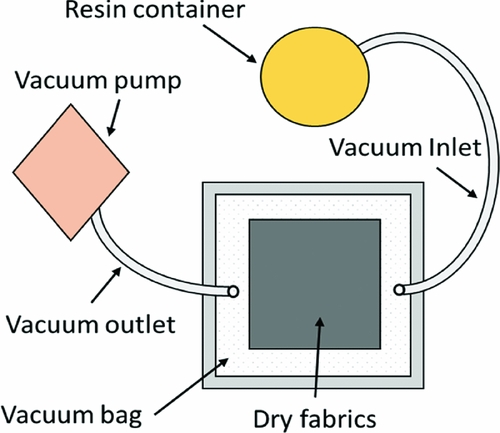
Figure 1. Schematic of RIFT system.
Table 1 Mechanical properties of IMS60/epoxy
A band saw and a 0.2-mm-thick razor saw were used to machine the profile of the specimen and introduce the pre-crack. The grooves were machined using a milling cutter along the pre-crack direction. The dimensions of the specimen are shown in Fig. 2, where 0° fibres are parallel to loading direction and 90° fibres at sample surface are parallel to the notch.
Figure 2. MCT specimen (all dimensions are in mm).
2.2 External fixture design
It is desired to restrict damage in the specimen to that associated with crack propagation, perpendicular to the loading direction and fracturing the longitudinal fibres in the process. Each specimen used in this work was manufactured from high-strength fibre which resulted in high compressive strain energies developing within the specimen leading to damage in the back-, upper-, and lower-side regions, and around the loading points (Fig. 3).
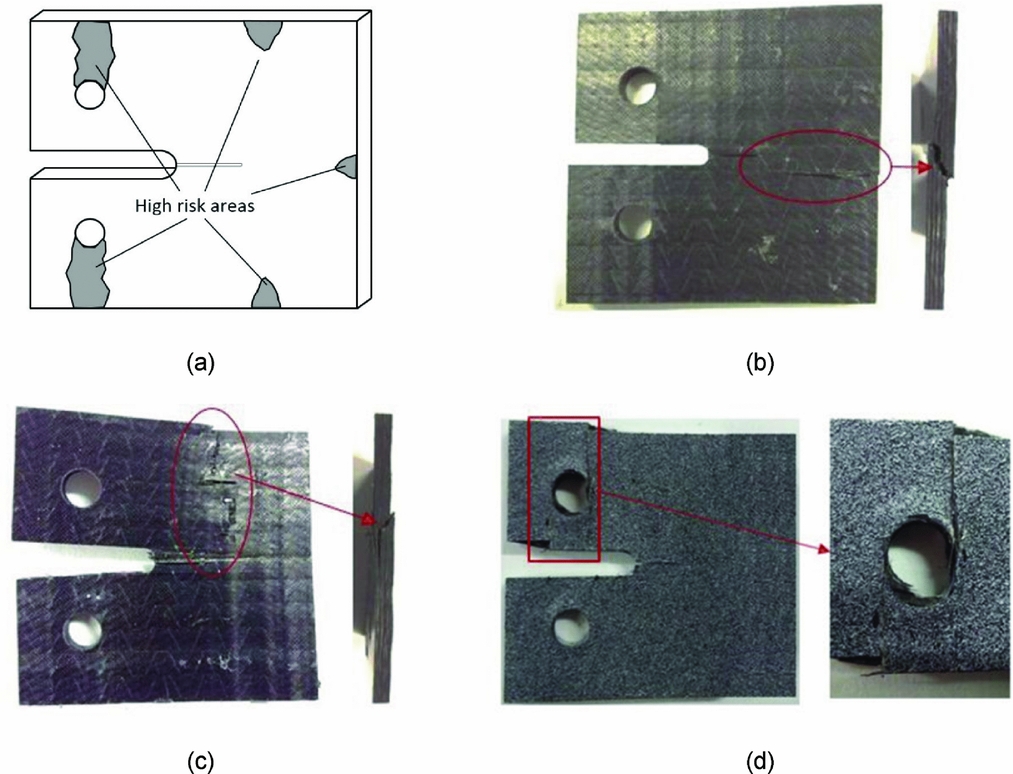
Figure 3. (a) High risk areas for premature damage of non-grooved specimen; images of compressive damage at (b) back end, (c) upper and lower side (d) load point.
In order to obtain the proper failure mode at the mid-section, an external fixture was developed, facilitated by computational analysis, to prevent damage at these susceptible regions, as shown in Fig. 4(a). The fixtures, which were made using high-quality carbon steel, consist of two attachment types, the first to prevent back-edge damage and the second to avoid upper- and lower-edge damage. A torque spanner was used to fix the external fixtures, and the torque was set as 5 MPa and 30 MPa for the first attachment type and second attachment type, respectively. Figures 4(b) and (c) show the exploded view of the specimen and fixture system. The bearing damage around the loading points was alleviated by machining the groove along the mid-section of the specimen, which reduced the area of the mid-section and increased the stress concentration.
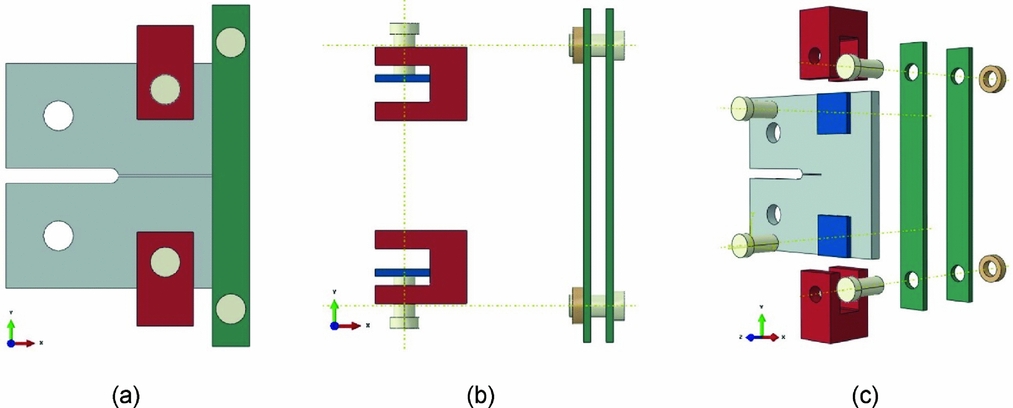
Figure 4. (a) Assembled fixtures and specimen, (b) external fixture items and (c) exploded view of specimen and fixtures.
2.3 Experimental set-up
MCT tests were carried out in a Hounsfield testing machine with a 50-kN load cell, under displacement control and at a loading rate of 1 mm/min. A digital camera was used to capture the location of the crack front. Figure 5(a) shows a schematic of the specimen and fixtures, and Fig. 5(b) shows the experimental set-up for the MCT tests.
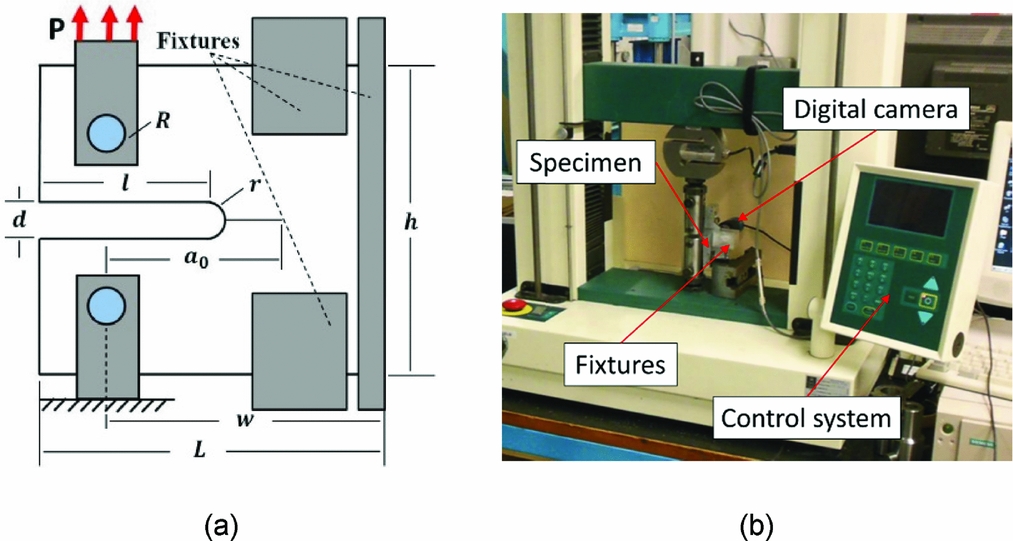
Figure 5. (a) Schematic of specimen and fixtures (b) experiment set-up for MCT tests.
3.0 DATA REDUCTION
The complicated failure modes presented by composite materials bring considerable challenges to the crack length measurement. Matrix cracking is usually followed by the formation of a process zone around and behind the crack tip, involving delamination and fibre bridging. Prior to fibre fracture, a critical primary crack length needs to be achieved. It has been shown that the fibre bridging zone, which is size dependent, will obtain a critical length, where the fracture toughness asymptotically approaches to a stable value(Reference Salvi, Waas and Caliskan22). Based on this, a suitable specimen dimension needs to be selected to ensure the critical length of the fibre bridging zone and the asymptotical fracture toughness value can be obtained.
In this work, the specimen configuration described in ASTM E339, which has been reported in a number of papers(Reference Catalanotti, Camanho, Xavier, Dávila and Marchques4,Reference Tan, Falzon, Price and Liu6,Reference Pinho, Robinson and Iannucci15) , was employed. Laffan et al(Reference Laffan, Pinho, Robinson and Iannucci23) investigated the size effect based on the ASTM E339 specimen configuration. Specimens with different scaling were used to conduct the compact tension tests. The results showed that fracture toughness values measured from the scaled specimens were very close to the control specimens, which demonstrated that the employed specimen configuration was already in the range of characteristic size.
The compliance calibration method was first used to conduct the data reduction. In this method, the critical strain energy release rate can be calculated using the change in compliance, C, with measured crack length,
 $$\begin{equation}
G_{Ic}^{{\rm{lam}}} = \frac{{P_c^2}}{{2t}}\frac{{dC}}{{da}},
\end{equation}$$
$$\begin{equation}
G_{Ic}^{{\rm{lam}}} = \frac{{P_c^2}}{{2t}}\frac{{dC}}{{da}},
\end{equation}$$
where Pc is the critical loading, at a given crack length, obtained from the load-displacement curve, C is compliance and a is the crack length. The experimental C versus a data was plotted and fitted with the function given by Equation (2),
 $$\begin{equation}
C = \alpha \;{\rm{exp}}\left( {\beta a} \right)
\end{equation}$$
$$\begin{equation}
C = \alpha \;{\rm{exp}}\left( {\beta a} \right)
\end{equation}$$
The values of α and β were calculated to best fit the experimental C versus a data. The critical strain energy release rate at each measured critical load is subsequently determined using
 $$\begin{equation}
G_{Ic}^{{\rm{lam}}} = \frac{{P_c^2}}{{2t}}\alpha \beta \;{\rm{exp}}\left( {\beta a} \right)
\end{equation}$$
$$\begin{equation}
G_{Ic}^{{\rm{lam}}} = \frac{{P_c^2}}{{2t}}\alpha \beta \;{\rm{exp}}\left( {\beta a} \right)
\end{equation}$$
For comparison, the area-method data-reduction scheme was also applied(Reference Laffan, Pinho, Robinson and Iannucci24). In this instance, the critical strain energy release rate was calculated using
 $$\begin{equation}
G_{Ic}^{{\rm{lam}}} = \ \frac{1}{{2t\Delta a}}\left( {{P_i}{d_{i + 1}} - {P_{i + 1}}{d_i}} \right),
\end{equation}$$
$$\begin{equation}
G_{Ic}^{{\rm{lam}}} = \ \frac{1}{{2t\Delta a}}\left( {{P_i}{d_{i + 1}} - {P_{i + 1}}{d_i}} \right),
\end{equation}$$
where the critical loads, Pi, and respective displacement, di, are defined in the load-displacement plot shown in Fig. 6. The shadow area indicates the energy dissipated in the creation of the corresponding fracture surface which was determined by the crack growth, Δa.
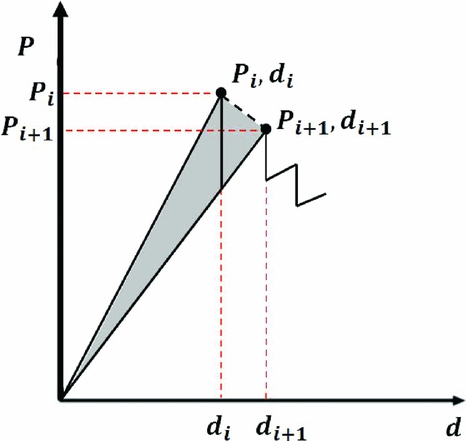
Figure 6. Area method for determining the fracture toughness.
Both data-reduction schemes require the measurement of crack length. Generally, the outermost layer of the CT specimen is a 90° ply which provides support to the 0° fibres being fractured perpendicular to the loading direction. The optically measured crack length, a vis, is usually observed as a matrix crack, i.e. as an intralaminar matrix crack in the outer 90° ply, on the reasonable assumption that the fibre breakage and matrix cracking are synchronous, i.e. the visible outer surface crack length, a vis, and extent of fibre breakage, defining the crack tip, can be assumed to be the same (a vis = a). However, this assumption is not applicable to high-strength fibre-reinforced composites. The reason is that high-strength fibre-reinforced composites present significant fibre bundle pull-out, which results in the fibre breakage ‘lagging’ behind the visible cracking as shown in Fig. 7(a). Visible surface matrix cracking, perpendicular to the loading direction, appeared during the initial (rising) phase of the load-displacement curve, which suggested that the fibres were within their elastic response and undamaged, while, the optically measured crack length was 3 mm. This implied that the fibre breakage and visible cracking were not synchronous, and the fibre breakage lagged behind the visible matrix surface cracking.
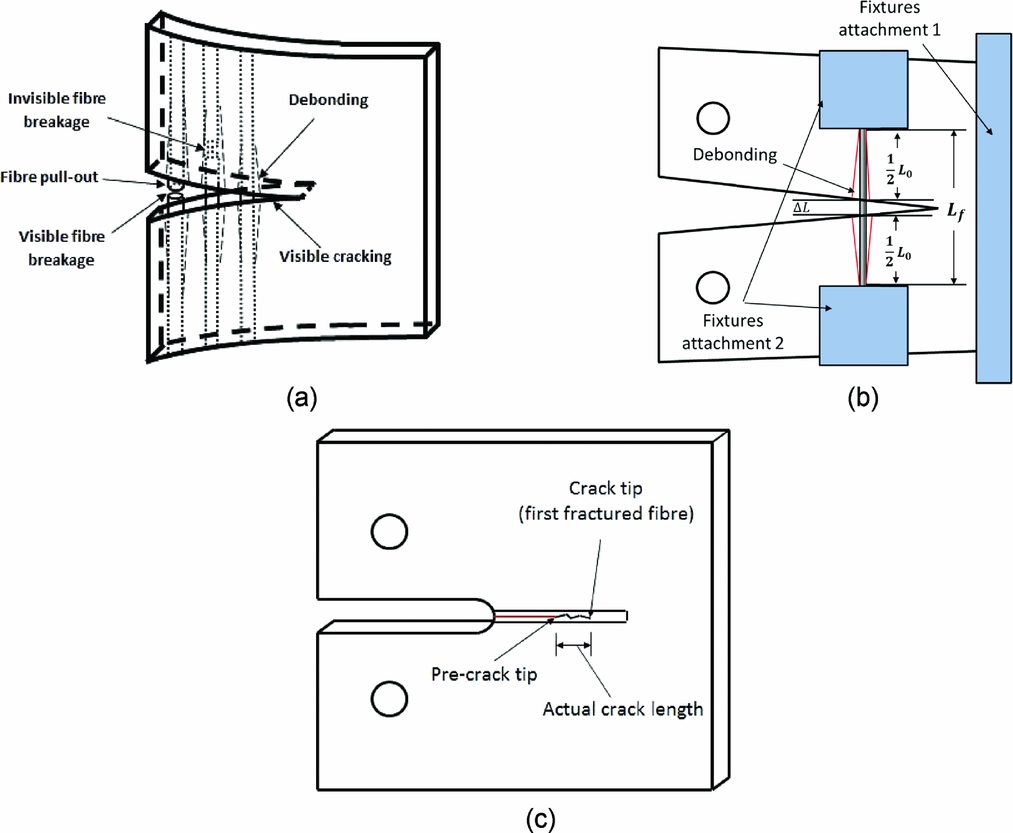
Figure 7. (a) Schematic of damage evolution, definition of (b) the localised linear strain and (c) the actual crack length.
If the visible crack length, a vis, is taken as the actual crack length, which should be the distance between the pre-crack tip and the first fractured fibre (Fig. 7(c)), the measured fracture toughness value will be lower than the actual value. In order to determine the fibre-dominated tensile intralaminar fracture toughness, it is necessary to measure the crack tip location accurately.
In this work, a novel but simple method for measuring the actual crack length in high-strength fibre-reinforced material was developed based on knowledge of the fibre strength and stiffness, and the C-scan technique. We define a localised linear strain, ε, as the ratio of extension, ΔL, to the initial length of a debonded fibre section, L 0, as shown in Fig. 7(b). Thus,
 $$\begin{equation}
\varepsilon = \Delta L/{L_0}
\end{equation}$$
$$\begin{equation}
\varepsilon = \Delta L/{L_0}
\end{equation}$$
When the tensile test was completed, and the load point was returned to zero, a C-scan system, shown in Fig. 8(a), was used to capture the debonded fibre region of the tested specimen. A typical debonded area of a tested MCT specimen is shown in Fig. 8(b), the height of the debonding area (marked area) in the C-scan map equals the initial length of the debonded fibre, L 0, where it is shown to be suppressed by the top and bottom fixtures, giving a well-defined debonded length to the fibres.
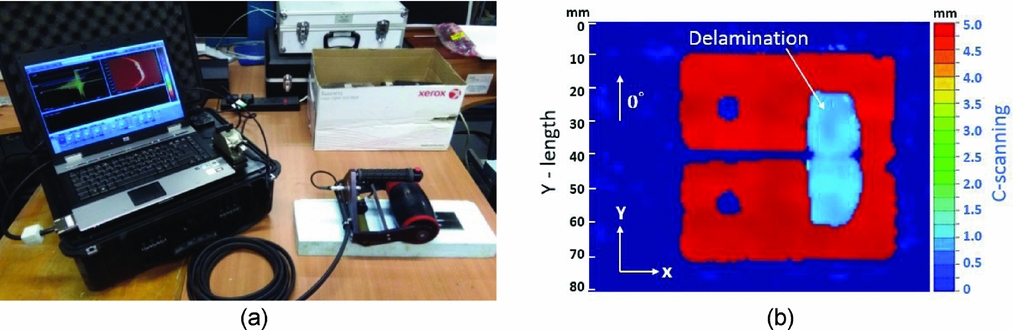
Figure 8. (a) C-scan system and (b) measured delaminated area.
Based on the measured initial length of the debonded fibre, δ, and the maximum failure strain (obtained from tensile coupon tests), the maximum elongation, at fracture, is therefore the product of the fibre tensile failure strain, εf, and the initial length of the debonded fibre,
 $$\begin{equation}
\Delta {L_{{\rm{max}}}} = {L_0}{\varepsilon _f}
\end{equation}$$
$$\begin{equation}
\Delta {L_{{\rm{max}}}} = {L_0}{\varepsilon _f}
\end{equation}$$
Once the maximum elongation, at the respective debonded region was determined, this value was used to compare with the visible crack width at the corresponding region which reflects the real-time fibre elongation. When the visible crack width was equivalent to the maximum elongation, the fibre in this region was deemed to have fractured, and this point was considered as the new crack tip. Finally, the crack length a was determined as the length from the loading point to this crack tip.
4.0 EXPERIMENTAL RESULTS
4.1 Tensile fracture toughness
In Fig. 8(b), the marked region represents the extent of the delaminated area, where the 0° fibres debonded during the MCT tests. It is known that fibre debonding and fibre pull-out preceded fibre breakage(Reference Pimenta and Pinho25, Reference Tan and Falzon26) and the debonded fibres, within the delaminated area, were stretched from their initial length to a maximum elongation along the loading (Y-) direction. The initial length of the stretched fibres is equal to the length of the delaminated area along the Y-direction, which was measured as 39 ± 1 mm. Based on coupon tensile tests, the fibre failure strain was measured at 1.9%, so the maximum elongation was determined to be 0.74 ± 0.02 mm. With reference to Fig. 9, when the opening length (height of visible crack) reached 0.74 mm, the fibres corresponding to this point were deemed to have fractured and the crack length, α, defined as AB. The measured compliance, based on the load-displacement curve, is shown in Fig. 10. Based on the experimental data obtained from three test samples, the fracture toughness values including initiation and propagation values were calculated using the above-mentioned techniques and shown in Fig. 11.
Figure 9. Determination of crack tip.
Figure 10. Compliance versus crack length.
Figure 11. Fracture toughness values obtained from (a) the area method and (b) the compliance calibration method.
The initiation value of fracture toughness was defined as the toughness value calculated at a data point corresponding to δa = 0, and the propagation value was defined as the average value of all toughness values obtained from data points for δa > 0. Based on the Fibre Elongation Tracking (FET) method, the initiation and propagation values of fracture toughness were measured and are shown in Table 2. For comparison, the initiation and propagation values of fracture toughness calculated according to the visible crack tracking (VCT) method are also presented in the same table.
Table 2 Comparison of initiation and propagation values of fracture toughness (kJ/m2)
4.2 Post-failure analysis
The visible damage on the fracture surface of a representative specimen is shown in Fig. 12(a), where fibre pull-out and fibre splitting are observed. In order to obtain further insight, a Scanning Electron Microscope (SEM) investigation was conducted on the fracture surface. In the SEM images (Fig. 12(b)), the fractured 0° plies present a highly non-uniform fracture morphology due to the existence of fractured fibre tows, which have been pulled out from the laminates. The matrix-dominated fractured 90° plies presented a relatively flat fracture surface. Interlaminar failure (delamination) was observed between the 0° ply and the 90° ply arising from sub-laminate pull-out confirmed through C-scan results.
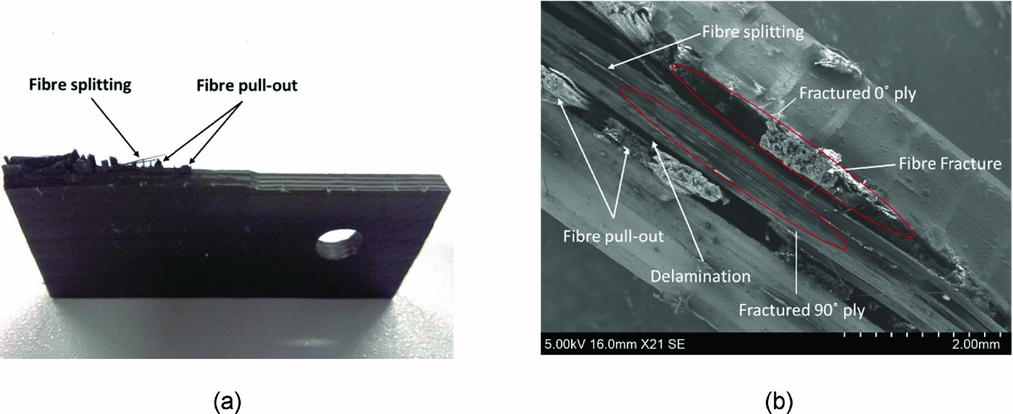
Figure 12. Images of (a) damaged specimen and (b) top view of the fracture surface obtained from a SEM examination.
5.0 NUMERICAL SIMULATIONS AND DISCUSSION
A Finite Element (FE) model of the MCT was created in Abaqus/Explicit(27-Reference Falzon, Liu and Tan32) to assess the accuracy of the measured fracture toughness(Reference Falzon and Apriluzzese33,Reference Falzon and Apriluzzese34) . The measured fracture toughness propagation values, using the aforementioned methods, were very similar. Consequently, selecting either value for the analysis gives almost identical results. For practicality, the value attained from the compliance calibration method, 774.9 ± 5.2% kJ/m2, was selected as the intralaminar fibre-dominated tensile fracture toughness value for the model verification. Other material properties for IMS 60 Carbon-fibre/Epoxy were obtained from a series of material characterisation tests using the test methods presented in Refs (35-Reference Schuecker and Davidson40). The interlaminar fracture energies (GIc and GIIc) were obtained using DCB and four-point ENF tests(Reference Zabala, Aretxabaleta, Castillo and Aurrekoetxea41). The Benzeggagh–Kenane (B-K) propagation criterion(Reference Benzeggagh and Kenane42) was used for the interlaminar fracture toughness under mixed-mode conditions,
 $$\begin{equation}
{G_c} = \ {G_{Ic}} + \ ({G_{IIc}} - {G_{Ic}}){B^\eta },
\end{equation}$$
$$\begin{equation}
{G_c} = \ {G_{Ic}} + \ ({G_{IIc}} - {G_{Ic}}){B^\eta },
\end{equation}$$
where Gc is the mixed-mode fracture toughness and B is the local mixed-mode ratio defined as B = GII/GI + GII. The mixed-mode interaction parameter, η, was determined from in-house experiments based on the ASTM D6671/D6671M-03(35) testing standard.
The intralaminar fracture toughness associated with fibre-dominated compressive failure (GIc|fc) was measured from Compact Compression (CC) tests. The standard V-notched Rail Shear (VRS) testing method was used to obtain the non-linear shear coefficients(Reference Liang, Wang and Xuesen43,44) , and the material response under pure shear loading was modelled using
 $$\begin{equation}
\tau \left( {{\gamma _{ij}}} \right) = {c_1}\left[ {{\rm{exp}}\left( {{c_2}{\gamma _{ij}}} \right) - {\rm{exp}}\left( {{c_3}{\gamma _{ij}}} \right)} \right],
\end{equation}$$
$$\begin{equation}
\tau \left( {{\gamma _{ij}}} \right) = {c_1}\left[ {{\rm{exp}}\left( {{c_2}{\gamma _{ij}}} \right) - {\rm{exp}}\left( {{c_3}{\gamma _{ij}}} \right)} \right],
\end{equation}$$
where ci (i = 1, 2, 3) are the respective coefficients, and γij (i, j = n, s, t, i ≠ j) are the shear strains.
The material properties required for the numerical simulation are shown in Table 3.
Table 3 Material properties for IMS60 carbon-fibre/epoxy
The finite element model was developed in Abaqus 6.12. In the virtual test, the loading speed was fixed at 0.5 m/s, to reduce computation time whilst ensuring that the quality of the simulation was not affected by inertial effects. An enhanced stiffness-based hourglass and distortion control were employed to suppress spurious energy modes. The crack front in the FE model (shown in Fig. 13(a)) was meshed with 0.4 mm × 0.2 mm C3D8R elements with two elements through the thickness of each ply of the laminate. The built-in surface-based cohesive behaviour in Abaqus/Explicit was used to capture delamination in composite structures(Reference Shi and Soutis45). The interlaminar damage initiation was governed by a quadratic traction criterion, which was defined by the interlaminar stresses, τi (i = n, s , t), and corresponding maximum stresses, τ0i (i = n, s, t),
 $$\begin{equation}
{\left( {\frac{{{\tau _s}}}{{\tau _s^0}}} \right)^2} + {\left( {\frac{{{\tau _t}}}{{\tau _t^0}}} \right)^2} + {\left( {\frac{{\left\langle {{\tau _n}} \right\rangle }}{{\tau _n^0}}} \right)^2} \le 1
\end{equation}$$
$$\begin{equation}
{\left( {\frac{{{\tau _s}}}{{\tau _s^0}}} \right)^2} + {\left( {\frac{{{\tau _t}}}{{\tau _t^0}}} \right)^2} + {\left( {\frac{{\left\langle {{\tau _n}} \right\rangle }}{{\tau _n^0}}} \right)^2} \le 1
\end{equation}$$
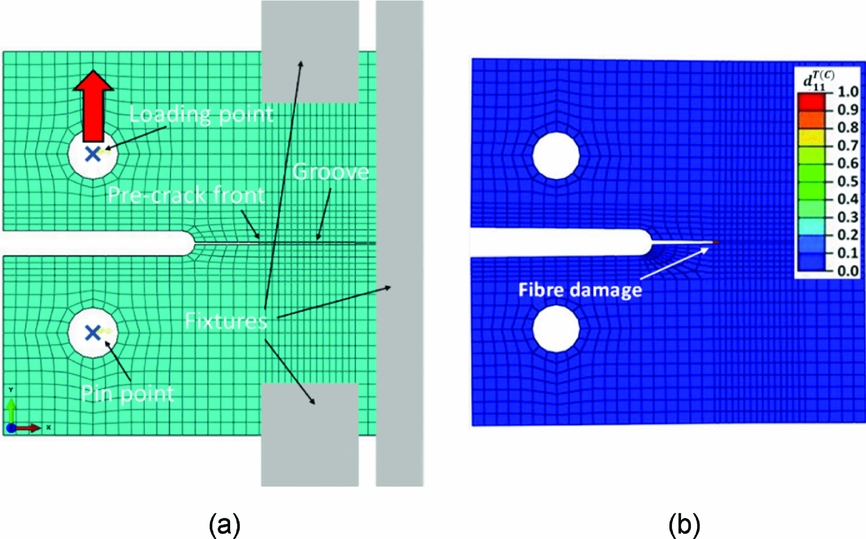
Figure 13. (a) Finite element model and (b) fibre damage in the 0° ply.
The general contact algorithm was used to simulate the global contact of the model. A friction coefficient of 0.25, measured from physical tests(Reference Tan and Falzon26), was employed for the ply-to-ply contact in this computational model.
The failure modes including fibre damage, matrix damage and delamination were observed in the tested composite laminates (Fig. 12(b)). The corresponding virtual tests (Fig. 13(a)) were conducted using the developed damage model in Abaqus/Explicit. Failure types such as fibre fracture, matrix cracking and delamination were also represented in the numerical simulation. Due to the large amount of fibre pull-out, it is very difficult to observe the fibre damage during the test, which was masked by the outer 90° plies. Figure 13(b) shows the fibre damage obtained from the simulation. As expected, crack propagation was observed along the mid-section of the virtual MCT specimen; moreover, it was noted that the damaged elements were distributed in the vicinity of the crack front, and that other collateral dissipative phenomena (in the loading introduction points or at the back end of the specimen) did not occur.
Figure 14(a) shows matrix damage which occurred within the non-linear region prior to peak load. Extensive fibre pull-out (to the extent that it could be considered as sub-laminate pull-out) prior to fibre fracture yielded the observed non-linearity. Figure 14(b) shows the matrix damage obtained from the virtual test. In this figure, some failed elements can be observed in the vicinity of the crack front, which corresponded to experimental results.
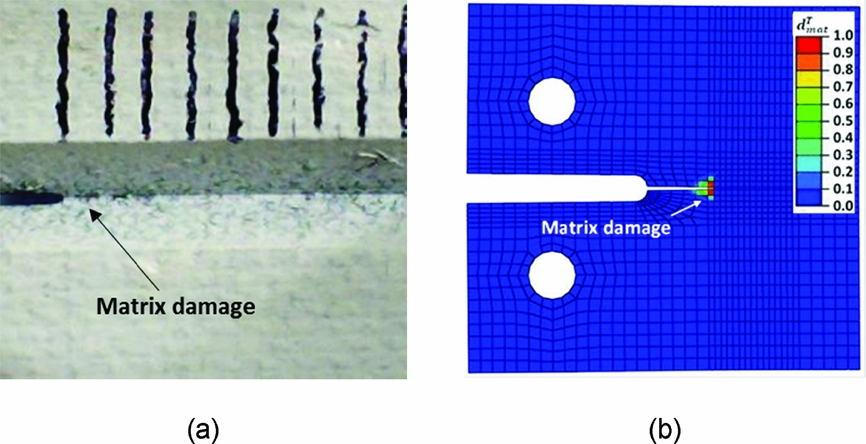
Figure 14. Matrix damage in the 90° ply obtained from (a) experiment and (b) simulation.
Figure 15(a) shows a typical damage map obtained from a C-scan examination, where the highlighted blue region indicates sub-laminate delamination. Figure 15(b) presents the delamination area obtained from the virtual MCT test. The comparison between experimental and numerical results shows that the physically measured interlaminar damage was well reproduced using the proposed computational model.
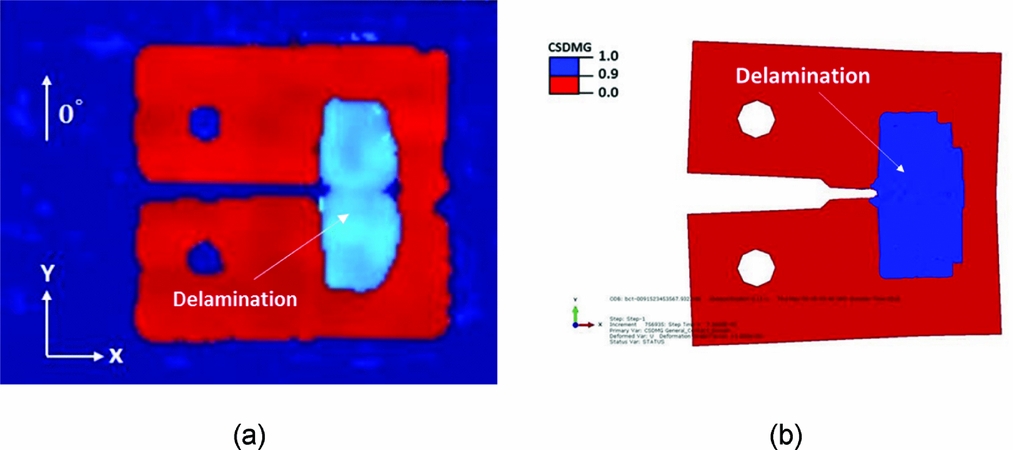
Figure 15. Comparison of delamination maps obtained from (a) C-scan measurement and (b) the numerical simulation.
In this damage model, the failure index, d T/C11 ∈ [0, 1], was employed to evaluate the fibre-dominated tensile/compressive damage in a composite ply. The calculation of d T/C11 is given by:
 $$\begin{equation}
d_{11}^{T/C} = \frac{{\varepsilon _{11}^{FT/FC}}}{{\varepsilon _{11}^{FT/FC} - \varepsilon _{11}^{T/C}}}\left( {1 - \frac{{\varepsilon _{11}^{OT/OC}}}{{\varepsilon _{11}^{T/C}}}} \right),
\end{equation}$$
$$\begin{equation}
d_{11}^{T/C} = \frac{{\varepsilon _{11}^{FT/FC}}}{{\varepsilon _{11}^{FT/FC} - \varepsilon _{11}^{T/C}}}\left( {1 - \frac{{\varepsilon _{11}^{OT/OC}}}{{\varepsilon _{11}^{T/C}}}} \right),
\end{equation}$$
where the ply-level initiation tensile/compressive strain, εOT/OC11, at which damage initiation occurs, was determined from the material tensile/compressive strength. εFT/FC11 and εT/C11 are the ply-level tensile/compressive failure strain and current tensile/compressive strain, respectively.
As shown in Fig. 16(a), the load versus displacement curve obtained from the simulation using the FET-based fracture toughness value, 774.9 ± 5.2% kJ/m2, was compared with experimental results. The damage propagation, which is governed by the fracture toughness, was captured well by the finite element model, which means the measured tensile fracture toughness is able to endow the finite element model with the capability to predict tensile damage in composite laminates. Very good agreement was attained between numerical and experimental results, which established the reliability of the presented test method for measuring tensile fracture toughness. In order to present the importance of accurate fracture toughness in this damage model, the fracture toughness value, 498.5 ± 6.4% kJ/mm2, calculated according to the visible crack tracking (VCT) method was also used to conduct a comparative virtual MCT test. The load-displacement curve resulting from the simulation using a VCT-based fracture toughness value is also shown as in Fig. 16(a). Compared to the physical tests, the damage model using the VCT-based fracture toughness delivered a lower load in the damage propagation region. The accuracy of fracture toughness can significantly influence the predictive capability of the damage model.
Figure 16. (a) Comparison of load versus displacement curves and (b) the details of energy dissipation (dash lines) obtained from simulation.
In the energy dissipation curves (dash lines), which are given in Fig. 16(b), it was found that interlaminar and intralaminar energy started to dissipate when the non-linear response appeared (around a displacement of 1 mm). As mentioned above, matrix cracking and fibre pull-out were observed in the non-linear region. Matrix damage contributed to the intralaminar energy dissipation, and fibre pull-out, contributed to interlaminar energy dissipation. With the increasing loading response, the matrix damage and fibre pull-out kept evolving, indicated by the increasing interlaminar and intralaminar energy dissipation from displacement = 1 mm to displacement = 2.2 mm in Fig. 16(b). It was also found that the intralaminar damage, which is dominated by fibre damage, dissipated 3.4-J energy in the virtual MCT test. Interlaminar damage (delamination), which consumed 1.1-J energy, also made a considerable contribution to the energy dissipation.
6.0 CONCLUSIONS
In this work, an external fixture was designed, guided by computational analysis, to mitigate the risk of damage in Compact Tension (CT) specimen regions remote from the desired crack path. The accurate crack lengths, at corresponding critical loads, were determined using a novel crack length measuring methodology which combined fibre elongation information obtained with the assistance of a C-scan system. Following physical testing, Scanning Electron Microscope (SEM) investigation was performed on the tensile fracture surface, where fibre debonding and pull-out were observed. Two different data-reduction schemes, the area method and compliance calibration method, were used to assess the accuracy of the tensile fracture toughness values of an IMS60/Epoxy composite ply. The propagation values of toughness calculated by both data reduction methods were very similar. Fibre-Elongation-Tracking (FET)-based fracture toughness and Visible-Crack-Tracking (VCT)-based fracture toughness values were used to conduct virtual Modified Compact Tension (MCT) tests in Abaqus/Explicit. A comparison of load versus displacement curves demonstrated that the damage model using the FET-based fracture toughness yields better correlation with experimental tests. This confirmed the capability of the proposed measurement method to deliver accurate fracture toughness.
ACKNOWLEDGEMENTS
The corresponding author would like to acknowledge the financial support of Bombardier and the Royal Academy of Engineering. The authors are also indebted to Mr Dave Thompson from the Northern Ireland Advanced Composites and Engineering Centre (NIACE) for his discussions and suggestions.


