NOMENCLATURE
 $C_1$
$C_1$inlet absolute velocity
- $C_2$
outlet absolute velocity
- $C_u$
circumferential component of absolute velocity
- $\bar{H}$
load coefficient
- k
adiabatic index
- $L_u$
rim work
- n
rotating speed
- R
gas constant
- $T_1^*$
inlet total temperature
- u
rotor circumferential velocity
- $W_1$
inlet relative velocity
- $W_2$
outlet relative velocity
- $W_u$
circumferential component of relative velocity


Greek symbols
- $\eta_k^*$
isentropic efficiency
- $\pi_k^*$
total pressure ratio


1.0 INTRODUCTION
The larger the bypass ratio of a turbofan engine, the lower the exhaust velocity and the lower the exhaust noise; the larger the bypass ratio, the lower the fan pressure ratio, the fan rotating speed and the fan noise. Moreover, the larger the bypass ratio, the higher the propulsion efficiency and the lower the specific fuel consumption(Reference Dewanji, Rao and van Buijtenen1,Reference Kurzke2,Reference Kestner, Schutte, Gladin and Mavris3,Reference Huff4) . Therefore, the bypass ratio of a civil turbofan engine increases continually. However, with such increase of the bypass ratio, the rotating speed of the fan decreases, and the stage pressure ratios of the coaxial booster and low pressure turbine decrease; as the stage numbers of both the booster and low-pressure turbine increase, the volume and weight of the engine also increase. For a geared turbofan engine, a reduction gear is installed between the fan and booster to achieve a low rotating speed of the fan but a high rotating speed of the booster and low-pressure turbine, thereby increasing the engines bypass ratio without increasing the engines volume and weight. The bypass ratio for a geared turbofan can reach a value of 17, while that of a direct drive turbofan cannot exceed a value of 10(Reference Riegler and Bichlmaier5).
For a high bypass ratio turbofan engine, the fan speed can be reduced by increasing the stage load for given total pressure ratio. It is easy to reduce the rotating speed of a geared fan with a high bypass ratio by increasing the gears reduction ratio without changing the original structure of the turbofan engine. Because the fan rotor noise is proportional to the fourth power of the blade tip speed(Reference Riegler and Bichlmaier5,Reference Maozhang and Jiebao6) , the noise can be reduced significantly by reducing the rotating speed of the rotor. Moreover, such reduction of the rotating speed relaxes the demands in terms of structural strength; thus, lightweight rotor blades can be designed to reduce the weight of the overall engine. Regarding a geared turbofan engine, due to the high bypass ratio, low exhaust velocity and relatively low exhaust noise, the contribution of the fan to the total engine noise increases(Reference Envia7,Reference Hall and Crichton8) . Therefore, a reduction in the fan noise can significantly reduce the overall engine noise. DLR in Germany, SNECMA in France, COMOTI in Romania and so forth have set up a test-bed for geared fans with a super bypass ratio funded by the European Significantly Lower Community Exposure to Aircraft Noise (SILENCER) research project. Based on the understanding that reducing the fan speed is an effective way to reduce the noise, they tried to reduce the fan design speed by 10% compared with the advanced design level at that time(Reference Burak, Eberhard and Christian9). Rolls-Royce plc and Cambridge University jointly set up a project called RESOUND to study fan noise reduction methods. One of the research projects is to explore reducing the fan speed to reduce the fan noise. In this project, taking the typical design fan at that time as the prototype and keeping the aerodynamic performance parameters such as the total pressure ratio and flow rate close to those of the prototype, the fan was redesigned by reducing the design speed by 15%. The experimental results showed that the prototype produced single-tone noise when the fan speed was more than 80% of the design speed, while the single tones of the redesigned low-speed fan were cut-off at the speed corresponding to the same aerodynamic performance index as the prototype. Therefore, the tone noise of the low-speed fan was reduced by 5–10db, but broadband noise reduction was not observed in the redesigned low-speed fan(Reference Bewick, Adams and Schwaller10).
However, according to the expression for the load coefficient  $\bar{H}$ in Equation (1), for a given total pressure ratio
  $\pi^*_k$, when the rotor circumferential velocity u decreases, the load coefficient
  $\bar{H}$ increases and the diffusion of the blade passage increases. Ordinarily, this will result in a decrease in the fan efficiency and stability margin(Reference Dickens and Day11). Regarding the current design level, approximately
  $0.40$ may be considered a high value for the load coefficient; further increases in the load coefficient will require the use of boundary-layer control technology (such as boundary-layer suction)(Reference Merchant, Kerrebrock, Adamczyk and Braunscheidel12–Reference Svorcan, Stupar and Trivkovic15).
 \begin{equation}\bar{H} = \frac{L_u}{u^2} = \frac{\frac{k}{k-1}RT^*_1 \left( {\pi_k^*}^{\frac{k-1}{k}} -1 \right)/ \eta^*_k}{u^2}.\end{equation}
In our patent(Reference Zhenggui, Jinhuan and Cui16), a new concept for diffusion blade profiles, with characteristics of large camber and low flow losses, was proposed. The rotor blades in a high bypass fan were designed by using such profiles, achieving a large reduction in the rotating speed with high aerodynamic efficiency(Reference Jinhuan, Zhenggui, Wenqiang and Yuzhen17). Based on research into the aerodynamic design method for ultra-highly loaded rotors in Ref.(Reference Jinhuan, Zhenggui, Wenqiang and Yuzhen17), this paper further performs an aerodynamic design for an ultra-highly loaded rotor and matching stator to examine the applicability of the rotor, and compares the ultra-highly loaded fan stage with a normally loaded fan stage (which is also designed in this paper) to examine its aerodynamic characteristics. The results show that the ultra-highly loaded design method for the fan rotor is promising to achieve a great reduction in the wheel speed of geared fans with high bypass ratio.
2.0 BRIEF DESCRIPTION OF THE AERODYNAMIC DESIGN METHOD FOR THE ROTORS AND STATORS
In this paper, a Two-Dimensional (2D) design method for the S1/S2 flow surfaces was used for the aerodynamic design of ultra-highly and normally loaded fan rotors and matching stators. The design procedure was as follows: (1) According to a given mass flow rate, total pressure ratio and its distribution along the blade height and flow angle at the stator outlet (equal to zero in the axial direction), the flow parameters at the inlet and outlet of the rotor and stator were determined by using the S2 through-flow design method; (2) Several blade profiles in the S1 surfaces were designed based on these flow parameters. (3) Three-Dimensional (3D) blades were formed by stacking the profiles in the radial direction, and the aerodynamic performance of the rotor and stator was analysed by using a 3D flow field simulation method. The main difference in the design method between the ultra-highly and normally loaded fans was that, in the ultra-highly loaded design, profiles with large camber and low flow losses were used to greatly improve the rotors ability to perform work and thereby greatly reduce the rotating speed under given total pressure ratio. Detailed descriptions of the aerodynamic design method and the new concept of the profiles can be seen in Ref.Reference Svorcan, Stupar and Trivkovic17.
3.0 NUMERICAL METHOD AND VALIDATION
The commercial software NUMECA was applied to simulate the 3D flow fields of the fans. For the flow field simulations, the main terms selected were a 3D Reynolds Navier–Stokes equation method with a central spatial difference scheme, the Spalart–Allmaras turbulence models (for the control equation closure) and the mixing plane (for the interface between the rotor and stator). The blade tip clearance was set at 0.5mm for both rotors, a value of 0.00075 relative to the blade height, whereas no clearance was set for the stator blades. The 3D grids were constructed using the AUTOGRID5 module in the NUMECA software.
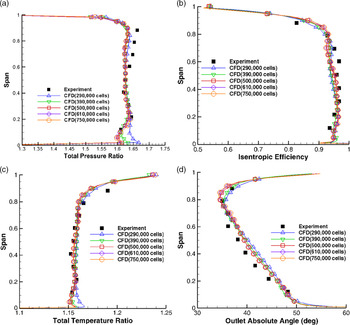
To validate the numerical method and inspect its grid independence, flow fields for the NASA fan rotor 67(Reference Strazisar and Powell18) were simulated, and the calculated results were compared with experimental results. Grid cells were distributed in the flow fields as follows: The number of nodes was 57 in the tangential direction, 109 in the axial direction and 73 in the radial direction (including 17 nodes within the blade tip clearance), constructing a grid with a total of about 500,000 cells. The other grids were constructed according to the same proportions as the above grid. Table 1 presents the characteristic parameters of the NASA fan rotor 67 at 100% of the design speed. The choking mass flow was measured as 34.96kg/s using a calibrated orifice, while the numerical value was 34.57kg/s, a difference of 1.1%. In Fig. 1, the isentropic efficiencies and total pressure ratios are plotted against the nondimensional mass flow rate, normalized by the numerical and experimental mass flow rates at their own choking condition, respectively. In the experiment, the total pressure ratio and efficiency were obtained as the mass flow weighted average at nine radial measurement positions(Reference Strazisar and Powell18), and the numerical total pressure ratio and efficiency in Fig. 1 are determined by the same method as in the experiment. From Fig. 1, the number of grid cells influences the surge margin evidently if it is smaller than 500,000 but has negligible effects on performance parameters (total pressure ratio, isentropic efficiency and mass flow rate) within the normal working range. From the distributions of the total pressure ratio, isentropic efficiency, total temperature ratio and outlet absolute angle along the span at the design point (Fig. 2), it can be seen that the total pressure ratio near the hub is over-predicted if the number of the grid cells is smaller than 500,000. In Fig. 3, for 500,000 grid cells, at the design point the calculated Mach contours in S1 surfaces coincide well with the experimental results.
Table 1 Characteristic parameters of NASA fan rotor 67 at 100% of design speed


Figure 1. Performance of NASA fan rotor 67. (a) Total pressure ratio. (b) Isentropic efficiency.

Figure 2. Distributions of the aerodynamic parameters along span. (a) Distribution of total pressure ratio along the Span. (b) Distribution of efficiency along the Span. (c) Distribution of total temperature ratio along the Span. (d) Distribution of outlet absolute angle along the Span.

Figure 3. Mach contours on S1 surfaces. (a) 30%span. (b) 70%span. (a) 90%span.
From the investigation described above, the grid number was set at approximately 500,000 in the rotor passage and 300,000 in the stator blade passage (with no blade tip clearance), in simulations of the flow fields in the fan stages in this paper. To further inspect the grid independence of the fan in this paper, grids with 320,000, 500,000, 700,000, 860,000 and 1,090,000 cells were constructed and the corresponding flow fields simulated. The grid independence check of the normally loaded fan is shown in Fig. 4, in which the mass flow rate is normalized by the design mass flow rate. From Fig. 4, the number of grid cells influences the surge margin evidently if it is smaller than 700,000. Therefore, grids with about 700,000 cells were generated for the flow field simulations of the high bypass fans in this paper.

Figure 4. Grid independence check of high bypass ratio fan. (a) Total pressure ratio. (b) Isentropic efficiency.
4.0 COMPARISON OF AERODYNAMIC CHARACTERISTICS BETWEEN ULTRA-HIGHLY AND NORMALLY LOADED FAN STAGES
The load coefficient selected in the conventional design is usually not more than 0.4, so the load coefficient of 0.3 is a normal design. The following is a comparative analysis of the aerodynamic performance and flow characteristics of the two fan stages with a normal load coefficient of 0.3 and an ultra-highly load coefficient of 0.88.
4.1 Comparison of aerodynamic performance parameters
In Table 2, the load coefficient, wheel speed and mass flow rate at the design point were given; the other parameters were the aerodynamic parameters of the designed fans calculated using the above numerical method. The designated total pressure ratios of the two fan stages at the design point were all 1.35. The differences between the designated and designed total pressure ratios could be reduced through design refinements, such as slightly reducing the blade camber of the normally loaded rotor to reduce the rotor total pressure ratio (of course, modifying its matching stator blades correspondingly). Refined designs were not created because the differences were small and the work required to reduce the differences was large.
Table 2 Performance parameters of normally and ultra-highly loaded fans

For two fan rotors with the same total pressure ratio  $\pi^*_k$, Equation (2) can be deduced from Equation (1).
 \begin{equation}\frac{n_1}{n_2} = \sqrt{\frac{\bar{H}_2}{\bar{H}_1}}\end{equation}
Namely, the rotor rotating speed n is inversely proportional to  $\sqrt{\bar{H}}$ under the same total pressure ratio. In this paper, the normal and ultra-high load coefficients were 0.3 and 0.88, respectively, and the wheel speed of the ultra-highly loaded rotor was
  $\sqrt{\frac{0.3}{0.88}}=0.58$ times that of the normally loaded rotor (the specific values of the two rotors are shown in Table 2). From Table 2, it can also be seen that the efficiency of the ultra-highly loaded rotor at the design point was higher than that of the normally loaded rotor, but the total pressure recovery coefficient of the former was slightly lower than that of the latter; thus, the efficiency of the ultra-highly loaded fan stage was higher than that of the normally loaded fan stage. Moreover, the surge margin of the former was evidently larger than that of the latter.
Figures 5–8. show the radial distributions of the circumferential average parameters at the rotor outlet. These figures show the change trend of the key aerodynamic parameters of the fan rotor with the load coefficient and the differences of the key aerodynamic parameter values between the rotors with the ultra-high load coefficient and the normal load coefficient.

Figure 5. Distributions of relative flow angles at rotor outlet.

Figure 6. Distributions of diffusion factors at rotor outlet.

Figure 7. Distributions of absolute Mach numbers at rotor outlet.

Figure 8. Distributions of absolute flow angles at rotor outlet.
Figure 5 shows the distributions of the relative flow angles (the angles between the relative velocity and axial direction) at the rotor outlet along the blade spans. From Fig. 5, the relative flow angles of the normally and ultra-highly loaded rotors were nearly unchanged along the blade spans; the angle of the former was approximately  $20^{\circ}$, while that of the latter was approximately
  $-20^{\circ}$. The fundamental cascades of the two rotors are depicted in Fig. 9. Compared with the normally loaded cascade, the profile camber in the ultra-highly loaded cascade was much larger and its ability to do work on the flow passing through the cascade was stronger; the rear part of the cascade was convergent, controlling the development of the boundary layers on the blade surfaces and reducing flow losses.

Figure 9. Fundamental cascades of the rotors. (a) normally loaded. (b) ultra-highly loaded.
In Fig. 6, the variation of the diffusion factor with the load coefficient  $\bar{H}$ is explained as follows: In the figure, the fan rotor with a load coefficient of
  $\bar{H}=0.3$ was designed with an equal diffusion factor along the blade height. As shown in Fig. 13(a), for a normally loaded rotor with a load coefficient of
  $\bar{H}=0.3$, the geometric outlet angle at the blade hub is close to
  $0^{\circ}$ (the angle between the relative velocity and axial direction), which increases with radius. With the increase of the load and the decrease of the rim speed, the blade camber increases and the geometric outlet angle decreases. At the blade hub, with the increase of the load, the geometry outlet angle becomes negative and the rear part of the flow channel becomes convergent. Therefore, at the blade hub, as the load increases, the convergence of the rear part increases and the diffusion factor decreases. Due to the larger geometric outlet angle at the blade tip for the normally loaded rotor with a load coefficient of
  $\bar{H}=0.3$ (see Fig. 13(e)), the expansion of the rear part of the flow channel at the blade tip increases and the diffusion factor increases at the initial stage of the load increase; when the load increases until the geometric outlet angle is zero, the load increases further, the geometric outlet angle becomes negative, the rear part becomes a convergent flow channel and the degree of convergence increases, and the diffusion factor decreases with the increase of the load (the same as at the hub).
From Fig. 6, when the load coefficient  $\bar{H}$ is larger than 0.3, the diffusion factor along most of the blade span decreases as the load coefficient
  $\bar{H}$ increases, due to an increase in the degree of convergence of the passage in the blade rear part. Therefore, from the point of view of the aerodynamic design of the rotor, increasing the load coefficient can reduce not only the rotor rotating speed but also the flow losses. However, the absolute Mach number and flow angle at the rotor outlet increase as the load coefficient increases (Figs 7 and 8), which causes an increase in difficulty of the aerodynamic design of the matching stator. To consider the aerodynamic designs of the rotor and stator in a balanced way, the load coefficient of the ultra-highly loaded rotor was set to 0.88.

Figure 10. Two fan stages in meridian plane. (a) normally loaded. (b) ultra-highly loaded.

Figure 11. Performance of the two fan stages. (a) Isentropic efficiency. (b) Total pressure ratio.

Figure 12. Fundamental velocity triangles. (a) the normally loaded rotor. (b) the ultra-highly loaded rotor.

Figure 13. Mach number contours on S1 surfaces. (a) at 10% span of the normally loaded rotor. (b) at 10% span of the ultra-highly loaded rotor. (c) at 50% span of the normally loaded rotor. (d) at 50% span of the ultra-highly loaded rotor. (e) at 90% span of the normally loaded rotor. at 90% span of the normally loaded rotor (f) at 90% span of the ultra-highly loaded rotor.

Figure 14. Pressure distributions on rotor blade surfaces. (a) at 10% span of the normally loaded rotor. (b) at 10% span of the ultra-highly loaded rotor. (c) at 50% span of the normally loaded rotor. (d) at 50% span of the ultra-highly loaded rotor. (e) at 90% span of the normally loaded rotor. (f) at 90% span of the ultra-highly loaded rotor.

Figure 15. Entropy contours and streamlines in rotor blade passages. (a) the normally loaded rotor. (b) the ultra-highly loaded rotor.

Figure 16. Mach number contours on S1 surfaces near surge point. (a) at 50% span of the normally loaded rotor. (b) at 90% span of the normally loaded rotor. (c) at 50% span of the ultra-highly loaded rotor. (d) at 90% span of the ultra-highly loaded rotor.
This paper focuses on a comparison of the fundamental aerodynamics in the two fan stages. Therefore, the stators were not divided by splitter lips to form inner and outer flows; moreover, the lean and sweep of the blades were not included when considering the three-dimensionality of the flows. The two fan stages in the meridian plane are shown in Fig. 10. In Fig. 10(b), the forward sweep of the rotor blade tip and backward sweep of the stator blade tip only involved a reasonable axial clearance between the rotor and stator in the ultra-highly loaded fan stage.
From Fig. 11, at the design wheel speed, the work range of the mass flow rate of the ultra-highly loaded fan stage was significantly larger than that of the normally loaded fan stage; the efficiency of the former was also higher than that of the latter. From Fig. 11(b), as the mass flow rate decreases, the total pressure ratio of the ultra-highly loaded fan stage decreases remarkably, which can be explained as follows: Figure 12 shows the fundamental velocity triangle of the normally loaded rotor and ultra-highly loaded rotor for comparison. From Fig. 12(b), it can be seen that, as the mass flow rate decreases, the outlet absolute velocity decreases, namely  $C_{2u}$ becomes
  $C_{2u}''$, the twist speed
  $\Delta C_{u}(=C_{2u})$ decreases and u is constant for a constant wheel speed; thus, the specific work
  $L_{u}$ in equation
  $L_{u}=u\Delta C_{u}$ decreases and therefore the total pressure ratio decreases. However, from Fig. 12(a), the specific work
  $L_{u}$ of the normally loaded rotor increases as the mass flow rate decreases.
4.2 Comparison of flow characteristics at design point between normally and ultra-highly loaded fan stages
The Mach number contours on the S1 surfaces of the rotors and stators are shown in Fig. 13. As shown, due to the low wheel speed, the inlet relative Mach number of the ultra-highly loaded rotor was lower than that of the normally loaded rotor; moreover, the Mach number was subsonic at the blade tip of the former, while it was supersonic at the blade tip of the latter (Fig. 13(e)). The supersonic flow caused a local shock wave, which increased flow losses and aerodynamic noise. In the ultra-highly loaded rotor, due to the low inlet Mach number and convergence in the rear parts of the blade passages, the thickness of the boundary layers on the rotor blade surfaces and size of the rotor blade wakes were smaller than those in the normally loaded rotor. Although the stator camber of the ultra-highly loaded fan was relatively large and the absolute velocity at the stator inlet was relatively high, the thickness of the boundary layers on the stator blade surfaces and size of the stator blade wakes were reasonable and not obviously larger than those of the stator of the normally loaded fan. From Fig. 14, in the normally loaded rotor, the load in the front part of the rotor blade was larger than that in the rear part for high flow speed in the front passage and low flow speed in the rear passage; however, in the ultra-highly loaded rotor, convergence occurred in the blade rear passage accelerating flow and the load in the rear part of the rotor blade was increased. From Fig. 15, in the blade tip region, the entropy increase of the normally loaded rotor was larger that of the ultra-highly loaded rotor, and the streamlines in the former rotor passage were closer to blade surfaces.
4.3 Comparison of flow characteristics at surge point between normally and ultra-highly loaded fan stages
From the Mach number contours on the S1 surfaces near the surge point (Fig. 16), it can be seen that the normally loaded rotor is a transonic rotor, with the inlet relative Mach numbers at its blade hub and tip being subsonic and supersonic, respectively, while the ultra-highly loaded rotor is subsonic, with the inlet relative Mach number being subsonic over its whole blade span. For the transonic rotor, the reason for the flow surge is that the local shock wave withdraws from the blade passages as the downstream pressure increases. However, for the subsonic rotor, the reason is that an increase of the angle-of-attack induces large flow separations on its blade suction surfaces as the downstream pressure increases. We suppose that a local shock wave withdraws more easily from the blade passages under a high downstream pressure, thus the surge margin of the normally loaded fan stage was much smaller than that of the ultra-highly loaded fan stage. The forward sweep of the normally loaded rotors blade can move the local shock wave backward, increasing the surge margin(Reference Denton and Xu19,Reference Passrucker, Engber, Kablitz and Hennecke20) ; the front part of the ultra-highly loaded rotors blades can be modified to increase the angle-of-attack range of low flow losses and thereby increase the surge margin.
5.0 CONCLUSIONS
It is easy to reduce the rotating speed of a geared fan with a high bypass ratio by increasing the gears reduction ratio. The noise can be reduced significantly by reducing the rotating speed of the rotor, which also relaxes the demands in terms of structural strength. To explore the feasibility of reducing the rotating speed, this paper designed an ultra-highly loaded fan stage and compared it with the normally loaded fan stage. The flow fields in the two fan stages were simulated using a numerical method to compare their aerodynamic characteristics, leading to the following conclusions:
(1) An ultra-high load coefficient of 0.88 was selected to design a fan rotor with ultra-low rotating speed and its matching stator. From the numerical results of the flow fields in the fan stage, at the design point, the efficiency of the rotor was high, the flow losses in the stator were acceptable, the efficiency of the fan stage was high and the surge margin was large.
(2) All the above facts indicate that aerodynamic design of an ultra-highly loaded fan stage is feasible. Compared with the normally loaded rotor, the thickness of the boundary layers on the blade surfaces and the size of the wakes behind the blades of the ultra-highly loaded rotor were smaller, the flow losses were lower and the blades were loaded rearward.
(3) In the normally loaded rotor, there was a local shock wave in the blade tip region, with the shock wave withdrawing from blade passages being the reason for the surge of the fan stage. In the ultra-highly loaded rotor, there were no local shock waves due to the low inlet relative Mach number, with the large flow separations near the blade suction surfaces being the reason for the surge. We suppose that a local shock wave withdraws more easily from blade passages under high downstream pressure, thus the surge margin of the normally loaded fan stage was much smaller than that of the ultra-highly loaded fan stage; which needs to be investigated more profoundly.
(4) The ultra-high loaded fan could be a good candidate for use in UHBRGT technology, which is one of the main candidates for next-generation propulsion systems. It would help reduce the noise and weight of the engine (especially in UHBRGT technology), relax the demands in terms of structural strength and improve the overall performance.