MODELING ARCHAEOLOGICAL VISUALSCAPES
Humans are affected by the physical landscape: the physical experience of travel and the sights they encounter along the way (Ashmore and Knapp Reference Ashmore, Knapp, Ashmore and Knapp1999). These encounters provoke the process of placemaking—where individuals choose to pause and derive meaning (Ashmore Reference Ashmore and Harmanşah2014; Tuan Reference Tuan1977:179). Challenging terrain, prominence, panoramic views, lines of sight, and even invisibility can therefore provoke the founding of culturally significant places of various functions: power, reverence, defense, and religious significance (Bradley Reference Bradley2000; Eliade Reference Eliade1961; Llobera Reference Llobera2007:51–53; Scully Reference Scully1962, Reference Scully and Scully1991; Turner Reference Turner1979; Van Dyke et al. Reference Van Dyke, Bocinsky, Windes and Robinson2016).
This article explores how to best measure the impact of mountainous landscapes on the siting of religious places. The spatial relationship will differ depending on the mountain's religious function (Bernardini et al. Reference Bernardini, Barnash, Kumler and Wong2013; Boivin Reference Boivin2004; Grove Reference Grove, Grove and Joyce1999; Reinhard and Ceruti Reference Reinhard and Ceruti2010; Williams and Nash Reference Williams and Nash2006). Humans can sacralize mountains, as happens with Hopi and Navajo tribes in the southwestern United States (Bernardini et al. Reference Bernardini, Barnash, Kumler and Wong2013:3951; Jett Reference Jett1995:41). In the case of the Hopi, their low-lying villages maintained direct lines of sight with whichever mountains were sacred at that time (Bernardini et al. Reference Bernardini, Barnash, Kumler and Wong2013). In the Andes, complexes were constructed on mountain summits, as well as oriented toward higher peaks, and subsequently considered symbols of religious and political power (Williams and Nash Reference Williams and Nash2006). Reverence for mountains could manifest even where these landforms were unavailable. In Mesopotamia, for example, monumental ziggurats acted as artificial barriers; their height reinforced a division between common people on earth and their physically elevated, deified king (Eliade Reference Eliade1961:42; Leick Reference Leick2002; Scully Reference Scully and Scully1991:23–24).
These examples model the attachment formed between humans and what they see—the “visualscape” (Llobera Reference Llobera2003; Richards-Rissetto Reference Richards-Rissetto2017:4)—and archaeologists have long sought precise, analytical methodologies for its characterization.Footnote 1 There is much to consider: the physical and visual effects that observers become culturally attuned to noticing and with which they associate meaning, where observers stand during that process, and how shifting cultural practices might alter visual experience.
Archaeologists studying visualscapes largely rely on one of two approaches: digital analyses using geospatial and 3D modeling software or phenomenology. Used separately, either avenue will pose methodological challenges. Some scholars criticize digital landscape models for presenting a Cartesian or God's-eye perspective (Brück Reference Brück2005:54; Thomas Reference Thomas and Bender1993:25, Reference Thomas2004:198–201; Wickstead Reference Wickstead2009:250). Other scholars contend that phenomenology will inaccurately substitute an archaeologist's experiences for the ancient worshiper's (De Reu et al. Reference De Reu, Bourgeois, De Smedt, Zwertvaegher, Antrop, Bats, De Maeyer, Finke, Van Meirvenne, Verniers and Crombé2011:3435). Many studies have proposed offsetting the objectivity of digital landscape models with the subjectivity afforded by phenomenology (Eve Reference Eve2012; Fábrega-Álvarez and Parcero-Oubiña Reference Fábrega-Álvarez and Parcero-Oubiña2019; Fitzjohn Reference Fitzjohn2007; Given Reference Given, Athanassopoulos and Wandsnider2004; Rennell Reference Rennell2012; Seamon Reference Seamon2014; Thomas Reference Thomas and Bender1993, Reference Thomas, Thomas and Jorge2008; Van Dyke et al. Reference Van Dyke, Bocinsky, Windes and Robinson2016), but full methodological disclosure is rare.
We need a precise, methodical approach for determining how visualscapes affected the siting of meaningful places and whether these preferences ebbed and flowed over time. By combining archaeological and historical data and phenomenological observation, as well as precise geospatial analyses, this article provides exactly that: a clearly articulated framework for gauging the cultural salience of natural landscapes.
I designed this methodology with four goals in mind:
(1) Data collection and analyses should rely on phenomenological observations as well as geospatial technology in order to offset weaknesses in either approach.
(2) Data collection and analyses should gauge characteristics and perspectives that are culturally relevant to the study area.
(3) Data collection and analyses should account for contrasting observer experiences: looking toward as well as from significant places.
(4) A significant span of time should be covered to compare worshiper trends against major cultural and political shifts.
The methodology is applied toward a dataset of cultic (i.e., religious) places in the Peloponnesian regions of the Argolid and Messenia circa 2800–146 BC. The resultant model identifies specific periods when topographical and visual preferences change. It articulates how the ancient Greeks saw and utilized their religious landscape differently through their history. More broadly, this article provides an open-access framework for gauging how visualscapes impact placemaking processes. It can be applied to any period, region, or place type—religious or otherwise.
CASE STUDY: ANCIENT GREEKS AND THEIR MOUNTAINS
There is no question that natural features influenced the siting of cult in the ancient Greek world. Modern scholarship largely draws connections between certain deities and natural settings (e.g., Poseidon and the sea), but every Greek deity was, in fact, connected in some way to natural phenomena (Cole Reference Cole2000:472–474). The natural world was a space for divine intervention and godly benefits: rest, regeneration and healing, or divine intervention (Håland Reference Håland, Kosso and Scott2009:119–120; Larson Reference Larson and Ogden2010:10; Williams Reference Williams1991:109).
Mountains were considered spaces of transition between the immortal and mortal worlds. They were not gateways or entrances, as with cultures such as the Maya (Lucero and Kinkella Reference Lucero, Kinkella and Harmanşah2014:13–14), but intervening places, providing deities with easy access to the mortal world (Langdon Reference Langdon2000:461). As a result, mortal Greeks were somewhat fearful of mountains. The mountains were frequently visited by the gods, which meant that a mortal's everyday activities—traveling, hunting, or herding—could potentially go awry (Buxton Reference Buxton1992:7–9, Reference Buxton1994:85–86).
Significant agency was imparted to ancient Greek gods; appearing on a mountain was always their choice. That said, mortals who sought divine intervention would try to entice them. Consequently, the ancient Greeks have left us with a series of archaeologically detectable actions for understanding the mountain–worshiper relationship. Worshipers selected a mountain, defined a temenos (i.e., a sacred boundary), kept that space clean, and there regularly deposited votives and made sacrifices (Cole Reference Cole2004:35–36).
Greek archaeologists have long focused on situating ancient accounts on the tangible landscape. A significant body of scholarship focuses on pinpointing where on the natural landscape Greek worshipers preferred to practice (Barnett Reference Barnett2007; de Boer and Hale Reference de Boer, Hale, McGuire, Griffiths, Hancock and Stewart2008; Driessen Reference Driessen2003; Faro Reference Faro2008; Goodison Reference Goodison2004; Hannah Reference Hannah2013; Hitchcock Reference Hitchcock2007; Retallack Reference Retallack2008; Scully Reference Scully1962; Van de Moortel Reference van de Moortel2006, Reference van de Moortel, Gauß, Lindblom, Angus, Smith and Wright2011; Williamson Reference Williamson1993). Much of this work focuses on mountain top worship. Geospatial analyses measure the worshiper's viewshed while standing inside the temenos (Briault Reference Briault2007; Hannah Reference Hannah2013; Nixon Reference Nixon2009; Peatfield Reference Peatfield1983; Soetens Reference Soetens2009; Soetens et al. Reference Soetens, Sarris, Topouzi, Detorakis and Papdaki-Oekland2001; Soetens, Sarris, Topouzi et al. Reference Soetens, Sarris, Topouzi, Tripolitsiotis, Burenhult and Arvidsson2002; Soetens, Sarris, Vansteenhuyse et al. Reference Soetens, Sarris, Vansteenhuyse and Topouzi2002; Topouzi et al. Reference Topouzi, Soetens, Gkiourou and Sarri2000; Williamson Reference Williamson1993). These studies often measure whether from there, observers could see another culturally significant place (e.g., a sanctuary; Doxtater Reference Doxtater2009; Nixon Reference Nixon2009).
In order to effectively model an ancient visualscape, archaeologists need to scrutinize whether their chosen analytical approaches have modern and discipline-specific biases. Archaeologists exploring sacred landscapes in Greece have historically favored sanctuaries located on the highest, steepest peaks. Such studies are arguably impacted by modern topographical definitions, which, although largely lacking standardization, do tend to emphasize elevation and slope as defining factors (Blyth et al. Reference Blyth, Groombridge, Lysenko, Miles and Newton2002:12). The ancient Greeks were certainly attuned to elevation and slope, but they also cared about prominence—that is, noticeability (Belis Reference Belis2015:41; Buxton Reference Buxton1992:2; Langdon Reference Langdon2000:462). A landform does not need either a high elevation or a steep slope in order to be noticeable, and this might explain why some landforms in Greece—being well below the 300 m mark—are described as mountains in ancient texts (Belis Reference Belis2015:40; Buxton Reference Buxton1992:2; Langdon Reference Langdon2000:462).
Previous archaeological studies suggest that views afforded from mountains and hills could have impacted the founding of cultic places on the ancient Greek landscape—but so too could the views toward them. By comparing these contrasting observer perspectives within a single dataset, we can determine the physical characteristics that inspired the cultic placemaking process on the ancient Greek landscape. My study asks: Were Greek cultic places chosen according to landscape prominence (i.e., noticeability) or visible extent? Did these preferences vary regionally and over time?
SURVEY METHODOLOGY
Defining the Study Area
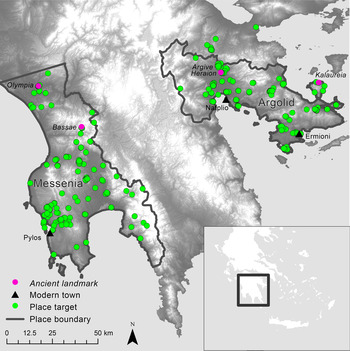
This study is devoted to two Peloponnesian regions: the Argolid (2,819.38 km2) and Messenia (4,060.21 km2; Figure 1). The Argolid is in the northeast Peloponnese, bound on the eastern side by the Arcadian mountain range. Messenia encompasses the modern towns of Triphylia, Pylia, Messini, and Kalamata, with the Taygetos Mountains on the east, and Mounts Nomia and Elaeum to the north. Adhering to strict boundary lines such as these does present a conundrum for landscape archaeologists (Cherry Reference Cherry, Keller and Rupp1983:385–386). On the one hand, it provides a manageable space within which to collect data; on the other hand, these lines inaccurately presume that people adhere to a singular notion of boundary.

FIGURE 1. The survey recorded all cultic places used between 2800–146 BC in the Argolid (2,819.38 km2) and Messenia (4,060.21 km2).
Questions about vision can further complicate archaeological boundaries. In the observer's mind, the physical space of their political or social territory can be different based on their visible extent, impacting their sense of spatial ownership and belonging (Bernardini et al. Reference Bernardini, Barnash, Kumler and Wong2013:3948). For research on visualscape, this means considering expanding a study area beyond sociopolitical boundaries. In this study, for example, the boundaries of the Argolid and Messenia were extended because observers could have easily seen—and, in turn, utilized—sanctuaries beyond those lines (e.g., at Bassae and Olympia, as well Skilloundia [Cooper Reference Cooper1996:42, 45; Larson Reference Larson2007:27; Morgan Reference Morgan1990:89–90]). The boundaries of either region—and the cultural identities contained within them—also change through history. The case study applies the largest known ancient boundaries for either region in order to understand whether and how historic locales were integrated into the lives of contemporary people.
Survey Targets
A cultic place is defined as any individual built or natural space to which material remains for repeated religious activity can be attributed. These activities can be unique to a particular time or region (Antonaccio Reference Antonaccio1994:398).Footnote 2 For each of the study areas, I located all places where previous researchers had discovered material evidence for cultic activity (e.g., burning fires, intentional deposits of objects, sacrifice, or construction of related buildings). Because the study focuses on placemaking as it pertained to group worship, household cultic contexts were excluded. Restrictions set by the Greek Ministry of Culture and Sports meant only published cases could be used. In sum, 401 places were identified.
The data-recording strategy captures every individual act of cult. Instead of representing an entire sanctuary as one cultic place (one database record), every locale inside its boundary dedicated to cultic acts (altar, temple, pit, etc.) is treated as a discrete place as well. Recording data in this way makes it easier to identify changing temenos sizes and functions over time and to measure how these alterations impacted the worshiper's visualscape.
Cultic places located in other environments (e.g., coasts, valleys, plains) are not excluded from the study. The reasons for doing so are threefold. First, as previously described, there are significant differences between the ancient and modern Greek definition of “mountain.” Analyzing all cultic places—regardless of topographical situation—accounts for the archaeologist potentially seeing the landscape differently. Second, analyzing all cultic places encourages inquiries about how the ancient Greeks saw and used their landscape differently across space and through time. Despite the clear importance of mountains in ancient Greek worship, there were still many sanctuaries founded on low-lying, seemingly unnoticeable locations. Many potential influencers could have come into play: social competition and settlement proximity (de Polignac Reference de Polignac, Alcock and Osbourne1994, Reference de Polignac1995) and certain cults requiring specialized natural environments (e.g., Poseidon worship occurring near water), as well as changing worshiper preferences.
With all these factors in mind, there is a substantial body of evidence pointing to the importance of mountainous terrain, and by exploring all cases of worship—regardless of their natural environment—we can cross-examine many influencers and determine whether the cultic placemaking process focused on meeting multiple needs. Finally, recording all cultic places responsibly produces a more expansive dataset, leaving room for future analytical improvements and research enquiries.
Data Recording
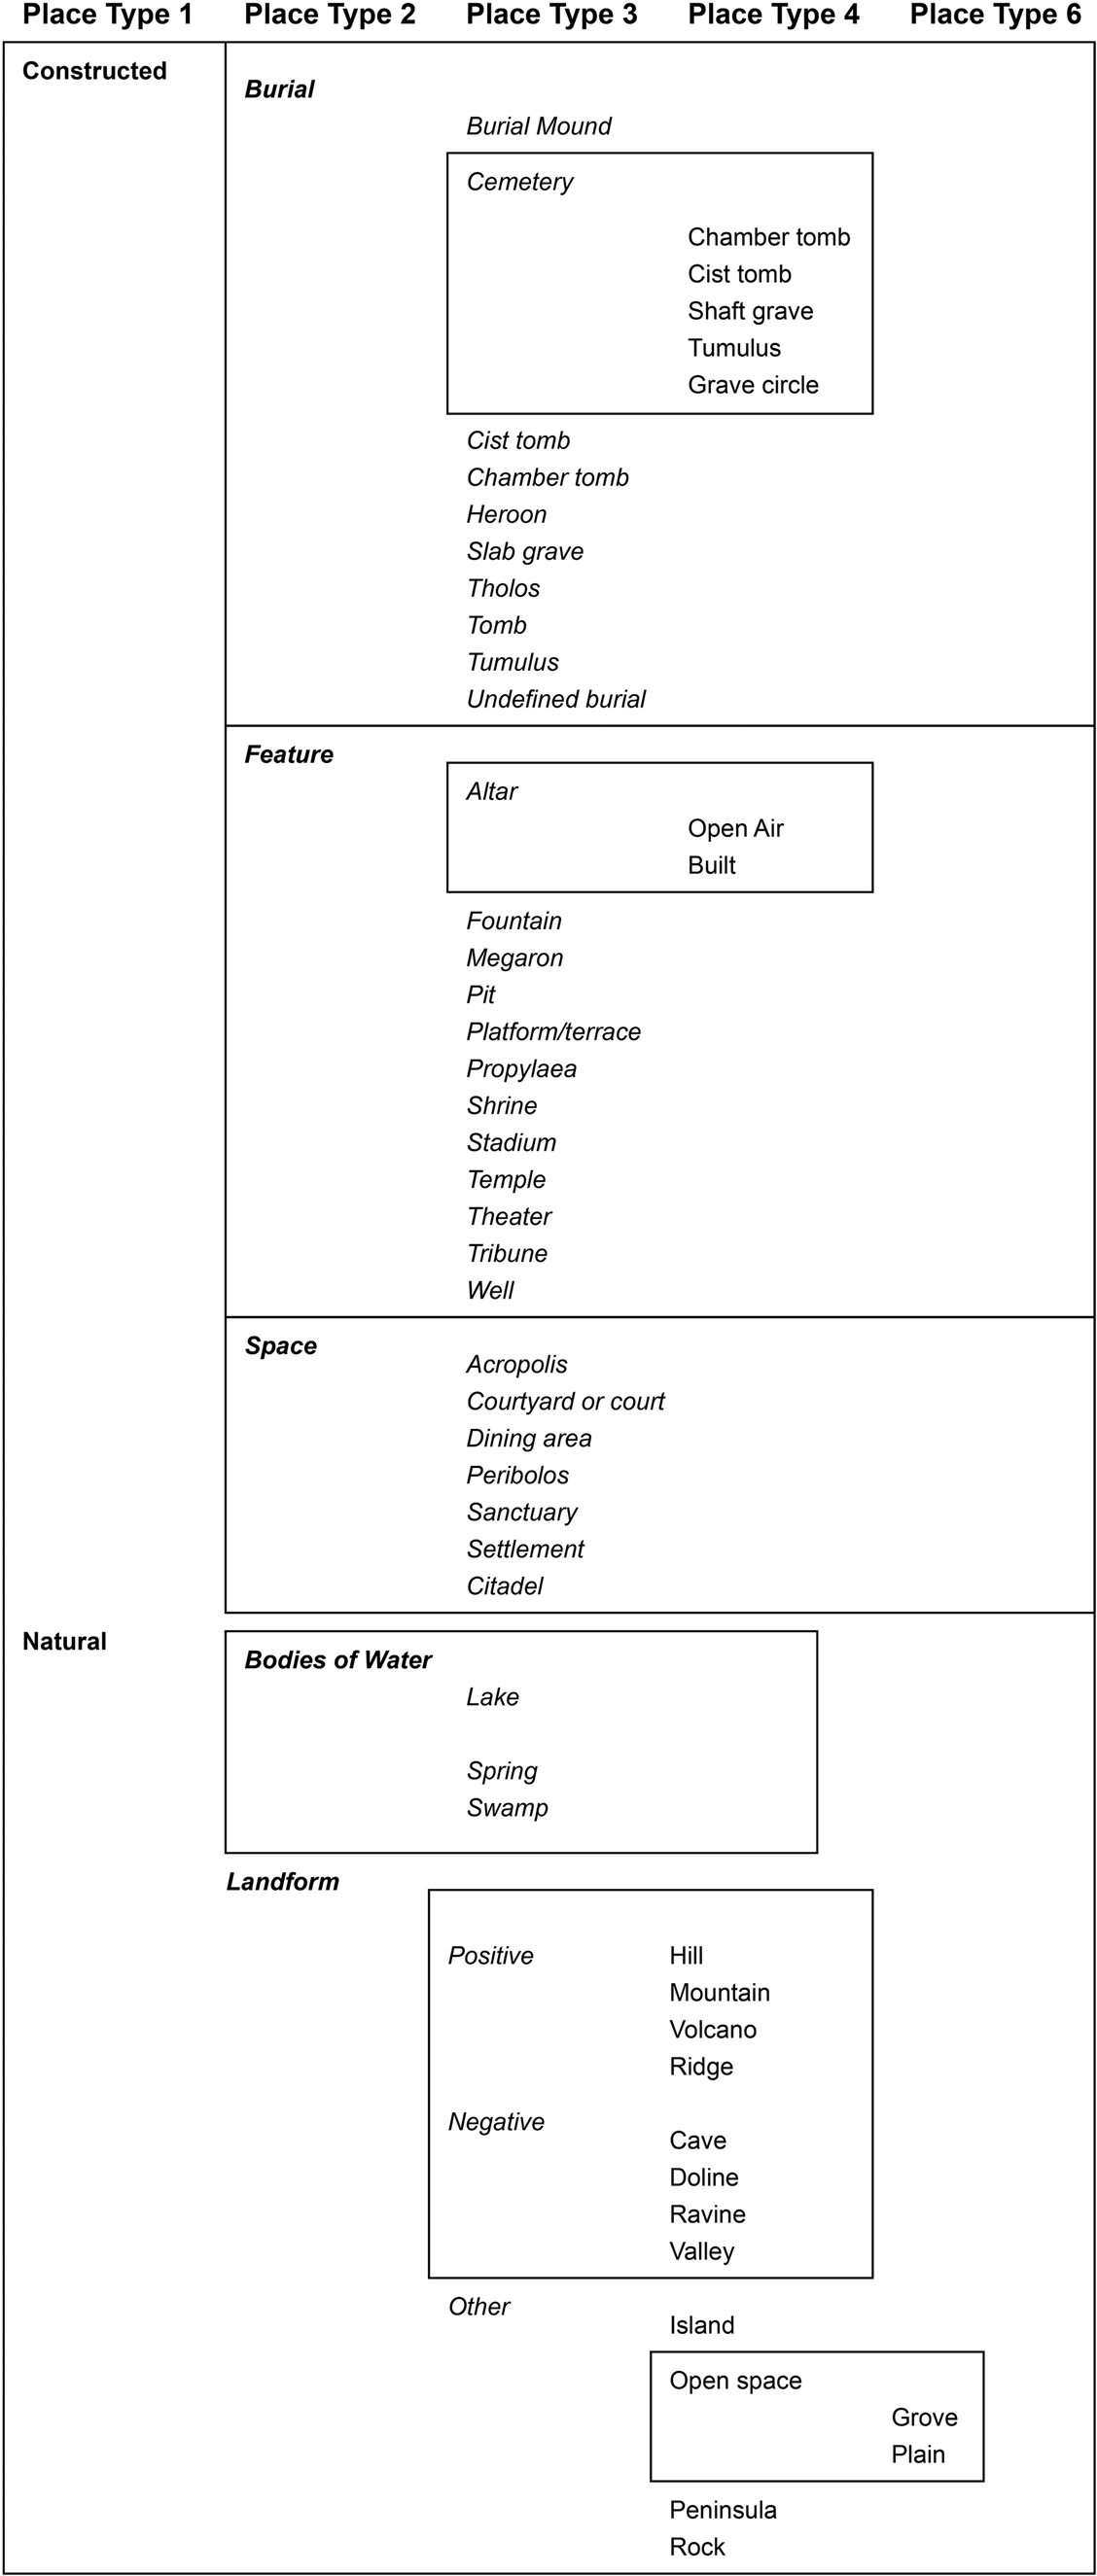
I assigned a unique “Place ID” to each cultic place (every built altar, open space altar, megaron, temple, tomb, terrace, etc.) and stored them in an Access database (Supplemental Database; Supplemental Text). Because this study treats the natural environment as an artifact, I recorded each cultic place's associated natural feature as a separate entry in the database as well. Each natural and constructed place's type was categorized via a cascading typology: every place was defined broadly (e.g., “constructed”) as well as specifically (e.g., “open-air altar”), thereby ensuring that the data is flexible and functional, even for analyses beyond the scope of this work (Figure 2).

FIGURE 2. A cascading typology was applied to all constructed and natural places, allowing for each place to be both broadly and specifically defined.
The database is designed to link places to one another. Linking relationships are functional (e.g., a temple is located inside of a sanctuary) or spatial (e.g., the Sanctuary of Apollo at Bassae is visible from the Sanctuary of Nomian Pan).Footnote 3 Additionally, every cultic place is linked to its natural feature through a spatial relationship (e.g., the Sanctuary of Apollo at Bassae is located on Kotylion Mountain).
I recorded additional attributes for every constructed place, such as ancient and modern bibliography, summary of excavation and survey data, and previous theories regarding motives for its placement. The database includes a timeline table that records the following phases (if any) for every place: (1) cultic use prior to construction of a permanent structure, (2) construction of the cultic place, and (3) cultic reuse following abandonment, thereby indicating a change in practice (e.g., a Mycenaean tholos tomb being converted into an altar during the Geometric period).Footnote 4
Field Survey
The goals of the field survey were twofold. First, substantial visual data were needed to ground-truth the visualscape analyses. Second, I wanted to enact a phenomenological investigation of these cultic places and experience the environment firsthand (Susmann Reference Susmann2019b:1–11, 121–139).Footnote 5 Observing ourselves and others in the modern landscape opens our minds to the potential pathways, views, and perceptions of past users (Barrett and Ko Reference Barrett and Ko2009:276; Given Reference Given, Athanassopoulos and Wandsnider2004:168; Tilley Reference Tilley1994:73–75; Van Dyke et al. Reference Van Dyke, Bocinsky, Windes and Robinson2016). Phenomenology therefore helps us “build a place-based narrative of the [worshiper's] journey and to explore (through the analogue of our own bodies) the kind of perceptions—and emotions—attendant on moving through such spaces” (Wescoat Reference Wescoat, Kristensen and Friese2017:69).
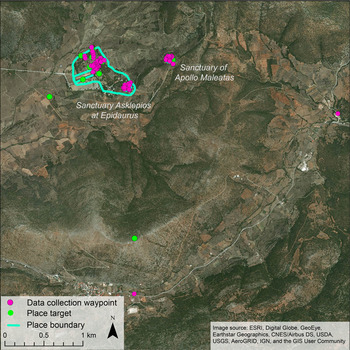
The survey was accomplished in two phases. For each study area, I spent approximately two months locating these places remotely in Google Earth; survey and excavation publications often exclude or generalize geographic coordinates. Next, I traveled to Greece, located each cultic place in person, and recorded data for each.Footnote 6 Visual data captured what could be seen, based on multiple vantage points. I photographed panoramas at varying distances and directions, capturing views looking toward the cultic place, and at the cultic place, looking at the surrounding landscape. I recorded videos to convey the experience of walking through and around each place's boundaries. Then, I marked every video and photograph with a GPS point (Figures 3 and 4). Video narratives and journals recorded my experience of the place: difficulty of access, extent and contents of the viewshed, level of isolation (e.g., if other visitors were present), and my impression of how others utilized the place.

FIGURE 3. Visual data were collected both within cultic place boundaries and around them. For example, data collection (pink points) occurred at various distances around the Sanctuary of Asklepios at Epidaurus and the Sanctuary of Apollo Maleatas in order to understand the surrounding visualscape.

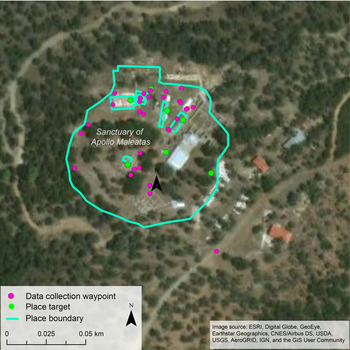
FIGURE 4. Visual data were collected inside the cultic place's boundaries (i.e., here, at the Sanctuary of Apollo Maleatas). Locations of data collection (pink points) were determined by place type (e.g., temple, open-air altar, pit, etc.), and they model where ancient observers would feasibly stand. Adjustments were occasionally made because of permit restrictions.
VISUALSCAPE ANALYSES METHODOLOGY
Goals
The Greeks regarded mountains as sources for godly contact, and I hypothesize that this association influenced where cultic activity was located on the landscape. Historical and archaeological data suggest that the Greeks identified mountains based on noticeability and/or vast viewsheds. I decided to test how frequently the survey data reflected these preferences: whether most places were situated to be noticeable or afford worshipers panoramic views of their landscape. By ordering the quantitative results in chronological order—when cultic activity occurred at each place—I modeled how worshiper preferences changed over time.
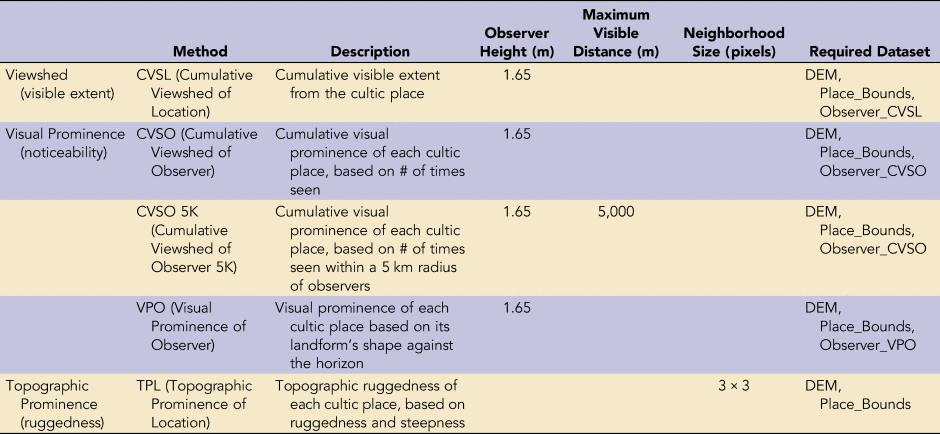
The selected analyses fall into three categories (Table 1):
(1) Viewshed, or what can be seen from the cultic place. This was measured via CVSL (Cumulative Viewshed of Location).
(2) Visual prominence, or whether the place was noticeable to passers by based on characteristics like elevation, slope, and shape against the horizon. This was measured via Cumulative Viewshed of Observer (CVSO and CVSO 5K) and Visual Prominence of Observer (VPO).
(3) Topographic prominence, or whether the place was noticeable as a result of rugged terrain. This was measured via Topographic Prominence of Location (TPL).
TABLE 1. Visualscape Analyses Summary.

Parameters
This section briefly describes the factors that informed the design of these analyses: representing place targets via polygons and not centroids, number, and placement of observer points, as well as maximum visible distance radii.
Boundaries and Observers
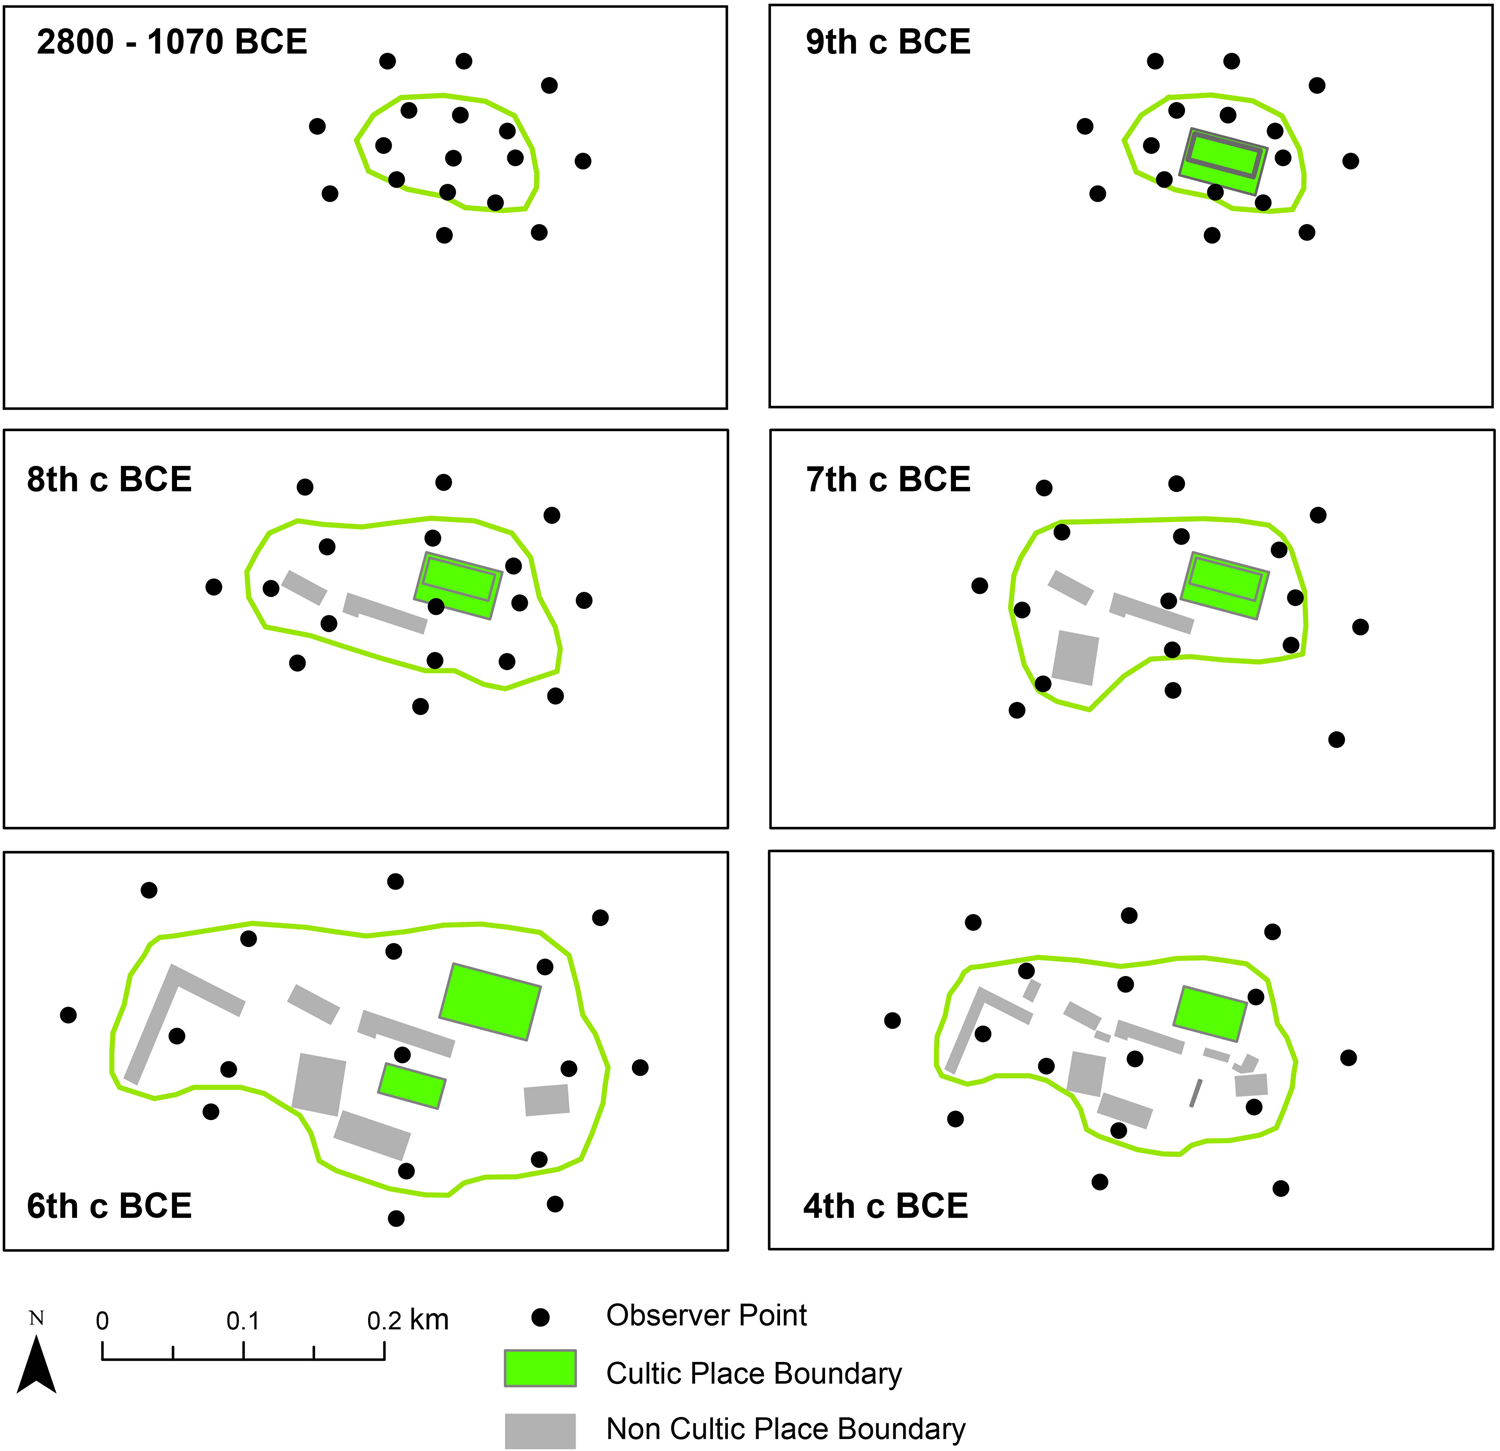
For the sake of easy database recording, I represented each cultic place's location as a single set of GPS coordinates (Places.shp). I created a second shapefile (PlaceBounds.shp) to represent cultic places’ use areas. This shapefile was utilized in the visualscape analyses. If a single cultic place had multiple extents over time, I recorded each phase as a separate polygon and linked it to respective records in the Access database's timeline (Figure 5).

FIGURE 5. Spatial extent affected how analytical outputs were measured. If a place's extent changed over time (green polygons), I made sets of observers per phase (black points) and then ran analyses per each observer point set. Note that the observer points shown here are only for the Argive Heraion sanctuary's temenos. I recorded cultic structures located inside the temenos (i.e., the altar, Old Temple Terrace, Old Temple of Hera, and New Temple of Hera) as individual cultic places, which means they have separate observer point files (not shown) and analyses outputs.
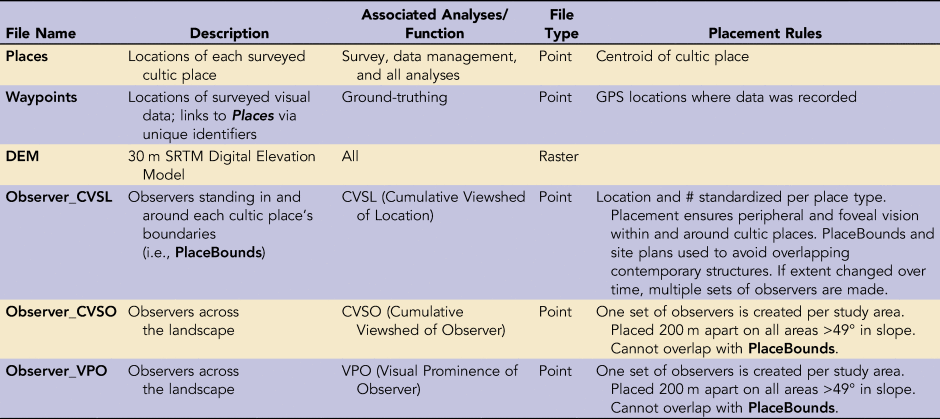
The analyses measure a range of visual effects, the majority of which are founded on viewshed principles: measuring what an observer can see, based on the individual's stature, the elevation, and the elevations of the surrounding landscape. Each analysis necessitated a customized set of observer points, and PlaceBounds.shp dictated how these were placed (Tables 1 and 2). For CVSL, which measured a place's viewshed, I situated observer points (Observer_CVSL.shp) with respect to these spatial boundaries. For the three visual prominence analyses (CVSO, CVSO 5K, and VPO), I placed random observers across the study area (Observer_CVSO.shp and Observer_VPO.shp). In these cases, PlaceBounds.shp demarcated ineligible placement areas: observers were not permitted to “stand” on top of structures.
TABLE 2. GIS Files Used for the Visualscape Analyses.

Maximum Visible Distance
Vision-focused geospatial tools include an optional outer visible radius setting. If the radius is applied, the observer's ability to see is limited by that distance. Archaeologists tend to favor this setting, and they apply radii somewhere between 3,440 and 5,000 m in order to represent the limitations of 20/20 human vision (Gillings Reference Gillings2015:4). Applying this radius does not guarantee output accuracy. Many potential impediments exist—such as vegetation, light, weather, and poor vision—but archaeologists cannot easily account for them. This is where visual field data comes in handy.
My methodology does not apply maximum visible distance radii (Table 1) for two reasons. First, increased elevation extends an individual's vision well past the commonly applied 5,000 m threshold, and this was observed with most places recorded in this study. Second, 3,440–5,000 m distance thresholds are based on an individual's ability to see a 1 m wide object (Ogburn Reference Ogburn2006:409–410). Recognition of a significant locale is based on not only the sight of the structure but also the landform. Landforms measured in this study are certainly wider than 1 m.
Geospatial Approaches
Visual Prominence
Visual prominence, or a place's noticeability, was measured in two different ways (Table 1). Cumulative Viewshed of Observer (CVSO) assesses how often an individual would see a cultic place. This was calculated via the summation of several thousand viewsheds across the study area. Visual Prominence of Observer (VPO) focuses on horizon lines—which landforms were the most distinctive based on shape.
Cumulative Viewshed of Observer (CVSO)
Cumulative Viewshed of the Observer (CVSO and CVSO 5K) gauges noticeability based on how easily observers across the study area could see a certain location (Table 1). These analyses use a reverse viewshed: observers are represented as vector points, spread across the entire study area, and viewsheds are calculated for each. The cumulative output represents the number of times every location on the landscape was seen. Reverse viewshed accuracy depends on the number of applied observer points. Ideally, a total viewshed approach should be used: observers are placed on every pixel of the Digital Elevation Model (DEM). Accuracy aside, total viewsheds are unrealistic for large study areas. The high number of observers means decreased processing speeds and virtually unmanageable output data sizes (Llobera Reference Llobera2003:33). Cumulative viewsheds are the next-best approach. Observers are regularly spaced across the DEM, but in much smaller numbers, thereby making the calculation computationally feasible.Footnote 7
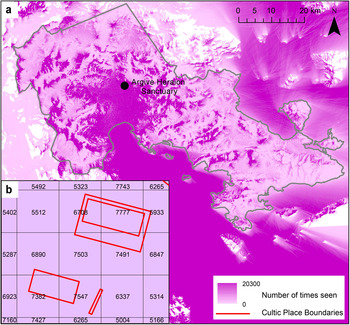
Within each study area, I placed observers on a grid, each separated by 200 m (Table 2). I calculated viewsheds for every observer using Boston University's Shared Computing Cluster and r.Viewshed (in GRASS GIS). Per study area, I merged the viewsheds into a single raster output. Each pixel quantifies the number of times that 30 m2 area was seen by the regional observers. In other words, the raster output quantifies an observer's concatenated view, as that person moves through space (Llobera Reference Llobera2003:33; Figure 6a).

FIGURE 6. (a) CVSO (Cumulative Viewshed of Observer) measurement is performed by creating a grid of observers within the regional study area. For each of these observers, a separate viewshed is calculated. The final merged raster is a continuous dataset comparing regional noticeability. (b) Each place's polygonal boundary or boundaries are intersected with the raster, and the following is calculated: (sum of # times seen/# pixels intersecting the boundary) = prominence.
Although regional differences are apparent from the raster, I decided to translate the data into comparable scores representing the number of times each cultic place was seen. To do so, I vectorized the output and intersected it with a shapefile recording each place's boundary. Two scores were calculated (Figure 6b). The first is CVSO, or the number of times that place was seen, with no maximum visible radius set. The second is CVSO 5K. CVSO 5K normalizes the CVSO based on the number of observers within a 5 km radius of the cultic place. It measures prominence on a localized level, and when compared against CVSO, it determines whether a place's prominence was dependent upon observer proximity.
Visual Prominence of Observer (VPO)
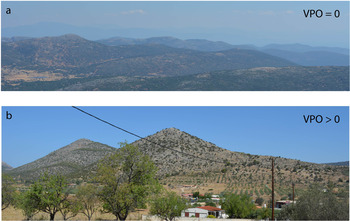
VPO measures visible prominence using an alternative perspective. Prominence is based on shape: whether a landform is steep, isolated, and pointed (Bernardini et al. Reference Bernardini, Barnash, Kumler and Wong2013:3948; Figure 7). My approach is based on the methodology pioneered by Bernardini and colleagues (Reference Bernardini, Barnash, Kumler and Wong2013:3947), which measures local prominence, or noticeability from fixed locations of interest.

FIGURE 7. VPO (Visual Prominence of the Observer) measures visual prominence based on landforms’ comparable elevation, slope, and visual isolation: (a) these landforms yield VPO scores of 0 because they are not distinctive from one another; (b) these landforms yield scores greater than 0 because they are isolated from one another and form distinctive shapes against the horizon.
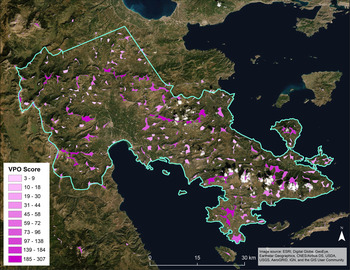
I adjusted their methodology to instead measure global visual prominence—that is, to compare noticeability across the landscape, with no fixed observer location in mind. To do so, I placed gridded observers across the study area, each separated by 2,000 m (Tables 1 and 2)Footnote 8, and I measured the extent and shape of each observer's 360-degree horizon line. This was done using ArcGIS's Skyline tool. Bernardini and colleagues’ (2013) customized Python scripts simplified the horizon line to its steepest, pointiest, and most isolated peaks, and gave each a comparative score (Barnash Reference Barnash2011; Bernardini et al. Reference Bernardini, Barnash, Kumler and Wong2013:3948–3951). I merged results from every observer, producing a vector shapefile recording prominent areas in each study area—that is, prominent areas based on Bernardini and colleagues (Reference Bernardini, Barnash, Kumler and Wong2013): characteristics of slope, shape, and location (Figure 8). Any score greater than 0 is considered visually prominent. In order to relate these prominent landforms to cultic activity, I intersected the polygonal boundaries with cultic place boundaries (i.e., PlaceBounds.shp). Cultic places were, in turn, assigned that score.
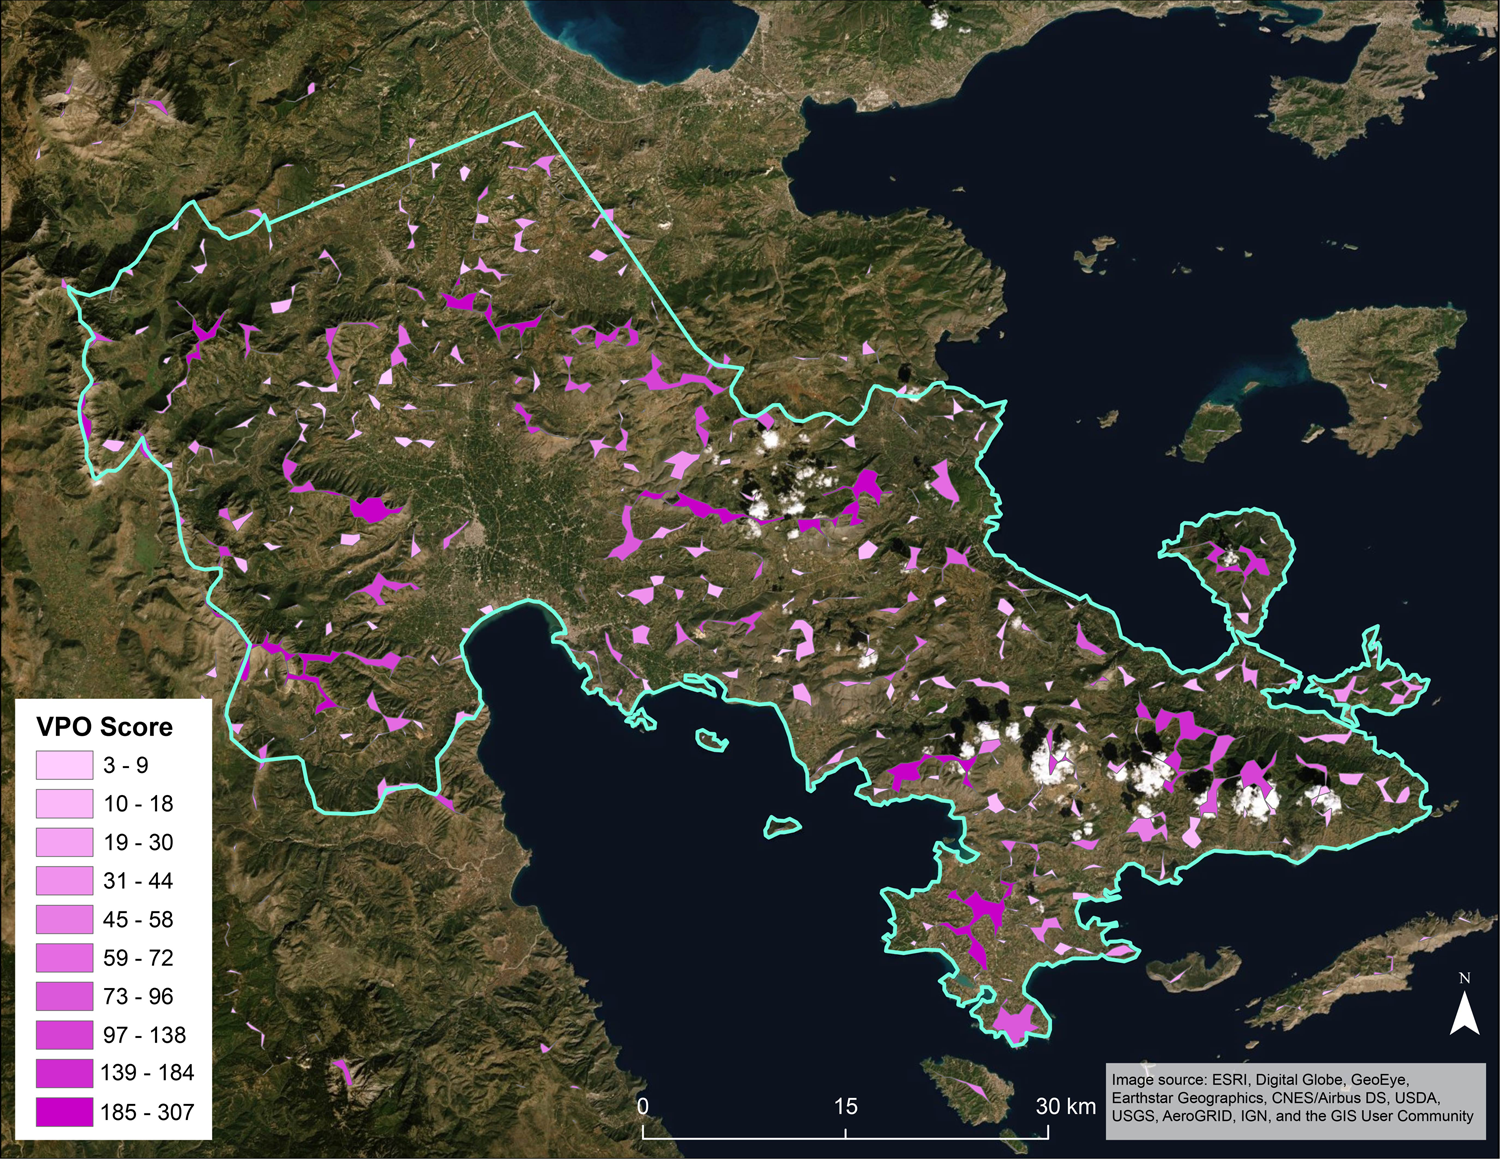
FIGURE 8. VPO (Visual Prominence of the Observer) analysis output is not continuous. Only cultic places that intersect the polygonal boundaries of visually prominent landforms are considered prominent.
Cumulative Viewshed of Location (CVSL)
CVSL represents the extent of view from a cultic place. Most archaeological studies measure binary viewsheds—that is, the visible extent available to one or a few observers. This approach can be useful in identifying lines of sight (Danahy Reference Danahy2001)—whether, for example, Minoan peak sanctuaries were visible from one another—but the results are also quite static. A binary viewshed models an unrealistic situation: what a motionless, forward-facing observer sees (Llobera Reference Llobera2003:33).
CVSL addresses these limitations, recalling the logical principles of the CVSO approach: increasing the number of observers will produce a more accurate model of view (Table 2). By situating observers throughout the space of the cultic place, CVSL accounts for both peripheral and foveal vision—it conveys the topographic changes encountered as one moved around and looked about. It models “a sense of the complete scene” (Danahy Reference Danahy2001:126), better than a traditional binary approach does.
The methodology was easily implemented. I created a set of observer points for each cultic place, paying mind to changing boundaries over time, as well as adjacent contemporary structures—cultic or otherwise (Table 2; Figure 5). Using a viewshed tool (e.g., Visibility in ArcGIS or one similar), I calculated the total visible area from each observer point. The resultant raster represents what a worshiper could see while moving through and around the cultic place.
Topographic Prominence of Location (TPL)
TPL is the measurable difference between the height of an observer and the surroundings. It gauges noticeability based on a place's physical ruggedness (Llobera Reference Llobera, Wheatley, Steele, Cox and Parchment2010:1007). TPL is measured by (1) identifying a pixel of interest, (2) demarcating a neighborhood around that place, and (3) measuring the height differences between the pixel of interest and the pixels in its neighborhood. Although the resultant measurement—differences in altitude—contributes to our understanding of landform noticeability, there are challenges associated with related parameters. The researcher chooses the neighborhood size, thereby impacting whether a locale is determined to be more rugged than its surroundings. In other words, a locale can be exceedingly prominent on a local scale but not regionally.
Due to these methodological challenges, topographic prominence results were described in context with visual prominence: whether slope contributed to visual prominence, and whether any cultic places were situated on rugged but also unnoticeable areas. In the case of the latter, topographic prominence could highlight an alternative—and largely understudied—perspective: whether Greek worshipers ever preferred difficult-to-access locales that were largely invisible to passersby.
There are several methods for measuring topographic prominence (Christopherson Reference Christopherson2003; De Reu et al. Reference De Reu, Bourgeois, De Smedt, Zwertvaegher, Antrop, Bats, De Maeyer, Finke, Van Meirvenne, Verniers and Crombé2011, Reference De Reu, Bourgeois, Bats, Zwertvaegher, Gelorini, De Smedt, Chu, Antrop, De Maeyer, Finke, Van Meirvenne, Verniers and Crombé2013; Llobera Reference Llobera2003). I chose Focal Statistics in ArcGIS (Tables 1 and 2). As was the case with previous analyses, I intersected the results with the cultic place boundaries shapefile in order to ascertain the average, minimum, and maximum scores within the use area. This article presents average scores.
Data Presentation
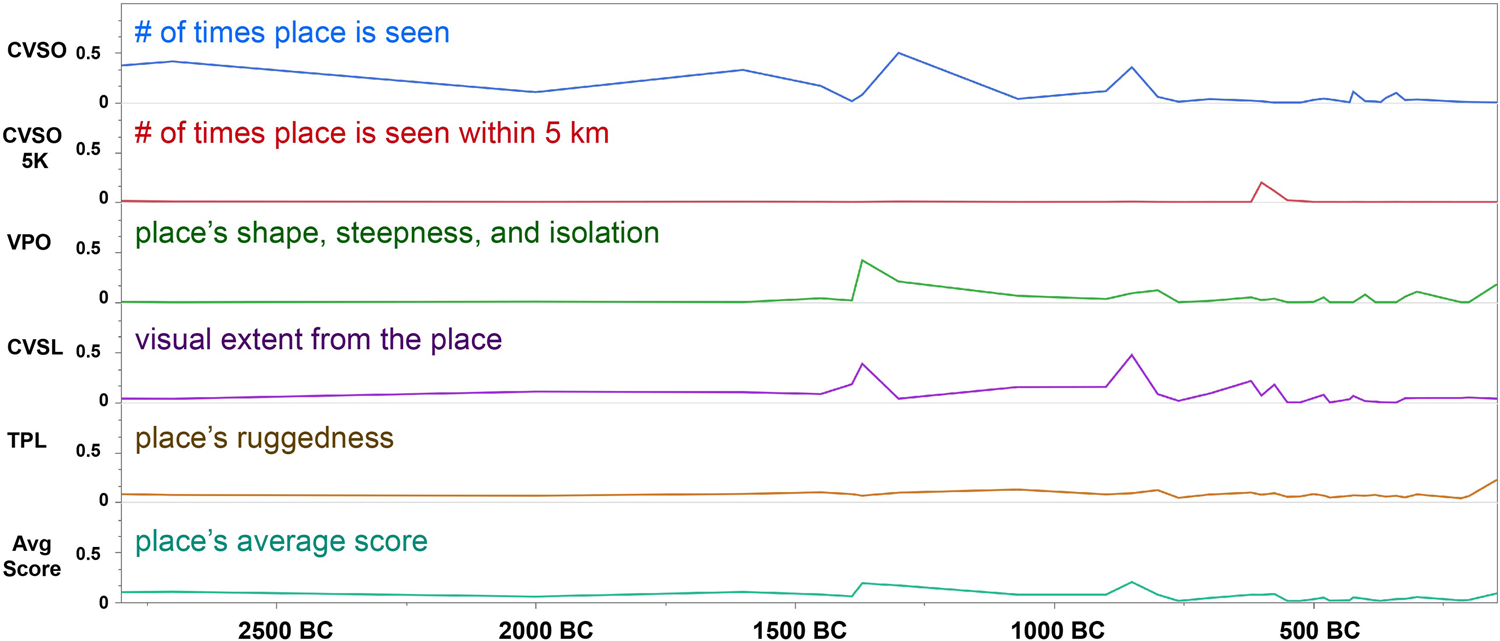
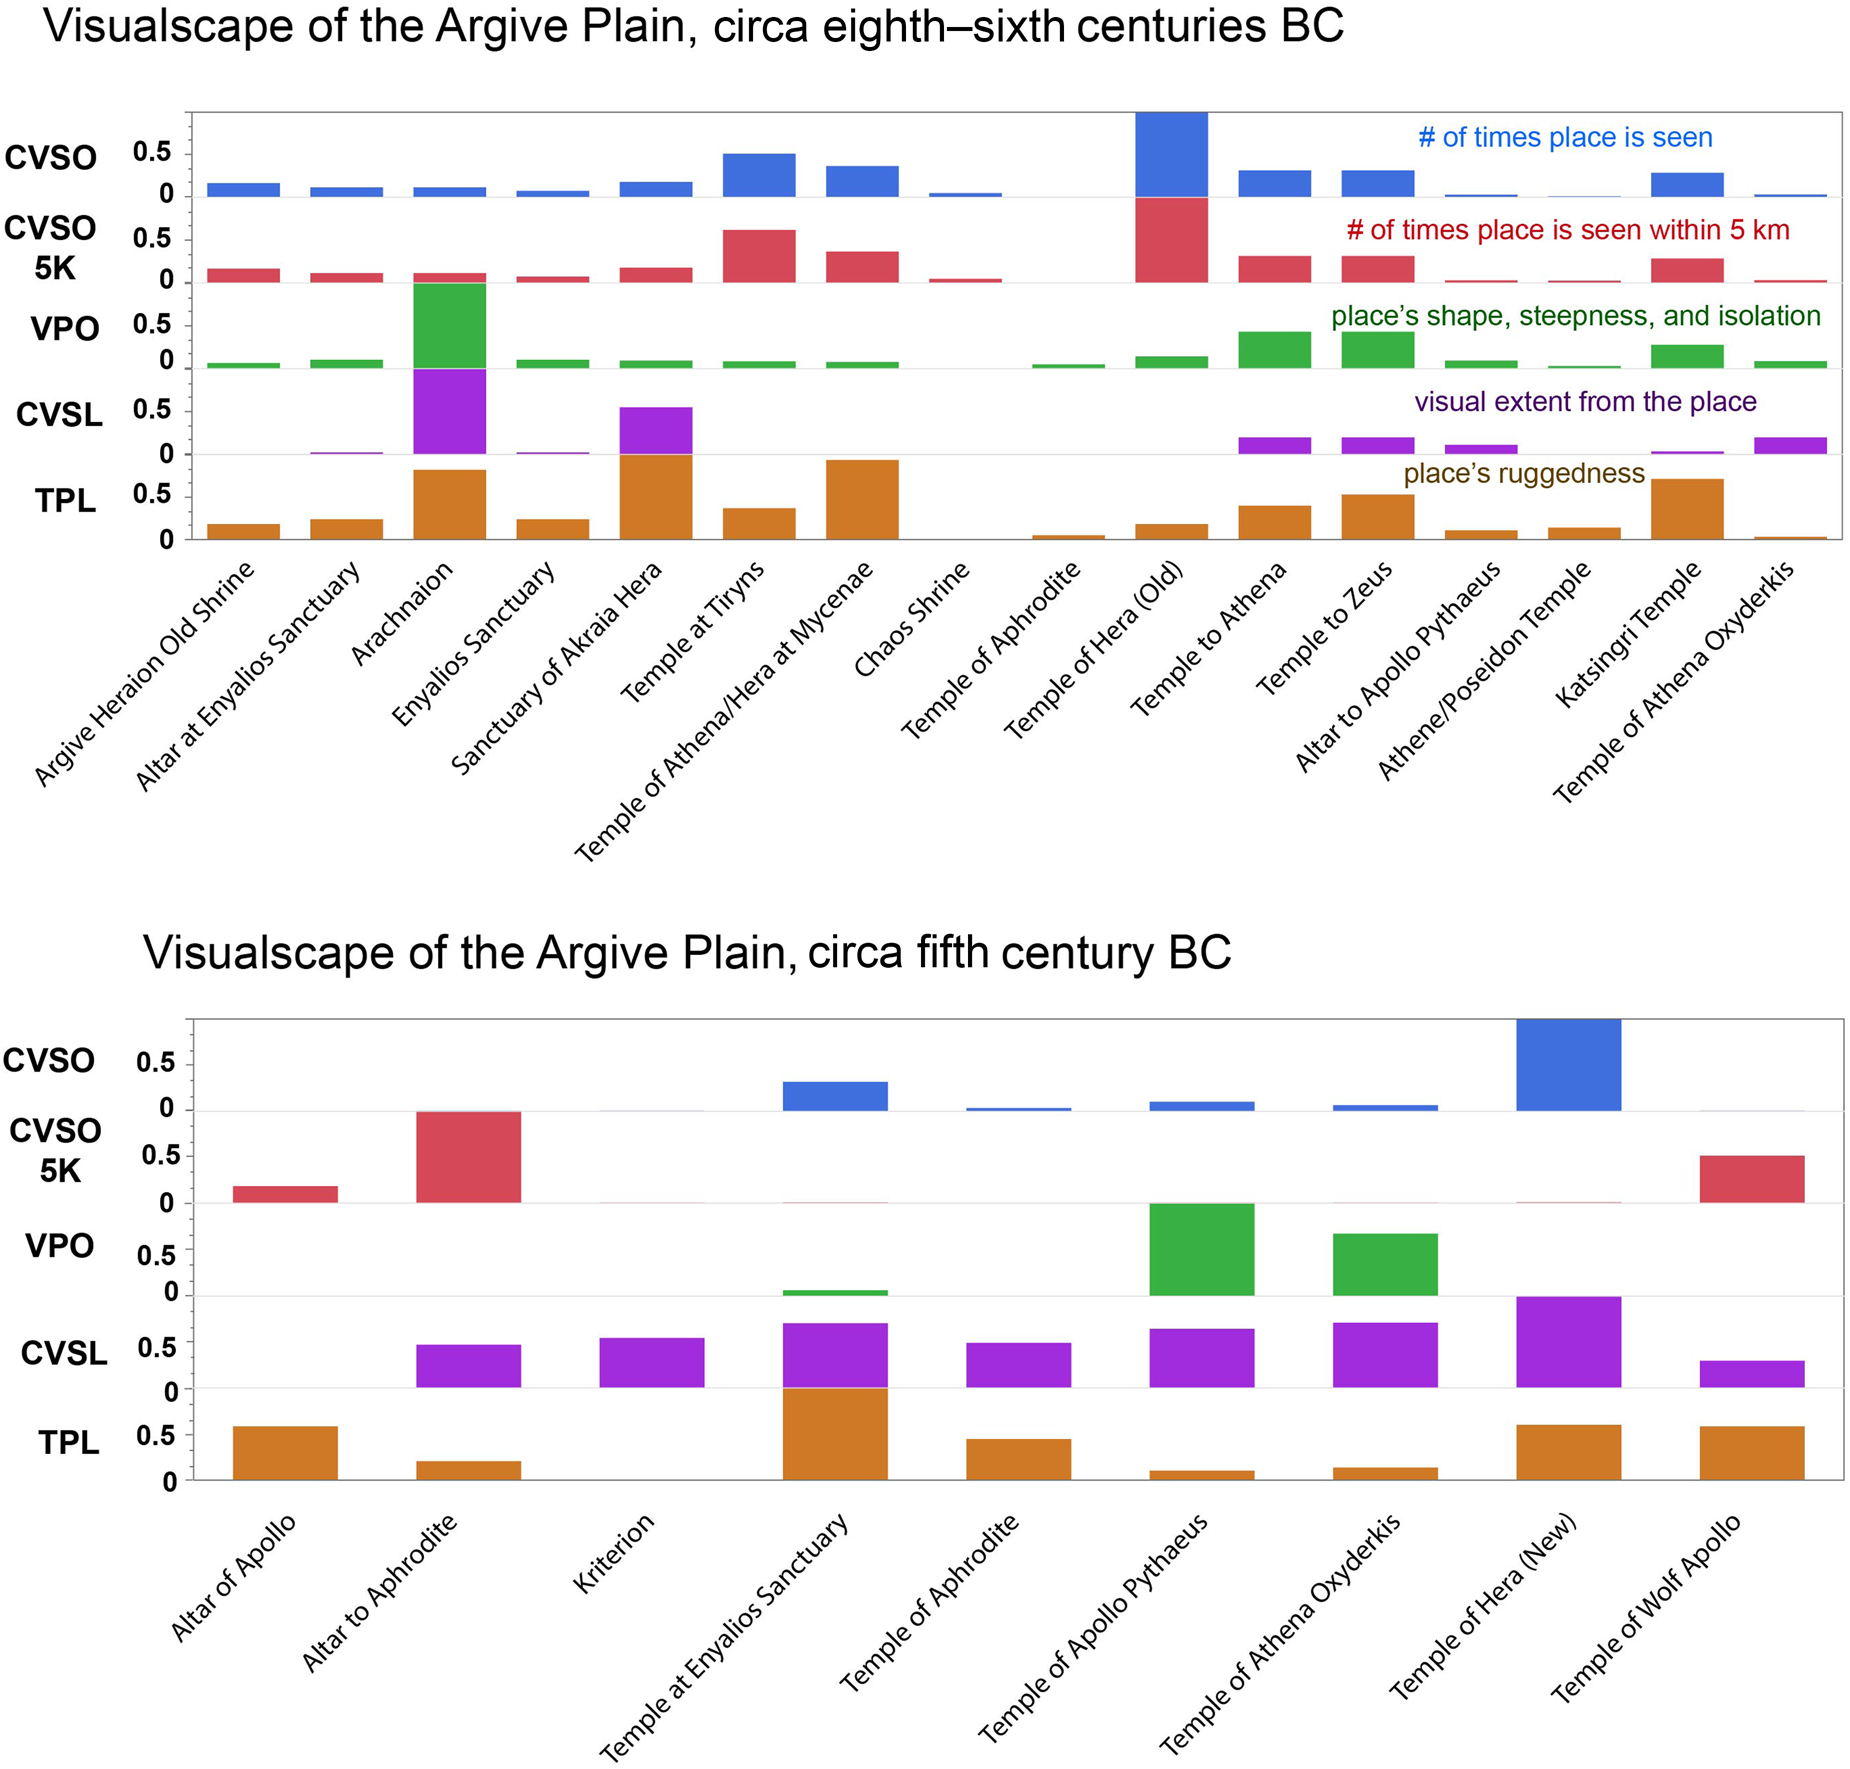
I performed each analysis—CVSO, CVSO 5K, VPO, CVSL, and TPL—per cultic place, and if that place's boundary changed over time, I ran the analyses per each time phase. I normalized the values between 0 and 1, and I graphed them per century using JMP software. The resultant model represents the average visualscape values per century, based on changes on the landscape: new constructions or newly recycled locales (Figure 9). It conveys the sorts of natural environments preferred for worship, and the way these preferences changed over time.

FIGURE 9. I normalized the visualscape analyses’ average scores and graphed them per century. These scores reflect new additions to the landscape or revisitations of older cultic places.
DISCUSSION
The results identify distinctive moments of time when ancient Greeks in Messenia and the Argolid preferred specific types of natural environments for worship—specifically, when they developed cultic places at locales that were steep, that were noticeable, or that provided a vast viewshed (Figure 9). Their preferences can be contextualized against other historical and archaeological data; we can surmise the motives for preferring specific environs over others throughout their culture history. That discussion is beyond the methodological scope of this article and can be found in Susmann (Reference Susmann2019b). Instead, I will engage with both phases of the methodology—fieldwork and geospatial analyses—and discuss the benefits of my confluent approach.
Geospatial Approaches Produce Objective, Comparable Data
This article utilizes Geographic Information Systems (GIS) to measure visual prominence, ruggedness, and visible extent. Although archaeologists highlight phenomenology as an alternative (e.g. Rennell Reference Rennell2012), these approaches produce qualitative data, making site-to-site comparisons extremely difficult. Also problematic is their subjectivity. Cultural context and observer identity will impact how a landscape is seen, experienced, and perceived. Archaeologists’ hypotheses and historical knowledge inevitably impact their descriptions.
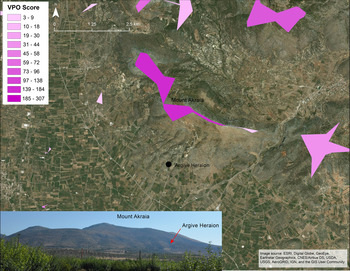
My geospatial methodology produces objective, comparable data. It facilitates exploration about whether viewshed or prominence—or both—were culturally relevant in the cultic placemaking process. In the case of prominence, my methodology also explores how the same place could have been noticed differently. The Argive Heraion sanctuary, located in the central Argive Plain, is an excellent example. Based on the CVSO analysis, this sanctuary is noticeable. Its location midway up Mount Akraia meant that it was visible at ranging distances across the Argive Plain. The VPO analyses tell a different story. The Argive Heraion yields a VPO score of 0; its mid-slope location made it unnoticeable against the horizon (Figure 10). Consequently, the Argive Heraion was noticeable, provided an observer knew where to look. During fieldwork, I did not notice such a distinction. I anticipated this sanctuary's prominence as a result of previous scholars’ work, all of whom highlight a CVSO-way of looking at the landscape (Cole Reference Cole1986:115–116; de Polignac Reference de Polignac1995:33; Foley Reference Foley1988:135; Kerényi Reference Kerényi2015:117).

FIGURE 10. The Argive Heraion sanctuary is located midway up Mount Akraia. Although portions of Mount Akraia yield a VPO (Visual Prominence of the Observer) score greater than 1, the sanctuary's boundaries do not intersect that area.
There are earlier sanctuaries in the region (e.g., Mount Arachnaion) with high VPO scores and CVSO scores close to 0, and here is where comparison against regional datasets, as well as critical engagement with excavation and historical data, becomes necessary (Susmann Reference Susmann2019b:140–153). Comparing the Argive Heraion's CVSO and VPO results against other contemporary sanctuaries in the Argive Plain (Figure 11), I concluded that Argive Plain inhabitants valued accessibility alongside prominence at specific moments, and these preferences are tied to cultural and political shifts (Susmann Reference Susmann2019b:153). Prior to the seventh century BC, sanctuaries such as Mount Arachnaion—located at a noticeable mountain peak—were preferred (Susmann Reference Susmann2019b:80–83).

FIGURE 11. Visualscape scores can be represented per sanctuary and isolate smaller study areas for detailed comparisons.
Fieldwork Can Identify Limitations in Analytical Parameters and Data Collection Strategies
Fieldwork provided critical ground-truthing data. Environmental factors such as vegetation, smoke, and light will impact what an observer sees, but archaeologists cannot record geospatial data for them at a regional level. As I collected data at each cultic place, I observed whether my ability to move and see was impeded or enhanced by certain variables.
To that end, fieldwork is necessary for identifying whether certain place types should not be included in the study. Greek archaeologists consider burials as cultic places (Antonaccio Reference Antonaccio1994:398). My fieldwork experiences drove me to exclude their results from Figure 9.Footnote 9 As I surveyed tholos tombs, for example, I began to recognize their extremely variable prominence. These are subterranean tombs covered with earthen mounds, and my ability to spot them depended on topography, vegetation, travel pathway, and direction of gaze. While Mason (Reference Mason2007) has successfully applied ancient roadway datasets to understand how travel routes impacted tholoi prominence, the study is specifically about the citadel of Mycenae and its surrounding tombs. Similar road datasets are not available for my entire study area.
My chosen geospatial approaches will yield misleading results about burial prominence. Quantitative data do not convey how minor topographic changes impact the observer's ability to see these small targets, and only fieldwork can provide such context. Consequently, although burials are considered Greek cultic places, their functional relationship to the landscape is very different from places such as altars or temples. Burials require a separate geospatial strategy, one that potentially measures degree of invisibility.
Phenomenology Transforms “Hyperclean” Archaeological Sites (Weddle Reference Weddle and Day2013:154) into Active Cultural Spaces
Phenomenology produces real-time data about human engagement with the landscape. At any given site, I encountered tourists, students, archaeologists, and state employees; I witnessed how every person's pauses, gazes, and movements were a product of their identity. These individuals animated my archaeological data points and transformed them into active cultural spaces (Barrett and Ko Reference Barrett and Ko2009:282).
My observations about modern people guided my interpretations about the ancient cultic landscape. Phenomenology reminded me of the precise subjects of my geospatial model. Consider Panhellenic festivals and the diverse group of visitors they attracted to sanctuaries every year. Devotees, athletes, politicians, vendors, and spectators came to the same sanctuary. The way each person engaged with it—their sense of place (Ashmore and Knapp Reference Ashmore, Knapp, Ashmore and Knapp1999:21)—was based on their identity, goals, and level of piety. This geospatial model measures visual impact as pertains to a worshiping observer. If an observer looked at the same landscape through a different cultural lens (e.g., political, social, defensive, ancestral), their attention could shift toward other places, topographies, and sensory experiences.
The geospatial analyses account for change over broad spans of time. Phenomenology models how visualscapes can change within a few hours. I left my apartment on a Saturday morning to travel to Epidaurus for data collection. It was a peaceful drive, and I had clear views of the surrounding landscape. A Ministry of Culture sign served as a landmark for my exit off the highway. Later that evening, I returned to Epidaurus for a theater performance. I followed the same pathway but my experience traveling drastically changed. Traffic made the route noisy, slow, and filled with exhaust fumes, and it altered the viewshed I had previously encountered. It was difficult to see past these other cars. Instead of a highway sign, the end of my journey was signaled by a grid-locked off-ramp.
This was a paramount—albeit unplanned—phenomenological experience because it forced me to think more creatively about immeasurable and time-sensitive impacts. The activities surrounding cultic practice—processions, lighting smoky fires, and sacrificing animals—would have temporarily increased a place's noticeability (Susmann Reference Susmann2019b:130–131, 134–136). The geospatial analyses do account for change over time, but short-term human impacts cannot be measured without other critical data: festival dates and durations, crowd size and travel patterns, and the number of sacral fires and their spatial extent.
CONCLUSIONS
Many archaeologists have discussed the complementary relationship between phenomenological approaches and geospatial analyses (Eve Reference Eve2012; Fábrega-Álvarez and Parcero-Oubiña Reference Fábrega-Álvarez and Parcero-Oubiña2019; Fitzjohn Reference Fitzjohn2007; Given Reference Given, Athanassopoulos and Wandsnider2004; Rennell Reference Rennell2012; Seamon Reference Seamon2014; Thomas Reference Thomas and Bender1993, Reference Thomas, Thomas and Jorge2008; Van Dyke et al. Reference Van Dyke, Bocinsky, Windes and Robinson2016). Geospatial technology produces quantitative, comparable data about the landscape, but these are problematically treated as “finished product[s]” (Brück Reference Brück2005:54; Thomas Reference Thomas, Thomas and Jorge2008:7). Phenomenology explores valuable questions about how humans shape—and are shaped by—the landscape. Critics understandably express concern about imprecise approaches and subjective interpretations (Brück Reference Brück2005; De Reu et al. Reference De Reu, Bourgeois, De Smedt, Zwertvaegher, Antrop, Bats, De Maeyer, Finke, Van Meirvenne, Verniers and Crombé2011; Fleming Reference Fleming1999). There is a wide gap between pixels and people, and archaeologists need clear pathways for bridging it. This reflexive methodology constantly interrogates either dataset's limitations and links. Phenomenology activates the geospatial data; quantitative methods pave the way for systematic examination of cultural behavior.
Ashmore's (Reference Ashmore2002:1173) life history framework was foundational in developing this approach. Every place's formation, decline, and possible revisitation was accounted for. During both the fieldwork and geospatial phases, I considered how these distinctive phases of use were physically represented in the landscape. I explored whether and why individuals’ pathways changed as a result, thereby dictating geospatial parameters. Creating dynamic timelines underscores the complexity of visualscape. What we see is born from individual and collective senses of place.
This is a precise, analytical framework for treating natural features as archaeological artifacts. Scholars can use it to collect, record, and organize archaeological and natural data. They can examine how the landscape impacted the siting of meaningful places—be they for worship or otherwise. That said, interested parties should be cautious in assuming that visibility analyses—and particularly those described here—will always produce meaningful results. Gillings says it best: “Whilst generating them has always been a relatively trivial task, knowing what to do with them once generated has proven far more difficult” (Reference Gillings2017:121). Indeed, visibility-based analyses are only as powerful as the questions they answer. There should be compelling cultural data to inspire their implementation.
This methodology was applied to the ancient Greek Peloponnese, but its impact reaches farther. All data—typological, visual, and methodological—are being moved into an open-access user interface (Susmann Reference Susmann2019a).Footnote 10 In addition to survey data, the interface provides access to methodological tutorials and database and interface codes, as well as my daily journals kept during the fieldwork and research phases.
Acknowledgments
I would like to thank Andrea Berlin, Mac Marston, Christopher Roosevelt, Curtis Runnels, and Bonna Wescoat for their guidance. I am indebted to staff at the American School of Classical Studies at Athens (ASCSA) and the Greek Archaeological Service for their cooperation. Data collection at the Sanctuary of Apollo Maleatas was completed in compliance with permit number 6569, granted by the Ephorate of Antiquities of Argolida. Data collection at Bassae was completed under permit number 2427, and data collection at Skilloundia was completed in compliance with permit number 6795, both granted by the Ephorate of Antiquities of Ilia. Data collection at all other sites did not require research permits, confirmed by the ASCSA and Greek Archaeological Service. I am grateful for the invaluable technical support offered by Wes Bernardini, Mark Gillings, Brian Gregor, and Boston University's Hariri Center for Computing and Computational Science & Engineering. This research was completed with the following research grants: Boston University Graduate Research Abroad Fellowship, Boston University Graduate Student Organization travel grant, GeoEye Foundation Award for the Application of High-Resolution Digital Satellite Imagery, and Boston University Digital Humanities Seminar Start-Up Grant.
Data Availability Statement
Spatial and visual data, methodological tutorials, field notes, and research journals from this project are freely available on an open-source interface: http://gncproj.org. The interface was launched in mid-September 2019. Readers are also encouraged to contact the author with any questions or data requests.
Supplemental Materials
For supplemental material accompanying this article, visit https://doi.org/10.1017/aap.2020.6.
Supplemental Database. Template of the Access database developed to record data for the survey as well as geospatial results. Field descriptions are included in each table's metadata; tables are also populated with sample records.
Supplemental Text. Descriptions of database schema to be used in conjunction with table metadata.