


Whether for drinking or for sustaining critical plant and animal resources, monitoring and managing available water resources is especially fundamental to the survival and longevity of complex societies (Scarborough Reference Scarborough2003, Reference Scarborough2015). For archaeologists studying prehistoric cultures, water can be a particularly tricky resource to calculate (e.g., Aiuvalasit Reference Aiuvalasit2017; Benson et al. Reference Benson, Griffin, Stein, Friedman and Andrae2014; Huckleberry et al. Reference Huckleberry, Ferguson, Rittenour, Banet and Mahan2016; Murrell and Shelley Reference Murrell and Shelley2009; Neely et al. Reference Neely, Aiuvalasit and Clause2015; Wright Reference Wright2006). Precipitation rates have changed substantially over the centuries and present physical land cover does not necessarily reflect past surface conditions, making it challenging to quantify water availability. This is especially true in places such as the Maya lowlands, where regionally there is plenty of water, but it is not uniformly everywhere nor in every month.
This study reports water capacity estimates for four reservoirs within the Classic Maya (AD 250–900) city of El Perú-Waka’, Guatemala. Detailed surface topographic data were collected using a total station and then processed as if collected for a post-occupancy civil engineering survey. Multiple interpolation methods were employed to estimate reservoir storage capacities using detailed topographic data collected with a total station. Comparison of the estimates indicates that although differing interpolation methods produce a range of variation in estimated water capacities, how reservoir margins and depths are defined have a substantially greater impact on capacity calculations. To further improve reservoir capacity estimations, the degree of post-abandonment slope wash within each catchment feature was modeled and removed using subsurface elevation data from soil cores and excavation locales across the four features. The combination of detailed topographic surface data and targeted subsurface data presents an effective methodological improvement to field investigation and data processing of managed water resources in the lowlands. More accurate data and methods on lowland Maya reservoir capacities are necessary to better understand how the coupled processes of surface hydrology, water storage, soil formation, and human intervention impacted and constrained urban water availability and quality maintenance.
Although a full examination of water resource management and distribution at El Perú-Waka’ is beyond the scope of the present article, this interdisciplinary collaboration highlights that the organization of ancient water management was often localized and multiscalar, and far more complex than recognized by polarizing centralized or decentralized models. Running counter to these traditional, binary approaches to water and water management (top-down or bottom-up), multiscalar organizational systems, such as documented for El Perú-Waka’ (see also Brewer Reference Brewer2018; Chase Reference Chase2016; Neely et al. Reference Neely, Aiuvalasit and Clause2015), complicate linear interpretations between control over water and power (e.g., Wittfogel Reference Wittfogel1957). Efforts to manage water in the city was solely reliant neither on royal decree nor on self-reliant householders. Instead, it relied on a multilayered network of social groups, relationships, and resources (e.g., Ersten Reference Ersten2010; Fedick Reference Fedick1996).
THE CLASSIC MAYA CITY OF EL PERÚ-WAKA’
The ancient city of El Perú-Waka’ (hereafter, Waka’) is located in the southwestern corner of the Classic Maya heartland, with its urban core perched at the edge of the escarpment that forms the southern and western limits of the Petén Karst Plateau (Marken Reference Marken2011; Figure 1). Its defensible location atop an 80 m high escarpment and advantageous position near the juncture of the Río San Pedro Mártir and its Río San Juan tributary likely fostered the city's role in both east–west and north–south overland trade during the Classic period (Eppich et al. Reference Eppich, Freidel, Guenter, Lee, Marken, Navarro-Farr and Rich2012). This combination of geographic factors may have also contributed to the historical importance of the city as one of the first places visited by Siyah K'ak’ in the Early Classic and whose dynastic loyalty was highly contested during the Late Classic regional conflicts between the dynasties of Tikal and Calakmul (Freidel and Escobedo Reference Freidel, Escobedo, Navarro-Farr and Rich2014; Freidel et al. Reference Freidel, Escobedo, Guenter, Sabloff and Fash2007).

Figure 1. Topographic map of the northern urban core of El Perú-Waka’ with the four investigated water storage features. (Figure by Robert Austin. Courtesy of PAW.)
The most striking aspect of Waka’ as a Maya city, however, is the dense clustering of its residential surface remains (Marken Reference Marken, Marken and Fitzsimmons2015; Marken and Maxson Reference Marken, Maxson, Pérez, Pérez and Freidel2017; Marken and Pérez Reference Marken, Pérez, Pérez, Pérez and Freidel2018); few Classic Maya sites exhibit such a high structure density (Canuto et al. Reference Canuto, Estrada-Belli, Garrison, Houston, Acuña, Kováč and Marken2018). Moreover, a variety of landscape features, as identified by archaeological survey and mapping, spill out from the urban core and clearly integrate the city's hinterland settlement into the urban fabric of Waka’ (Marken Reference Marken, Marken and Fitzsimmons2015). Looked at broadly, Waka’ is an excellent example of Classic Maya low-density, agrarian urbanism (Fletcher Reference Fletcher and Smith2012; Isendahl and Smith Reference Isendahl and Smith2013). Survey data describe a midsize monumental core embedded within a dense residential matrix, enveloped by a ring of periurban settlement and basins, and surrounded by a broader area of dispersed rural upland settlement dotted by satellite centers of mid- to small-sized monumental architecture (Marken, Ricker, et al. Reference Ricker, Marken, Bauer, Austin, Pérez, Pérez and B. Marken2019). This general characterization of the regional settlement is confirmed by ground verification of a recent lidar survey of the area (Canuto et al. Reference Canuto, Estrada-Belli, Garrison, Houston, Acuña, Kováč and Marken2018; Marken et al. Reference Marken, Cooper, Gemberling, Pérez, Austin, Pérez, Robles and Marken2020).
Recent fieldwork has investigated the coupled nature of how this modified ecological landscape developed through the combined study of topography, archaeological stratigraphy, and soil morphology within nonarchitectural landscape features, particularly where water collects, as suggested by hydrologic analysis of water flow—that is, reservoirs (Marken, Ricker, et al. Reference Ricker, Marken, Bauer, Austin, Pérez, Pérez and B. Marken2019; Maxson and Marken Reference Maxson, Marken, Pérez, Pérez and Freidel2018). These dual goals were accomplished by acquiring data from (1) detailed topographic mapping with a Total Station, (2) soil core transects and test excavations within six previously identified reservoirs, and (3) archaeological excavation of engineering features adjacent to these reservoirs (Marken Reference Marken2011; Marken, Austin, et al. Reference Marken, Ricker, Rivas and Maxson2019; Marken and Cooper Reference Marken, Cooper, Pérez, Pérez and Freidel2018; Marken and Ricker Reference Marken and Ricker2018; Ricker et al. Reference Ricker, Marken, Rivas, Pérez, Pérez and Freidel2017, Reference Ricker, Marken, Cooper, Pérez, Pérez and Freidel2018, Reference Ricker, Marken, Bauer, Austin, Pérez, Pérez and B. Marken2019).
RESERVOIRS WITHIN THE EL PERÚ-WAKA’ URBAN CORE
The Waka’ urban core sits atop the edge of a limestone escarpment that provides defensive security but severely limited local access to potable water resources. The karstic landscape atop the escarpment is porous, with no known natural freshwater resources in the form of springs, rivers, lakes, or swamps. Even regionally, freshwater resources are lacking; the lagoons 1.5 km to the east and the occasional springs that feed into the San Juan River to the south are brackish. The nearest major natural source of potable water is the large, spring-fed swamp, known locally as a cival, below the escarpment 3.5 km to the southeast.
With no easily accessible natural potable water resources to support the 2,800–4,500 people living within the Classic period Waka’ urban core (Marken Reference Marken2011; Marken et al. Reference Marken, Cooper, Gemberling, Pérez, Austin, Pérez, Robles and Marken2020), inhabitants modified naturally occurring karst depressions across their urban landscape into reservoirs to capture rainwater for household and community use. Surface hydrology indicates that an additional management function of this built landscape was to prevent the flooding of public and residential spaces during periods of intense rainfall by engineering urban surfaces to direct rainwater either into these catchment features or out of the city core entirely (Maxson and Marken Reference Maxson, Marken, Pérez, Pérez and Freidel2018). Indeed, both surface and excavation data indicate that excess surface water from rainfall (flooding), not scarcity, was a primary guiding concern in the design of Waka's urban water management landscape; some form of release or spillway system was built into every catchment feature to prevent overflow (Marken and Ricker Reference Marken and Ricker2018).
At present, the observed water catchment and storage features at Waka’ include community or district tanks (>1,180 m3 in estimated volume), residential reservoirs (215–690 m3 in volume), household aguadas (10–150 m3 in volume), and domestic pools (<10 m3 in volume; for more detailed type descriptions, see Marken and Ricker Reference Marken, Ricker, Eppich, Marken and Freidel2023; Marken et al. Reference Marken, Cooper, Gemberling, Pérez, Austin, Pérez, Robles and Marken2020). From 2016 to 2018, Marken and Ricker conducted investigations in and around six water catchment features across the northern sectors of the Waka’ urban core (Marken, Austin, et al. Reference Marken, Austin, Bauer, Ricker, Pérez, Pérez and Marken2019; Marken and Cooper Reference Marken, Cooper, Pérez, Pérez and Freidel2018; Marken and Ricker Reference Marken and Ricker2018; Ricker et al. Reference Ricker, Marken, Rivas, Pérez, Pérez and Freidel2017, Reference Ricker, Marken, Cooper, Pérez, Pérez and Freidel2018, Reference Ricker, Marken, Bauer, Austin, Pérez, Pérez and B. Marken2019). Features were selected for investigation based on surface characteristics (such as visible outlets) and surface hydrology. To better gauge the potential variability in local management practices and engineering, two community tanks, two residential reservoirs, and two household aguadas were targeted for investigation.
Field data within community tanks and residential reservoirs were collected through a combination of soil core transects (140), test pit excavations (12), and horizontal excavations of individual engineering features when present (e.g., outlets, access platforms, check dams; see below for greater detail on field methods). The small size of household aguadas hampered the utility of conducting soil core transects across these locales. Consequently, their investigation was limited to test excavations, and they have been excluded from the current study. In most cases, there were three distinct periods of soil formation observed: post-abandonment slope wash that filled in the reservoir after water management ceased in the city core, Maya cultural deposits and engineered surfaces (combination of limestone floors, fill, middens, dredged clay liners), and buried pre-Maya Vertisols characterized by shrink-swell clays. Many studies of reservoir capacity, particularly those relying on lidar data, utilize the modern surface as the bottom of the reservoir (e.g., Canuto et al. Reference Canuto, Estrada-Belli, Garrison, Houston, Acuña, Kováč and Marken2018); however, our soil research has illustrated that significant amounts of slope wash have filled many of the reservoirs since the Waka’ city core was abandoned. Consequently, estimates of water volume capacity from the modern surface are likely significantly less than actual storage capacity that corresponds to the time these reservoirs would have been in use.
Although general patterns in soil formation were observed across the study locales, each reservoir we evaluated was likely managed differently. Soil morphologies suggest that the Maya adapted to changing conditions at Waka’ by dredging or creating engineered structures to maintain high-quality freshwater resources in the city. Extreme land disturbance by the Maya throughout the region has resulted in erosion of uplands and deposition of clayey materials within lowland bajos (Dunning et al. Reference Dunning, Luzzadder-Beach, Beach, Jones, Scarborough and Patrick Culbert2002). Each reservoir in this study showed, to some degree, evidence of progressive infilling as would be expected given broad regional trends in land use change.
Urban water management at Waka’ was relatively simple on the surface: avoid flooding public and residential areas. Buildings and open spaces were engineered to direct runoff toward local sinks and internal low areas so as to pool and eventually be consumed, released to the outskirts of the city, or sometimes, slowly drain through the karstic upland parent material. Maintaining potable freshwater ponds in a tropical urban environment, however, was influenced by a variety of additional physiographic factors and sociocultural management practices, not simply directing and collecting water (e.g., Fowler Reference Fowler2013; Lentz et al. Reference Lentz, Hamilton, Dunning, Scarborough, Luxton, Vonderheide and Tepe2020; Scarborough et al. Reference Scarborough, Dunning, Tankersley, Carr, Weaver, Grazioso and Lane2012). Beyond their application here, soil morphology metrics within rainwater catchment systems will also be useful to better understand how management practices evolved through time. The morphologies of Waka's reservoirs, as is the case elsewhere (e.g., Akpinar Ferrand et al. Reference Akpinar Ferrand, Dunning, Lentz and Jones2012; Beach et al. Reference Beach, Luzzadder-Beach, Flood, Houston, Garrison, Román, Bozarth, Doyle, Lentz, Dunning and Scarborough2015), clearly indicate periods of use and renovation (fill and engineered surface layers), as well as episodic maintenance (dredging), overlain by more modern, post-abandonment soil profiles (Ricker et al. Reference Ricker, Marken, Bauer, Austin, Pérez, Pérez and B. Marken2019). This is further evidence that Maya urban populations were constantly adapting resource management practices in response to inherited ecological circumstances and evolving settlement decisions (e.g., Webster and Murtha Reference Webster, Murtha, Lentz, Dunning and Scarborough2015).
Data from the Proyecto Arqueológico Waka’ (PAW) water management feature excavations indicate that most engineering projects to collect surface rainwater engaged in what we describe as “adaptive management practices.” This is reflected by the fact that water management features within the Waka’ urban core were rarely “overengineered.” Modifications appear to have typically addressed immediate concerns (Marken and Cooper Reference Marken, Cooper, Pérez, Pérez and Freidel2018; Marken and Ricker Reference Marken and Ricker2018; Marken, Austin, et al. Reference Marken, Austin, Bauer, Ricker, Pérez, Pérez and Marken2019). Even when part of a larger water management system, each tank within the core was different, engineered and managed to meet locally specific requirements and challenges that varied, by feature, through time. At times, these features were later modified when changing circumstances required adaptive management, often with additional energetic investment (see also Webster and Murtha Reference Webster, Murtha, Lentz, Dunning and Scarborough2015).
Northeast Tank
The Northeast Tank (Figures 1 and 2) is located 275 m northeast of the ceremonial center, measuring an estimated 6,498 m2 surface area at its maximum capacity. Across Waka's central urban landscape, it was one of the city's largest water catchment features, and it likely serviced residents from several residential groups. GIS analyses of surface hydrology indicate that the tank was part of a larger engineered hydrological system that includes the Xucub Reservoir (Marken, Ricker, et al. Reference Ricker, Marken, Bauer, Austin, Pérez, Pérez and B. Marken2019; Maxson and Marken Reference Maxson, Marken, Pérez, Pérez and Freidel2018); in periods of intense rainfall, overflow from the Xucub Reservoir would have spilled into the Northeast Tank. When in use, the bottom of the tank was lined with large limestone slabs and blocks across its entire surface, as revealed by 83 soil cores and five test excavations (Ricker et al. Reference Ricker, Marken, Rivas, Pérez, Pérez and Freidel2017, Reference Ricker, Marken, Bauer, Austin, Pérez, Pérez and B. Marken2019). Although energetic estimates are still underway, considering the large surface area of the feature, this floor “pavement” represents a significant community labor investment. Field and lab analyses of the soils underlying the limestone floor demonstrate that during the rainy season, groundwater containing soluble gypsum salts rises within the northern portion of the tank. It is quite plausible that the limestone floor was constructed to prevent these salts from contaminating the collected surface waters (Ricker et al. Reference Ricker, Marken, Bauer, Austin, Pérez, Pérez and B. Marken2019). In addition to limestone floors, the Northeast Tank soil evaluations indicated areas of clay dredging and movement from the truncated Vertisols of the tank center to the northern edges of the tank. Soil descriptions suggest that periodic dredging was used to deepen the center of the reservoir, but the clay was moved internally to build up access terraces on the margins. Dry cores below the modified surface cultural layers revealed deep native bajo clay deposits (>200 cm to limestone bedrock), indicating that this area was not a quarry for earthen construction materials—instead, it was a naturally occurring sinkhole that was modified for water management purposes (Ricker et al. Reference Ricker, Marken, Bauer, Austin, Pérez, Pérez and B. Marken2019).

Figure 2. El Perú-Waka’ reservoirs with locations of soil cores (black X) and test pits (green rectangles): (a) Northeast Tank, (b) Ical Tank, (c) Xucub Reservoir, and (d) Plaza 1 Reservoir. (Figure by Robert Austin. Courtesy of PAW.)
The Northeast Tank was constructed with an outlet to release excess water to prevent overflow. This outlet lacked any formal architecture—although a massive, limestone boulder with heavy rippled water marks was placed within the center of the outlet, potentially as part of a system to regulate outflow. Although masonry was employed to retain and release water from the Ical Tank (see below), excavations across the Northeast Tank outlet revealed no cut-limestone masonry. Instead, medium-sized, smoothed limestone blocks were embedded within a dense, brown clay matrix layered atop bedrock to create the west outlet berm and to function as a form of riprap to prevent its erosion (Marken, Austin, et al. Reference Marken, Austin, Bauer, Ricker, Pérez, Pérez and Marken2019). This riprap was absent from the east berm, which consisted of cut bedrock with low erosion potential. Low-access terraces were also built along the southern and eastern sides of the tank to facilitate access as water levels dropped during the dry season.
Ical Tank
The Ical Tank is one the smaller-sized community tanks identified within the urban core, with an estimated 2,669–3,053 m2 surface area (normal-maximum capacity). Located in the northwestern sector of the urban core, within the Ical Neighborhood, approximately 280 m north of the Palace, the catchment feature is encircled by residential patios, including the Ical Group itself, an elevated acropolis built atop a modified hilltop. Excluding the Ical Group acropolis, the Ical Tank is surrounded by 13 structures, and the northwest corner of the tank is banked by a short causeway of leveled bedrock. North of this causeway is a shallow gully that could have served as a spillway during instances of extreme overflow. Puncturing the northeastern corner of the tank is a clear surface outlet, apparent both visually and through hydrological analyses of PAW-collected topographic data. Excavations across the outlet revealed 4 m of a buried masonry wall atop bedrock, approximately 30 cm wide and 15 cm high, running parallel to sides of the outlet (Marken and Cooper Reference Marken, Cooper, Pérez, Pérez and Freidel2018).
The floor of the Ical Tank consisted of small blocks of cut limestone fitted together, as revealed by 28 soil cores and two test excavations units. A series of low (one course) terraces were constructed on the southern portion of the reservoir, similar to those encountered in the Northeast Tank (Ricker et al. Reference Ricker, Marken, Cooper, Pérez, Pérez and Freidel2018). An additional 1 × 3 m excavation trench on the southeastern corner of the reservoir revealed that the reservoir edge consisted of three courses of limestone blocks built atop cut bedrock to increase capacity (Marken and Cooper Reference Marken, Cooper, Pérez, Pérez and Freidel2018). Excavations within the Ical Tank revealed unaltered Vertisols beneath cultural layers and pavement, suggesting that the Maya only modified the surface of this naturally occurring sinkhole and that dredging was not required to maintain sufficient water volume for localized uses (Ricker et al. Reference Ricker, Marken, Cooper, Pérez, Pérez and Freidel2018).
Xucub Reservoir
At an estimated surface area of 1,267–1,761 m3, the Xucub Reservoir is significantly smaller than the much larger Northeast Tank to the east. Field investigation consisted of 15 soil cores, one central test excavation, a 1 × 3 m slot trench on the eastern edge, and a 6 m2 excavation in the southwest corner (Marken and Ricker Reference Marken and Ricker2018). Although connected hydrologically to the Northeast Tank, this feature is surrounded by the residential structures of the Xucub Group, suggesting more restricted consumer access than the community tanks. Two excavations along its margins revealed a two-course masonry edge on the east and a low, access platform in the southwest corner. Unlike the larger tanks, the Xucub Reservoir lacks a limestone masonry floor. Instead, it was lined with a layer of dense packed clay to retain water. The clay found within this reservoir was likely sourced from the adjacent Northeast Tank, which showed evidence of periodic dredging of native Vertisol clays.
Plaza 1 Reservoir
Located on the north side of Plaza 1 within the ceremonial center, the Plaza 1 Reservoir is the smallest of the four water catchment features included in this study in terms of estimated surface area (870–1,044 m2). Eighteen soil cores and a 1.5 × 3 m excavation trench on the northern edge, however, indicate that this feature experienced the greatest depth of post-abandonment infilling. This is likely in part due to the closed nature of its hydrology and its likely function as a civic storm drain; both Plaza 1 and Plaza 2 were engineered with a slight canter to direct surface water in the Plaza 1 Reservoir (Maxson and Marken Reference Maxson, Marken, Pérez, Pérez and Freidel2018). The reservoir itself lacks a visible surface outlet, suggesting that it was constructed atop a natural porous sinkhole that is to some degree plugged with eroded sediments to allow subsurface drainage.
SURFACE MODELING
Over seven years (2003–2006 and 2014–2016), PAW surveyors collected elevations at 89,658 locations over a 98.8 ha area within the Waka’ urban core (e.g., Marken and Maxson Reference Marken, Maxson, Pérez, Pérez and Freidel2017). Topographic data were collected using a Trimble 3306 Total Station and stored in a TDS Data Collector. In addition to the topographic points, 20 reservoir excavation sites and all soil cores were surveyed, and their elevations were used in the creation of the surface models. Total station data was recorded in a locally defined coordinate system, which was then translated using approximate UTM WGS Zone 15 (EPSG:32615) coordinates of survey benchmarks recorded with a Garmin Etrex Vista HCx handheld GPS unit.
Elevation models from the PAW topographic surveys were developed using an inverse distance weighted (IDW) interpolation (Shepard Reference Shepard1968), a radial basis function (i.e., spline; Talmi and Gilat Reference Talmi and Gilat1977), a local polynomial (Watson Reference Watson, Amos and Gilat1980), and a kriging prediction model (Krige Reference Krige1951; Figure 3). All interpolation methods were parameterized so as to minimize the estimated Root Mean Square Error (RMSE) using a “leave-one-out” cross-validation procedure provided within the ESRI ArcGIS Geostatistical Analyst extension (Supplemental Table 1). Kriging was performed using an ordinary model (mean unknown but constraint) and parameterized using a semivariogram that minimized the error in the resulting prediction surface. The semivariogram was developed using data points located directly within and surrounding the reservoirs to assure that the model best captured the spatial structure of these features. Survey points were selected within a uniform buffer distance from the maximum brim elevation so as to exclude features that neighbor but are topographically distinct from the reservoirs, such as plateaus and architecture. The strength and distance of spatial autocorrelation identified in the semivariogram was also used to help initialize and guide the parameterization of the deterministic interpolators. In all cases, the simplest model with an equivalent RMSE was selected to avoid overfitting. Digital elevation models (DEMs) were produced at a 0.5 × 0.5 m cell size and used to compare estimates of the present-day reservoir volumes between the two data sources and interpolation methods. Contours based on each elevation model were derived at 0.5 m and 0.2 m intervals and used to identify the size and shape of each reservoir's brim as well as its respective brim height.
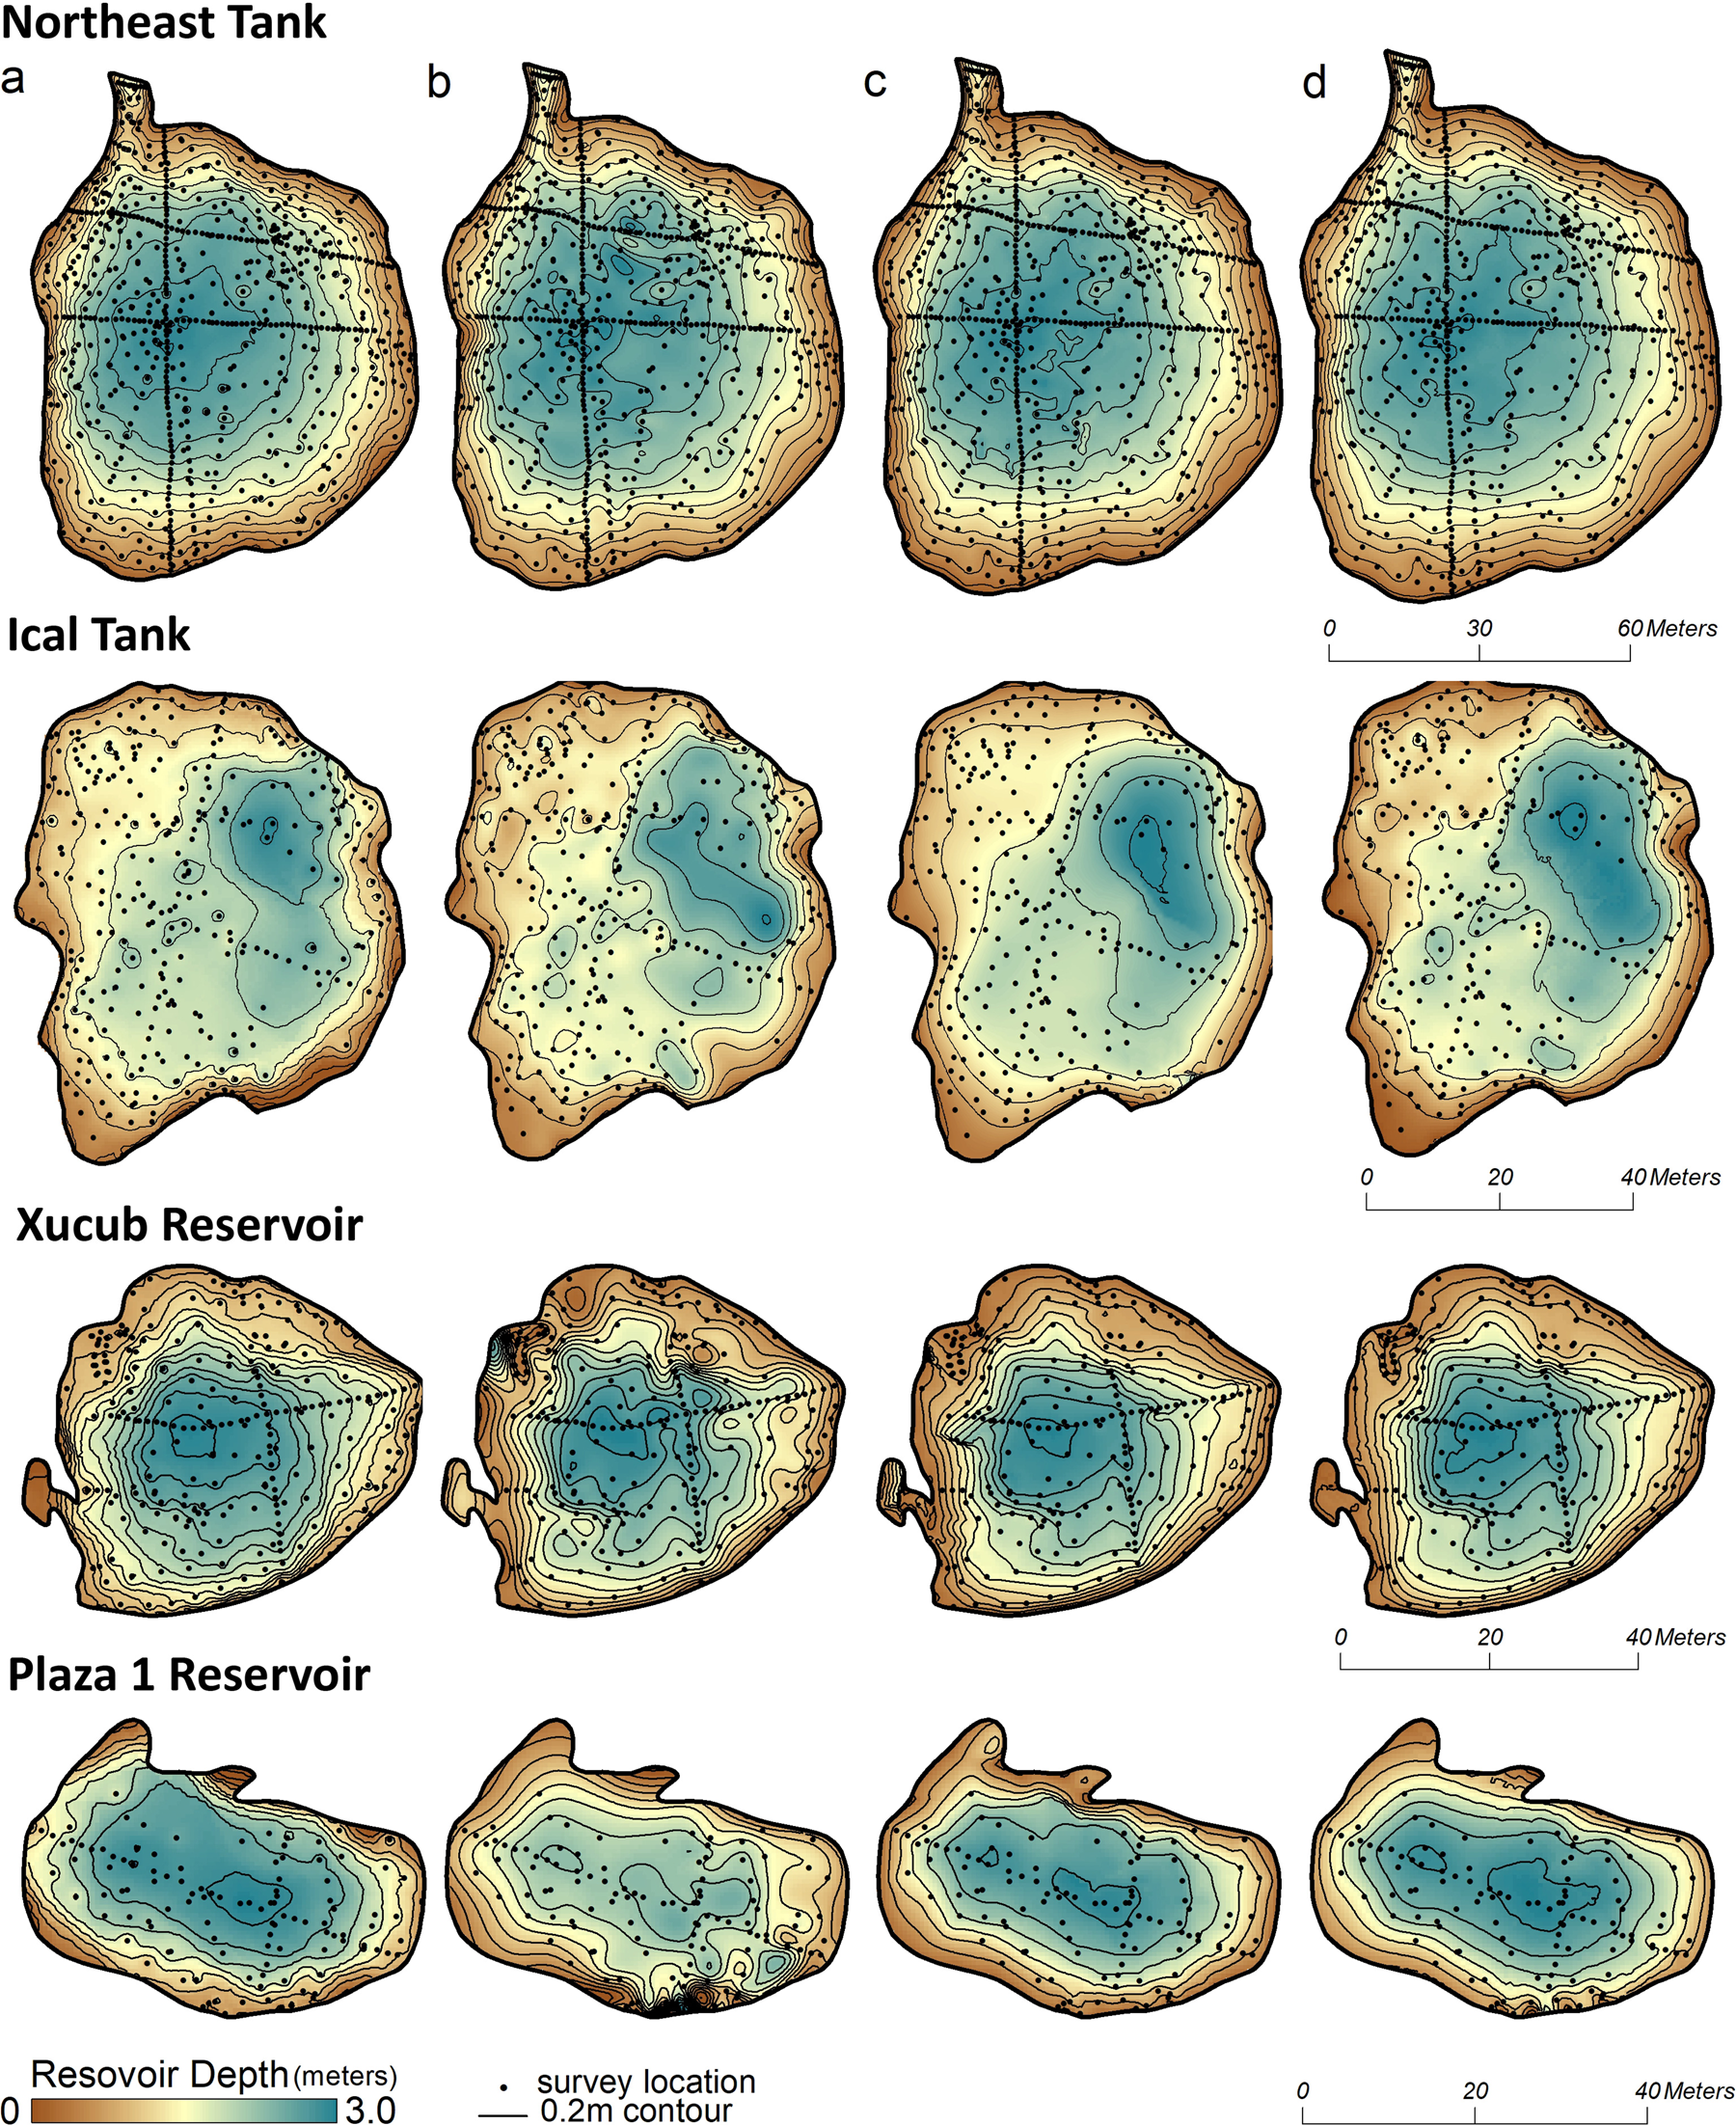
Figure 3. Comparison of surface models used to develop present-day reservoir volume estimates for the four water catchment features. Models were interpolated using (a) inverse distance weighted (IDW), (b) regular basis (spline), (c) local polynomial, and (d) kriging methodologies. (Figure by Robert Austin. Courtesy of PAW.)
Estimated “normal” and “maximum” (“to the brim”) capacities were identified to provide a range of reservoir capacity better reflective of the seasonality of rainfall in the lowlands. Maximum capacity estimates are used for comparison with other studies (e.g., Beach et al. Reference Beach, Luzzadder-Beach, Flood, Houston, Garrison, Román, Bozarth, Doyle, Lentz, Dunning and Scarborough2015; Scarborough et al. Reference Scarborough, Dunning, Tankersley, Carr, Weaver, Grazioso and Lane2012). The location of each reservoir brim was identified as a single elevation contour calculated from the DEMs and derived from the topographic survey. The brim contours were selected based on the physical characteristics of the reservoir and observations by the authors regarding outflows and the local surface hydrology. Maximums (“to the brim”) were identified as the points where water would spill over the reservoir into surrounding structures or flow out of a noncontrolled outlet (overflow). Normal levels were below this—the contour that represented water at the base of the outlet—but contained within the reservoir (not overflowing, but full).
Water holding capacity was calculated in GIS software by subtracting the hypothetical water surface (i.e., brim elevation) from the DEM representing the reservoir. Values in the resulting raster represent the height of the water column at each cell location, and they were used to calculate the maximum reservoir depth as well as the total water holding capacity. This method was used to calculate a normal and maximum reservoir capacity from each of the four different surface interpolation methods as well as from the lidar-derived surface model (Table 1).Footnote 1
Table 1. Present-Day Reservoir Surface Capacity Estimates.

aIDW = Inverse distance weighted.
The predictions and corresponding measures of uncertainty provided by geospatial interpolation methods are only accurate if the interpolation method is based on a model that adequately fits the data. Results from the cross-validation indicate that the local polynomial and kriging methods produce equally accurate surface models with an average RMSE around 0.1 m (Supplemental Table 1). In comparison, predicted values from IDW and spline were less accurate, with an average RMSE around 0.19 m. The mean error was less than 0.01 m across all interpolation methods, indicating that all methods were equally unbiased in their predictions.
Of the two most accurate predictors, the kriging model and its corresponding semivariogram were developed without a nugget effect and therefore honor measured values regardless of uncertainty or measurement error—a reasonable assumption with data collected using a total station and experienced surveyors. In comparison, the inexact nature of the local polynomial model results in a smoother surface with fewer discontinuities that reflects the spatial correlation of the broader dataset.
Because predicted values at measured locations are not forced to honor measured values, locally high and low elevations have less effect on the residual than if the surface was forced through those neighbors. Consequently, the overall accuracy of the local polynomial is assumed better because of the lower RMSE than that of the other deterministic exact interpolators in this study (IDW and spline). However, consideration must be given to its approximating nature and potential to predict elevation values outside the measured range.
Results from using an exact versus inexact interpolation to represent a reservoir's shape are illustrated in Figure 3. A more generalized, smooth reservoir is modeled by the local polynomial (Figure 3c), where the exact interpolators (Figure 3a, 3b, and 3d) produce a more irregular, undulating surface. The kriged model is between these extremes and benefits from statistical rigor provided by modeling the spatial autocorrelation. Additionally, the kriged model best fits the measured data as indicated by cross-validation while minimizing local extremes in areas with less dense field measurements. As such, the kriged model is assumed the best fit and most representative of present-day conditions. Nevertheless, despite their aesthetic variation, the four interpolation methods are relatively similar in terms of capacity estimates.
SUBSURFACE MODELING: CALCULATING SLOPE WASH
Soils were described during the 2016, 2017, and 2018 PAW field seasons from dry soil cores along perpendicular transects. Soils were sampled and described every 5 m along each transect from the upland constructed edges of the four study reservoirs inward for a total of 140 evaluations. Soil was removed in approximate 20 cm increments using a hand-operated soil bucket auger with clay head attachment (8.5 cm diameter). Soil was removed in increments and placed in a 210 cm polyvinyl chloride (PVC) half-core for description. Soil sample depths were checked repeatedly during removal to maintain proper sample depths. Cores were taken to a maximum depth of 200+ cm with auger extensions or until auger refusal on hard surfaces such as limestone blocks, bedrock, or extremely gravelly fill horizons. Soil test pits were also excavated by hand at locations of possible water management structures identified during soil coring. All reservoir test pits (n = 12) were either 1.5 × 1.0 m or 2.0 × 1.0 m excavations to 100+ cm depth. Soil morphological features were described using standard methods (Schoeneberger et al. Reference Schoeneberger, Wysocki, Benham and Staff2012) in cores or from representative pit faces within test pits. Field moist soil colors were described in Munsell notation, and soil horizons were also tested for the presence of carbonates using dilute hydrochloric acid (10% HCl) on the primary soil matrix (Schoeneberger et al. Reference Schoeneberger, Wysocki, Benham and Staff2012). We noted changes in parent material (lithologic discontinuities) from post-abandonment slope wash, to Maya anthropogenic deposits, and pre-Maya Vertisols at each location (Figure 4).

Figure 4. Representative test pit face from the Ical Tank showing the three major soil parent materials present in regional Maya reservoirs (measuring tape in cm and m). The upper material is humus-rich eroded loamy slope wash (0–53 cm) that has filled in on top of the limestone constructed floor (53–84 cm) of the Ical Tank. Below the Maya surface is a native Vertisol consisting of shrink-swell clays (84–220 cm) and fractured limestone bedrock at 220 cm. Broken or uneven limestone floors and terraces are commonly observed in reservoirs due to argilliturbation in the capped vertic soils. (Photo by Matthew Ricker. Courtesy of PAW.)
The volume of slope wash within each reservoir was calculated using the measured thickness along the soil survey transects (Table 2). Thickness was interpolated using the same methods as applied in the creation of the surface models (IDW, Spline, Local Polynomial, and Krig) and confined to the spatial extent of the maximum reservoir capacity. Values with a negative thickness were set to zero, and the total volume of slope wash was calculated from the resulting raster dataset. The total volume of slope wash was removed from the present-day reservoir capacity to provide an estimate of reservoir volumes when in use. The estimates were calculated for each interpolation method and used to illustrate the importance of the interpolation method and the inclusion of slope wash measurements in the understanding of historical estimates of reservoir capacity.
Table 2. Calculated Slope Wash Volumes.

aIDW = Inverse distance weighted.
Results from cross-validation indicate little advantage between interpolation methods in the estimate of slope wash volume within a reservoir (Supplemental Table 2). On average, and when performed across reservoirs, the mean estimated error in slope wash thickness at measured locations was 0.25 m. Accuracy of predictions was closely related to the average thickness of slope wash measured within a reservoir (r = 0.93) and the variability of the thickness within the reservoir (r = 0.75). In all instances, however, mean error was less than 0.05 m and normally distributed, therefore supporting that the overall accuracy of the predicted thickness across the entire transect is without bias toward an over- or underestimate of slope wash. However, it also highlights the importance of measured values in areas with rapid changes in slope wash thickness and that consideration should be given to data collection activities surrounding those areas.
RESULTS: ESTIMATED “IN-USE” RESERVOIR CAPACITIES AND EL PERÚ-WAKA’ DEMOGRAPHY
As expected, the removal of the slope wash significantly increased capacity estimates regardless of interpolation method (Table 3). Variation in the percent increase in volume estimates between individual features can be explained by their physical characteristics and context. For instance, the more limited slope wash depth of the Northeast Tank results from its large size and broad extent; debris or fill washed in during heavy rainfall events is less likely to accumulate toward its center compared to smaller reservoirs. Alternatively, the massive estimated capacity increase of the Plaza 1 Reservoir is likely a result of its relatively modest size combined with its primary function of collecting stormwater from the plastered impervious surfaces of the ceremonial center. Once the city was abandoned and the maintenance of its urban infrastructure ended, the Plaza 1 Reservoir became a receptacle for any subsequent debris from these broad, open spaces.
Table 3. Estimated Total Reservoir Capacity and Percent Increase from Surface Estimates.

aIDW = Inverse distance weighted.
The increased capacities for these four El Perú-Waka’ reservoirs have potentially profound implications for interpretations of Classic Maya water-storage potential and urban carrying capacities. Centralized control over water resources during dry-season scarcity is often cited as a critical pillar to dynastic power and authority over regional populations (Lucero Reference Lucero, Bacus and Lucero1999, Reference Lucero2006; Scarborough Reference Scarborough2003).
Using an ethnoarchaeological water consumption rate from the present-day Maya community of Xculoc, Campeche (Becquelin and Michelet Reference Becquelin and Michelet1994) of 17 L/day/person, the capacity estimates enable the calculation of the number of people that could have been supported by each reservoir during an approximately 120-day dry season (Table 4). Combined, the four water catchment features analyzed here had the potential to supply water for the entire 3,000–5,000 estimated absolute Late Classic population of the El Perú-Waka’ urban core (Marken et al. Reference Marken, Cooper, Gemberling, Pérez, Austin, Pérez, Robles and Marken2020) throughout the dry season if filled to “normal” levels at the end of the rainy season. At “maximum” capacity, these four features could have easily supported all urban core residents during the dry season with plenty to spare. Although additional factors must be considered to fully understand the dynamics of Waka’ water management practices and demography—such as evaporation rates (see below) and to what degree was collected water also used for cultivation—they are beyond the scope of the present study. Nevertheless, these four water catchment features are only a handful of the identified water catchment features within the El Perú-Waka’ urban core, indicating that the city experienced an abundance of water resources available for its residents.
Table 4. Estimated Populations Supported by Investigated Reservoirs at Normal and Maximum Brim Capacities.

aIDW = Inverse distance weighted.
DISCUSSION
The methods described here can be used to better study tropical water management and more accurately estimate the water storage capacities of lowland Maya urban landscapes, and they could be easily adapted to in-filled—yet visible—water collection features elsewhere (e.g., Fletcher et al. Reference Fletcher, Penny, Evans, Pottier, Barbetti, Kummu and Lustig2008). Soil core transects provide a rather efficient means of acquiring subsurface topographic data, although the models here would be improved by additional coring along reservoir margins. When available, stratigraphic data from test and trench excavations along margins were key to improving subsurface coverage.
In quantifying a challenging and hard-to-model resource through a multiscalar and interdisciplinary approach that combines field surveys and soil analyses into multiple GIS surface and subsurface models, this research informs previous water management studies in tropical lowlands. Soil stratigraphy and morphology, in particular, improve estimates derived from modern surface topography alone (e.g., Brewer et al. Reference Brewer, Carr, Dunning, Walker, Hernández, Peuramki-Brown and Reese-Taylor2017; Murrell and Shelley Reference Murrell and Shelley2009). Visual and statistical comparisons of the four interpolation methods used indicate that “brim” height and area definitions are the primary drivers in archaeological estimations of water storage capacity, not method of interpolation. This recognition will be vital to accurately estimating future reservoir capacities, even beyond the Maya area.
Between manual (transect) measures and the four GIS modeling techniques used in this analysis, the GIS models provide more reliable estimates. With similarly low RMSE, the four models produced relatively similar results, although kriging produced models that best visually capture both detail and a “smoothed” surface. In contrast to calculation method, reservoir depth—“normal” versus “maximum” levels—has a profound impact on capacity estimates for both surface and subsurface estimates. Considering the proliferation of lidar surveys across the Maya area, the importance of explicitly defining “the brim” in regional estimations of water catchment capacities cannot be understated. Recognizing that the estimates in Table 4 reflect a single facet of regional carrying capacity, rather than actual inhabitants, access to water resources is nevertheless regularly cited as limiting demographic concentration in the Maya populations (e.g., Webster Reference Webster2018).
An additional factor to consider briefly is water loss through evapotranspiration (ET). Although localized data are lacking, the global potential ET rate for this climate today is approximately 1,200 mm annually, which translates to approximately 0.40 m loss in water column depth for a 120-day dry season (Numerical Terradynamic Simulation Group 2021). This implies that 15%–40% of maximum water storage capacity could be lost to evapotranspiration without the influx of new rainfall during the dry season. Although the impacts of potential ET rates merit further investigation in the study of Maya water management practices, considering that these four study reservoirs are just a handful of the total identified at Waka’ (there are nine additional ones of comparable size within the core), their capacity data still suggest that, with sufficient rainfall, stored water was rather abundant. As discussed above, reservoir morphology and surface hydrology, designed for flood control, also support this interpretation.
CONCLUSION
By combining field survey, soil analysis, and a variety of GIS interpolation methods in a multiscalar and interdisciplinary approach, a challenging resource—water—and its availability can be more fully quantified. This is accomplished by comparing interpolation methods for estimating reservoir capacities to demonstrate that most do in fact provide reliable estimates. Reported estimates are further enhanced by analyzing internal reservoir soil morphology to better understand and quantify formation processes and sharpen estimates from field survey. These analyses document a multiscalar organization to water management within the Waka’ urban core that likely ran the gamut from individuals up to civic and state institutions. Although some infrastructural landscape features within Classic Maya cities may have, at times, been regulated by “centralized” authorities, many others were built and managed, in practice, by households and local communities that maintained and managed their own resources in response to local needs (e.g., Ersten Reference Ersten2010; see also Chase Reference Chase2016; Evans et al. Reference Evans, Vis, Dunning, Graham and Isendahl2021). Although its intricacies remain to be fully elucidated, this example offers an alternate path to theorizing about water management practices from traditional binary approaches.
Acknowledgments
The field data reported here were collected under permits by the Instituto Nacional de Antropología e Historia of Guatemala to the Proyecto Arqueológico Waka's (PAW), directed by Juan Carlos Pérez Calderon and David Freidel in 2016–2017 and Pérez Calderon and the senior author in 2018. Funding for this research was provided by a National Geographic Society Research Council Grant (#HJ-100R-17) and by the GeoOntological Development Society (2016–2018). Alex Rivas (2016), Zachary Cooper (2017), Haley Austin, and Hannah Bauer (2018) assisted in field data collection. None of PAW's research since 2003 would have been possible without collaboration with members of the local communities of Paso Caballos, La Cebita, and Cruce Perdita. An earlier version of this article was presented online at the 86th Annual Meeting of the Society for American Archaeology in April 2021. The authors would also like to thank David Freidel and Timothy Murtha for edits and comments on earlier drafts of this article.
Data Availability Statement
In accordance with the wishes of the Instituto Nacional de Antropología e Historia of Guatemala (IDEAH), the raw topographic data used in the presented models are not available to the general public so as to protect the country's archaeological and cultural resources. However, the data files are on file with IDEAH and the Proyecto Arqueológico Waka’ (PAW), and they may be provided to qualified professional researchers for valid teaching and learning purposes on a limited basis. The person to contact in Guatemala is Juan Carlos Pérez Calderon (juancacpn@gmail.com), director of PAW, who can assist in securing the necessary permissions from IDEAH. PAW archaeological data have been collected under an annual permit issued by IDEAH since 2003. Annual PAW reports are available for download at https://mesoweb.com/informes/informes.html.
Supplemental Material
For supplemental material accompanying this article, visit https://doi.org/10.1017/aap.2022.6.
Supplemental Table 1. Spatial interpolation methods and their corresponding cross-validation error used to develop topographic models representing the current size and shape of each reservoir. Reservoirs were modeled from data collected during the PAW survey and the soil subsurface transects and excavation sites. Mean error was less than measurement error for all methods.
Supplemental Table 2. Accuracy of methods used to estimate slope wash within each reservoir and across all reservoirs. Accuracy is measured as the average difference in slope wash thickness from measured to predicted thickness using a leave-one-out analysis.
Competing Interests
The authors declare none.


